. 2019 Dec;3(12):1009-1019.
doi: 10.1038/s41551-019-0420-5. Epub 2019 Jul 8.

Matrix stiffness induces a tumorigenic phenotype in mammary epithelium through changes in chromatin accessibility

Affiliations

Matrix stiffness induces a tumorigenic phenotype in mammary epithelium through changes in chromatin accessibility

Ryan S Stowers et al. Nat Biomed Eng. 2019 Dec.

Abstract

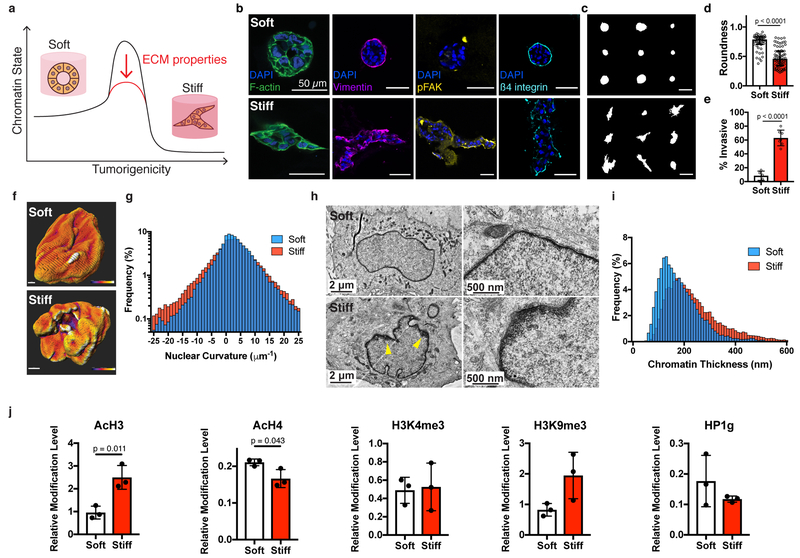
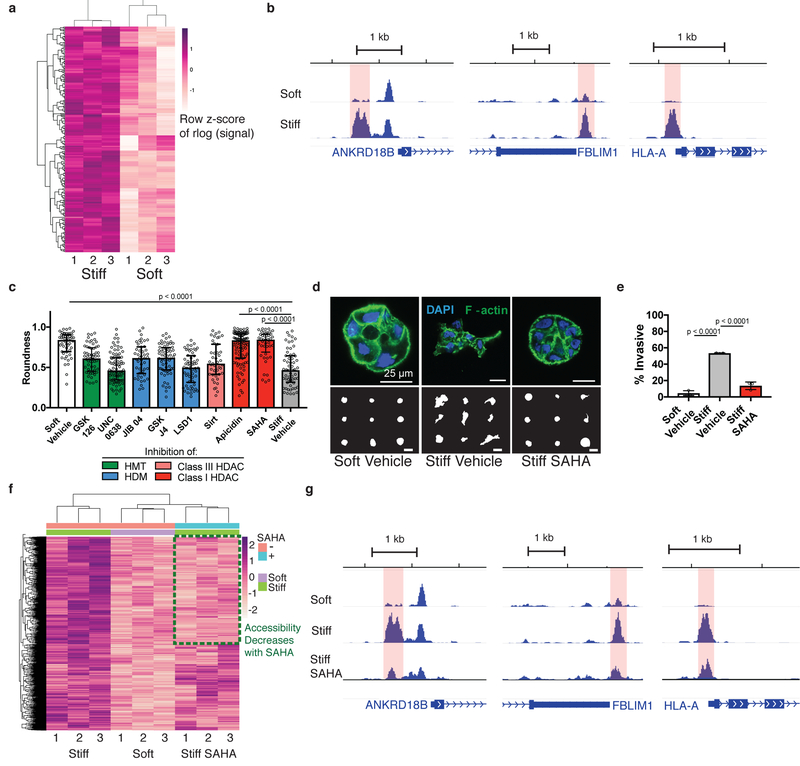
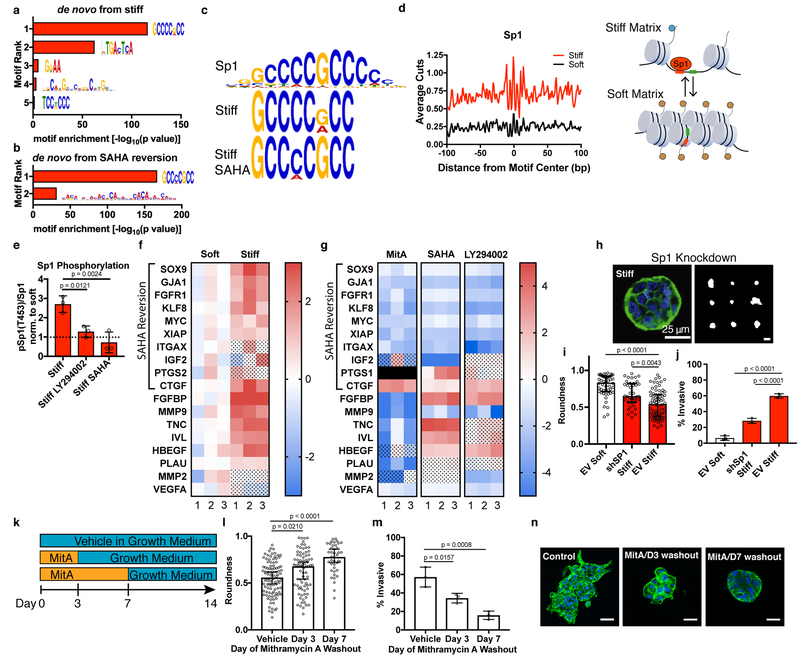
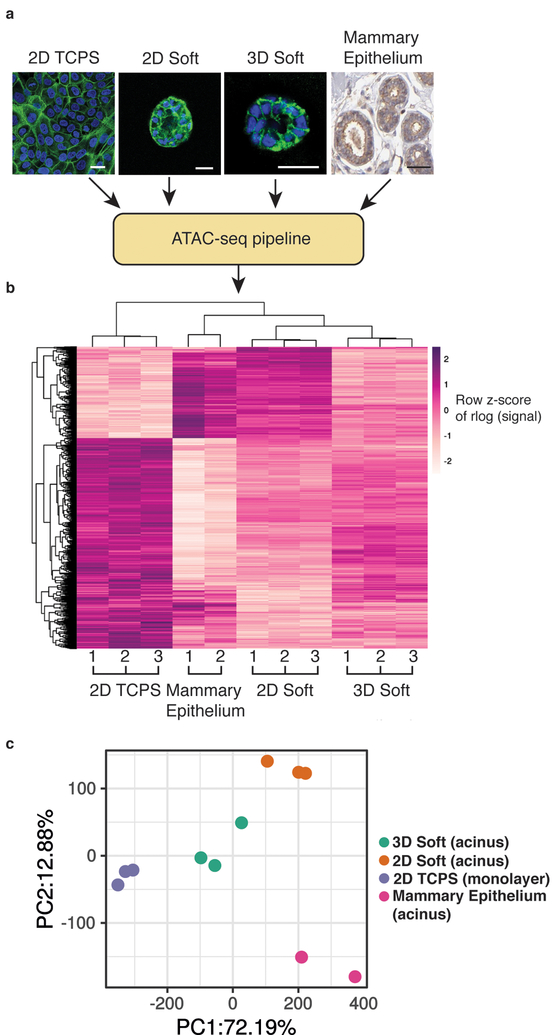
In breast cancer, the increased stiffness of the extracellular matrix is a key driver of malignancy. Yet little is known about the epigenomic changes that underlie the tumorigenic impact of extracellular matrix mechanics. Here, we show in a three-dimensional culture model of breast cancer that stiff extracellular matrix induces a tumorigenic phenotype through changes in chromatin state. We found that increased stiffness yielded cells with more wrinkled nuclei and with increased lamina-associated chromatin, that cells cultured in stiff matrices displayed more accessible chromatin sites, which exhibited footprints of Sp1 binding, and that this transcription factor acts along with the histone deacetylases 3 and 8 to regulate the induction of stiffness-mediated tumorigenicity. Just as cell culture on soft environments or in them rather than on tissue-culture plastic better recapitulates the acinar morphology observed in mammary epithelium in vivo, mammary epithelial cells cultured on soft microenvironments or in them also more closely replicate the in vivo chromatin state. Our results emphasize the importance of culture conditions for epigenomic studies, and reveal that chromatin state is a critical mediator of mechanotransduction.


Conflict of interest statement

Competing interests

The authors declare no competing interests.

Figures

Fig. 1 |
Fig. 1 |. Nuclear and chromatin alterations accompany phenotypic changes induced by ECM stiffness.
a, The hypothesis underlying this study is that ECM properties can stabilize normal phenotypes or make phenotypic transitions more permissive through chromatin alterations. b, Immunofluorescence staining for F-actin, vimentin, phosphorylated FAK (Y397), and β4 integrin in MCF10A acini after 14 days in soft (top) or stiff (bottom) matrices (representative images selected from 15, 3, 5, and 5 images per group respectively). c, Representative outlines of cell clusters from soft (top) and stiff (bottom) matrices. d, Quantification of roundness of cell clusters from at least three independent replicates (median ± 95% C.I.). Significance determined by Mann-Whitney test. e, Quantification of invasive clusters (n ≥ 5, mean ± S.D.) Significance determined by unpaired t-test. f, Color map of nuclear curvature for cells in soft (top) and stiff (bottom) matrices. Scale bar represents 2 μm and color bar ranges from −20 to 20 μm−1. g, Distribution of curvature values, showing more regions of extreme curvature for cells in stiff matrices. Distributions were significantly different by Kolmogorov-Smirnov test (p < 0.0001, n ≥ 11). h, TEM micrographs of nuclei from cells in soft or stiff matrices at 2,000X (left) and 10,000X (right) magnification (representative images from at least 16 images per group). i, Distribution of measured chromatin thickness at each pixel around nuclear boundary for at least six nuclei in each group. Distributions were significantly different by Kolmogorov-Smirnov test (p < 0.0001). j, Western blot quantification of histone modifications normalized to total H3 levels (mean ± S.D.). Three independent replicates were used and significance was tested using unpaired t-tests.
Fig. 2 |
Fig. 2 |. Chromatin accessibility changes are associated with normal and tumorigenic phenotypes.
a, Heatmap of 1658 regions with differential accessibility. Each row represents a differential region, each column is one of three biological replicates of soft or stiff conditions. b, Representative genome browser tracks of significantly differentially accessible regions (highlighted). c, Quantification of roundness for small molecule inhibitors of histone modifiers. Three independent replicates were used for each condition, significance was determined by Kruskal-Wallis test followed by Dunn’s multiple testing correction (median ± 95% C.I.). d, Confocal immunofluorescence images of clusters in control matrices and treated with SAHA (top, from at least 22 images per group) and representative outlines of clusters (bottom). e, Quantification of invasive clusters (n = 3, mean ± S.D.). Significance determined by one-way ANOVA followed by Dunnett’s multiple testing correction. f, Heatmap of 1658 differentially accessible regions between soft and stiff control matrices with signal for SAHA-treated cells in stiff matrices. Green box represents regions that are more accessible in stiff control and less accessible after SAHA treatment. g, Representative genome browser tracks of regions that are more accessible in stiff control matrices than soft control matrices and are less accessible upon SAHA-treatment (differential region highlighted).
Fig. 3 |
Fig. 3 |. Sp1 mediates the stiffness-induced tumorigenic phenotype.
a, MEME-ChIP de novo motif analysis for differentially accessible regions between soft and stiff matrices. b, MEME-ChIP de novo motif analysis for regions of decreased accessibility in SAHA-treated cells in stiff matrices c, Sp1 motif logo (top) best matches the top ranked MEME-ChIP de novo motifs from soft vs. stiff comparison (middle) and from regions of decreased accessibility in SAHA-treated cells in stiff matrices. d, Transcription factor footprint of 200 bp region centered on Sp1 motifs in differentially accessible regions. Cartoon illustrating an accessible chromatin region displaying the Sp1 motif in stiff ECM that is inaccessible to Sp1 in soft ECM. e, Quantification of Sp1 phosphorylation levels at Thr453 for cells in stiff matrices and treated with PI3K inhibitor (LY294002) or class I HDAC (SAHA). All values are normalized by the value for soft matrices of the same treatment condition (mean ± S.D.). Significance was determined by one-way ANOVA followed by Dunnett’s multiple comparison correction. f, Heatmap of gene expression for Sp1 target genes associated with malignant neoplasm of breast (n = 3, two-way ANOVA with multiple comparison correction, FDR = 0.05, color scale represents log2 fold change, dot pattern indicates no significance, black box represents no data). g, Heatmap of gene expression for Sp1 target genes associated with malignant neoplasm of breast for stiff matrices with indicated inhibitors compared to vehicle control (n = 3, two-way ANOVA with multiple comparison correction, FDR = 0.05, color scale represents log2 fold change, dot pattern indicates no significance). h, Confocal immunofluorescence of Sp1-knockdown cells in stiff matrices (left, from 38 total images) and representative outlines of shSp1 clusters. i, Quantification of roundness for shSp1 clusters in stiff matrices vs. empty vector controls in soft and stiff matrices (n = 3, median ± 95% C.I.). j, Quantification of invasive clusters (n = 3, mean ± S.D.). k, Schematic timeline of small molecule inhibitor of Sp1 washout experiment. l, Quantification of roundness of cell clusters in soft or stiff matrices treated with mithramycin A or vehicle control for the indicated period of time (n = 3, median ± 95% C.I.). m, Quantification of invasive clusters (n = 3, mean ± S.D.). n, Confocal immunofluorescence of cells in soft or stiff matrices treated for the duration indicated and imaged after 14 total days (representative images from 15 images per group). Significance was determined by Kruskal-Wallis test followed by Dunn’s multiple testing correction for roundness and by one-way ANOVA followed by Dunnett’s multiple testing correction for invasion.
Fig. 4 |
Fig. 4 |. HDACs 3 and 8 regulate the stiffness-induced tumorigenic phenotype.
a, String-DB protein-protein interaction network of top ten interactors with Sp1. b, Confocal immunofluorescence of shHDAC1, shHDAC2, shHDAC3, and shHDAC8 cells in stiff matrices (top, from at least 12 total images per group) and representative outlines of clusters (bottom). Scale bars represent 100 μm. c, Quantification of roundness for HDAC knockdowns in stiff matrices compared to empty vector controls in soft or stiff matrices and SAHA-treated cells in stiff matrices (n = 3, median ± 95% C.I.). d, Quantification of invasive clusters (n = 3, mean ± S.D.). e, Schematic timeline of small molecule inhibitor of Sp1 washout experiment. f, Confocal immunofluorescence of cells in soft or stiff matrices treated for the duration indicated and imaged after 14 total days (representative images from 15 images per group). g, Quantification of roundness of cell clusters in soft or stiff matrices treated with SAHA or vehicle control for the indicated period of time (n = 3, median ± 95% C.I.). h, Quantification of invasive clusters (n = 3, mean ± S.D.). i, Schematic illustrating sequential events from ECM mechanical properties to phenotype via mechanically-induced chromatin remodeling. Significance was determined by Kruskal-Wallis test followed by Dunn’s multiple testing correction for roundness and by one-way ANOVA followed by Dunnett’s multiple testing correction for invasion.
Fig 5 |
Fig 5 |. Soft hydrogel culture produces more physiologically representative chromatin accessibility profiles than standard tissue culture.
a, Representative morphologies of MCF10A cells cultured on tissue culture polystyrene (TCPS, left), on soft 2D matrices, in soft 3D matrices, and from human mammary tissue (image credit: Human Protein Atlas). Scale bars represent 25 μm. b, Heatmap of significantly differentially accessible regions between the different culture conditions and mammary epithelium, demonstrating the similarity in accessibility with cultures from soft matrices. Each row represents a differential region, each column is one biological replicates of the indicated condition. c, Principal components analysis reveals that accessible regions in soft matrices cluster closer to mammary epithelium than 2D TCPS along the first PC that accounts for 72% of variance. Three biological replicates were used for 2D TCPS, 2D soft and 3D soft, and two were used for in vivo mammary epithelium.

Comment in

  • Facing up to a hard truth.
    Danovi S. Danovi S. Nat Rev Cancer. 2019 Oct;19(10):542-543. doi: 10.1038/s41568-019-0195-8. Nat Rev Cancer. 2019. PMID: 31409914 No abstract available.

References

    1. Levental KR et al. Matrix crosslinking forces tumor progression by enhancing integrin signaling. Cell 139, 891–906 (2009). - PMC - PubMed
    1. Provenzano PP, Inman DR, Eliceiri KW & Keely PJ Matrix density-induced mechanoregulation of breast cell phenotype, signaling and gene expression through a FAK-ERK linkage. Oncogene 28, 4326–4343 (2009). - PMC - PubMed
    1. Choquet D, Felsenfeld DP & Sheetz MP Extracellular matrix rigidity causes strengthening of integrin-cytoskeleton linkages. Cell 88, 39–48 (1997). - PubMed
    1. Paszek MJ et al. Tensional homeostasis and the malignant phenotype. Cancer Cell 8, 241–254 (2005). - PubMed
    1. del Rio A et al. Stretching single talin rod molecules activates vinculin binding. Science 323 (2009). - PMC - PubMed

Publication types