. 2019 Aug;22(8):1371-1378.
doi: 10.1038/s41593-019-0436-x. Epub 2019 Jul 8.

Functional boundaries in the human cerebellum revealed by a multi-domain task battery

Affiliations

Functional boundaries in the human cerebellum revealed by a multi-domain task battery

Maedbh King et al. Nat Neurosci. 2019 Aug.

Abstract

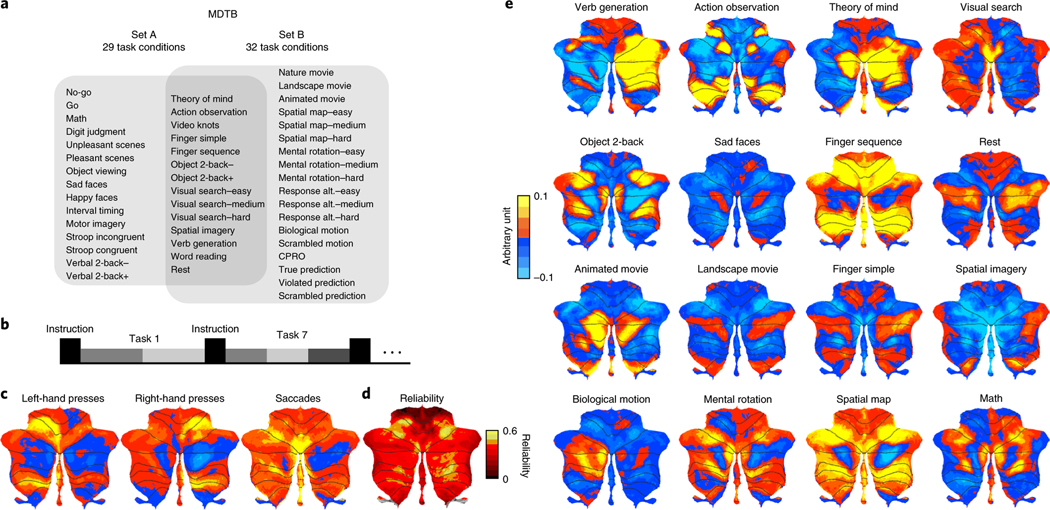
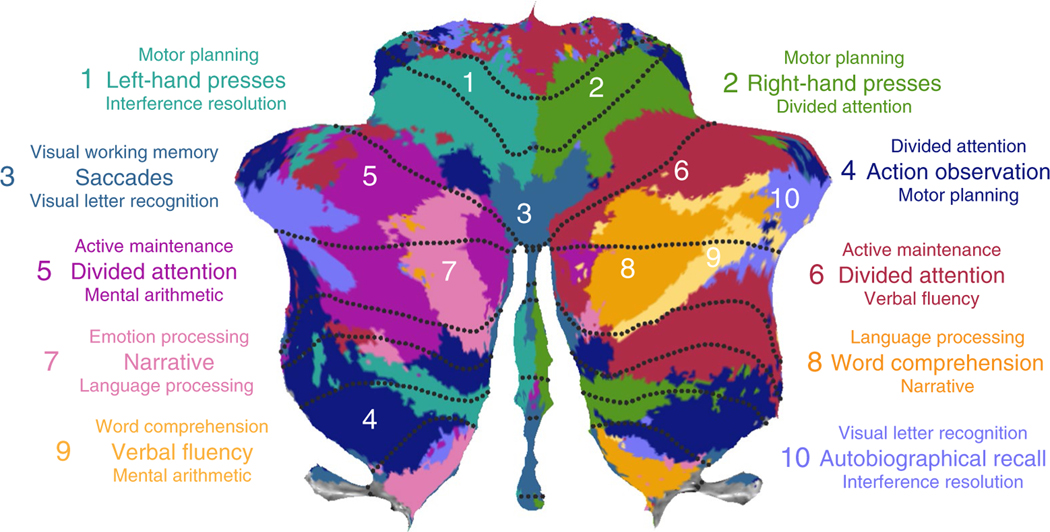
There is compelling evidence that the human cerebellum is engaged in a wide array of motor and cognitive tasks. A fundamental question centers on whether the cerebellum is organized into distinct functional subregions. To address this question, we employed a rich task battery designed to tap into a broad range of cognitive processes. During four functional MRI sessions, participants performed a battery of 26 diverse tasks comprising 47 unique conditions. Using the data from this multi-domain task battery, we derived a comprehensive functional parcellation of the cerebellar cortex and evaluated it by predicting functional boundaries in a novel set of tasks. The new parcellation successfully identified distinct functional subregions, providing significant improvements over existing parcellations derived from task-free data. Lobular boundaries, commonly used to summarize functional data, did not coincide with functional subdivisions. The new parcellation provides a functional atlas to guide future neuroimaging studies.


Figures

Fig. 1 |
Fig. 1 |. MDtB.
a, Experimental design. A total of four fMRI scanning sessions were collected on the same set of participants using two tasks sets. Each set consisted of 17 tasks, with 8 tasks in common. The tasks were modeled as 29 task conditions in set A and as 32 in set B, with 14 task conditions common across both task sets. b, Timing of each task: 5 s instruction period followed by 30 s of task execution. Tasks consisted of a different number of task conditions (gray bars, range 1–3). c, Unthresholded, group-averaged motor feature maps, displayed on a surface-based representation of the cerebellar cortex. d, Across-session reliability of activation patterns for each voxel. e, Group-averaged activation maps for selected tasks, corrected for motor features. The red-to-yellow colors indicate increases and the blue colors denote decreases in activation, relative to the mean activation across all conditions. Activity is normalized by the root-mean-square error of the time series fit for each voxel. CPRO, concrete permuted rules operations.
Fig. 2 |
Fig. 2 |. DCBC.
a, Correlations between all pairs of voxels with the same distance were calculated and averaged depending on whether they were ‘within’ or ‘between’ regions. Voxel pairs were then binned according to spatial distance in the volume (4–35 mm in steps of 5 mm). b, Average cross-validated correlation (see Methods) as a function of spatial distance for lobular boundaries. The DCBC is defined as the difference in correlation (within-between) within each distance bin. The error bars show between-participant s.e.m. for n = 24 participants. c, Strength of the boundaries for lobular parcellation, with the thickness of the black lines indicating the DCBC value.
Fig. 3 |
Fig. 3 |. MDtB parcellation reveals functional boundaries in the cerebellar cortex.
a, Average cross-validated correlations (see Methods) for ‘within’ (red) and ‘between’ (black) voxel pairs for MDTB parcellation (10 regions). The solid lines indicate the values for the cross-validated estimates; the dashed lines are the estimates for the full parcellation. b, Ten-region MDTB parcellation. The DCBC for each boundary is visualized by the thickness of the black lines. c, Proportion of samples in the bootstrapped analysis (participants) where the voxel was assigned to the same compartment as in the original parcellation. Most voxels had a consistency of assignment >0.6. d, Visualization of boundary uncertainty, using the color scheme in b, but adjusted so that the degree of transparency is indicative of the uncertainty of the assignment. Voxels that were assigned to a single compartment on less than 50% of the cases are shown in gray. e, DCBC as a function of the spatial distance for the lower bound of the three MDTB parcellations (colored lines) and lobular parcellation (black line). f, Within-subject (black) and between-subject (red) reliability of activation patterns overall and across different spatial frequencies. g, DCBC as a function of voxel distance for the ten-region group parcellation (red) and the average of the ten-region individual parcellations (black). Only the cross-validated estimates of the prediction performance for novel tasks are shown. In all panels, the error bars show the between-participant s.e.m. for n = 24 participants.
Fig. 4 |
Fig. 4 |. Comparison of MDtB and task-free parcellations of the cerebellum.
ac, Cerebellar parcellations based on task-free data with 7, 10 and 17 regions. Thickness of the black lines indicates the DCBC for the corresponding boundary. d, DCBC for different spatial distances for lobular (black), task-free (dark and light blue) and MDTB (green) parcellations. MDTB parcellation was evaluated in a cross-validated fashion (see text). e, Evaluation of the same parcellations on task-based data from 186 HCP participants. f, Matrix of adjusted Rand coefficients between three versions of the MDTB parcellations (7, 10, 17) and the three task-free parcellations (7, 10, 17). g, Correspondence between MDTB and task-free parcellations. A value of 1 (yellow-green) indicates that the adjusted Rand coefficient between task-free and MDTB parcellations is the same size as the adjusted Rand coefficient between MDTB parcellations. Lower values (blue-green) indicate weaker agreement between task-free and MDTB parcellations compared to MDTB on its own. h, Evaluation of MDTB parcellation (derived only from set A) and the task-free parcellations on the three movie tasks from set B. d,e,h, The error bars show the between-participant s.e.m. for n = 24 or n = 186 (e) participants.
Fig. 5 |
Fig. 5 |. Cognitive descriptors for the ten functional regions in the MDtB parcellation.
The three features that best characterize each region are listed. The font size indicates the strength of these feature weights.

Similar articles

Cited by

References

    1. Ivry RB. & Baldo JV Is the cerebellum involved in learning and cognition? Curr. Opin. Neurobiol. 2, 212–216 (1992). - PubMed
    1. Kelly RM & Strick PL Cerebellar loops with motor cortex and prefrontal cortex of a nonhuman primate. J. Neurosci. 23, 8432–8444 (2003). - PMC - PubMed
    1. Allen G, Buxton RB, Wong EC & Courchesne E. Attentional activation of the cerebellum independent of motor involvement. Science 275, 1940–1943 (1997). - PubMed
    1. Larsell O. The development of the cerebellum in man in relation to its comparative anatomy. J. Comp. Neurol. 87, 85–129 (1947). - PubMed
    1. Buckner RL, Krienen FM, Castellanos A, Diaz JC & Yeo BTT The organization of the human cerebellum estimated by intrinsic functional connectivity. J. Neurophysiol. 106, 2322–2345 (2011). - PMC - PubMed

Publication types