. 2019 Apr 4;45(4):76-80.
doi: 10.14745/ccdr.v45i04a01.

Climate change and infectious diseases: What can we expect?

Affiliations

Climate change and infectious diseases: What can we expect?

N H Ogden et al. Can Commun Dis Rep. .

Abstract

Global climate change, driven by anthropogenic greenhouse gas emissions, is being particularly felt in Canada, with warming generally greater than in the rest of the world. Continued warming will be accompanied by changes in precipitation, which will vary across the country and seasons, and by increasing climate variability and extreme weather events. Climate change will likely drive the emergence of infectious diseases in Canada by northward spread from the United States and introduction from elsewhere in the world via air and sea transport. Diseases endemic to Canada are also likely to re-emerge. This special issue describes key infectious disease risks associated with climate change. These include emergence of tick-borne diseases in addition to Lyme disease, the possible introduction of exotic mosquito-borne diseases such as malaria and dengue, more epidemics of Canada-endemic vector-borne diseases such as West Nile virus, and increased incidence of foodborne illnesses. Risk is likely to be compounded by an aging population affected by chronic diseases, which results in greater sensitivity to infectious diseases. Identifying emerging disease risks is essential to assess our vulnerability, and a starting point to identify where public health effort is required to reduce the vulnerability and exposure of the Canadian population.

Keywords: Lyme disease; chronic disease; climate change; foodborne; mosquito-borne diseases; precipitation; temperature; vector-borne disease.


Conflict of interest statement

Conflict of interest: None.

Figures
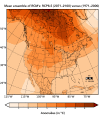
Figure 1
Figure 1. Projected increases in a) mean annual temperature (in °C) and b) annual total precipitation amount (in %) from 2071–2100 compared with 1971–2000
Abbreviations: RCM, regional climate model; RCP, regional concentration pathway Note: Simulated by nine regional climate models (RCMs) and the available datasets from the North America CORDEX (COordinated Regional climate Downscaling EXperiment) project (11). All simulations use the representative concentration pathway (RCP) 8.5 greenhouse gas emission scenario (12) with a spatial resolution of 0.44 ° around 50 km. Shaded areas correspond to regions where 60% of the models are in agreement in the direction of change and have a magnitude of change higher than the standard deviation of data from the reference period (1971–2000)
Figure 2
Figure 2. Observed and projected annual changes in daily mean temperature over northeastern Canadaa: 1948–2100 compared with 1971–2000
Abbreviations: RCM, regional climate model; RCP, representative concentration pathway a Northeastern Canada is defined as land areas north of 60°N and east of 110°W Note: Annual changes in daily mean temperature are noted in bar graphs for reference data and line graphs for projected changes. Projected changes were obtained from the same model simulations as used in Figure 1, and using two emissions scenarios of RCP4.5 (blue line) and RCP8.5 (red line), the latter being more realistic at the current time. Shading around the blue and red lines (median of all simulations) illustrates the range of increases in temperatures projected by the different regional climate models. The box-and-whisker plots to the right show the median and ranges of increases in temperatures for the reference period (i.e. observed data), and for the period 2071–2100 (i.e. model projections) under the two different RCPs (12)
Figure 3
Figure 3. A summary of climate change effects on infectious disease risks for Canadaa
a Modified (23)

References

    1. Bouchard C, Dibernardo A, Koffi J, Wood H, Leighton PA, Lindsay LR. Increased risk of tick-borne diseases with climate and environmental changes. Can Commun Dis Rep 2019;45(4):81–9. - PMC - PubMed
    1. Ludwig A, Zheng H, Vrbova L, Drebot MA, Iranpour M, Lindsay LR. Increased risk of endemic mosquito-borne diseases in Canada due to climate change. Can Commun Dis Rep 2019;45(4):90–7. - PMC - PubMed
    1. Ng V, Rees EE, Lindsay RL, Drebot MA, Brownstone T, Sadeghieh T, Khan SU. Could exotic mosquito-borne diseases emerge in Canada with climate change? Can Commun Dis Rep 2019;45(4):98–107. 10.14745/ccdr.v45i04a04 - DOI - PMC - PubMed
    1. Smith BA, Fazil A. How will climate change impact microbial foodborne disease in Canada? Can Commun Dis Rep 2019;45(4):108–13. 10.14745/ccdr.v45i04a05 - DOI - PMC - PubMed
    1. National Centers for Environmental information. Climate at a glance: global time series. Asheville (NC): NOAA; 2018 Sep. https://www.ncdc.noaa.gov/cag/global/time-series