. 2019 Jun 12:2019:6981268.
doi: 10.1155/2019/6981268. eCollection 2019.

Early Electrophysiological Disintegration of Hippocampal Neural Networks in a Novel Locus Coeruleus Tau-Seeding Mouse Model of Alzheimer's Disease

Affiliations

Early Electrophysiological Disintegration of Hippocampal Neural Networks in a Novel Locus Coeruleus Tau-Seeding Mouse Model of Alzheimer's Disease

A Ahnaou et al. Neural Plast. .

Abstract

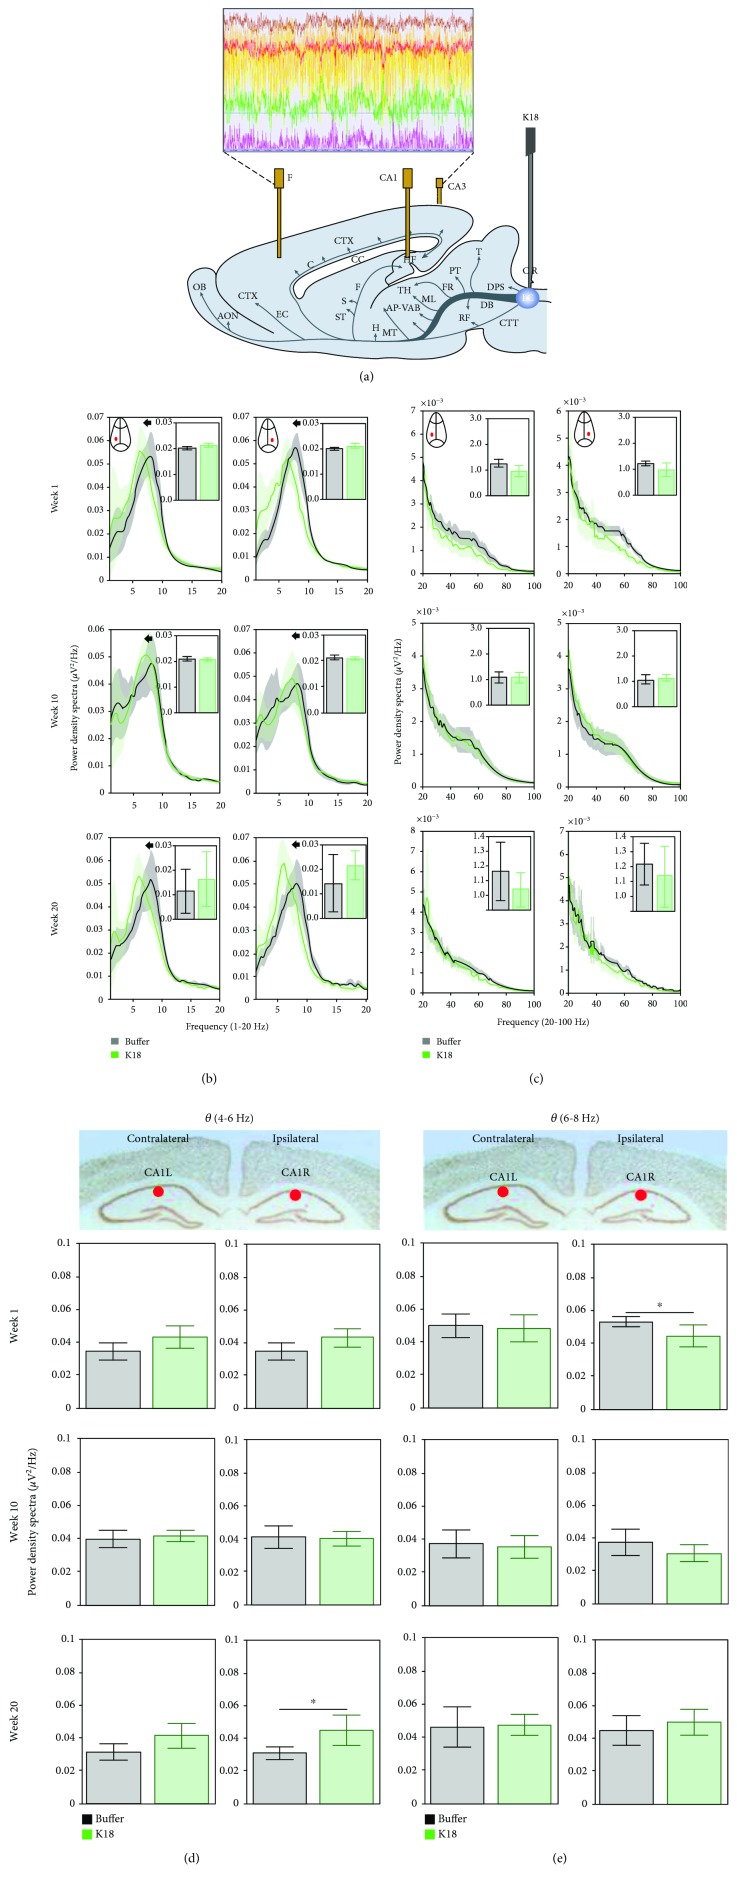
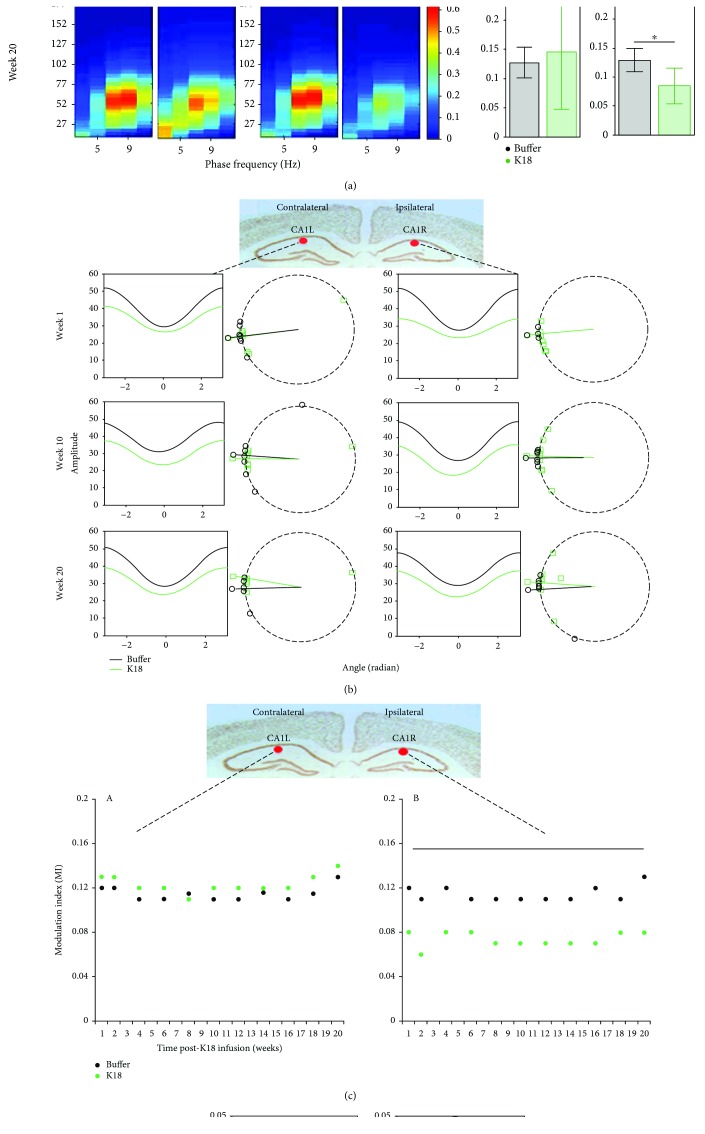
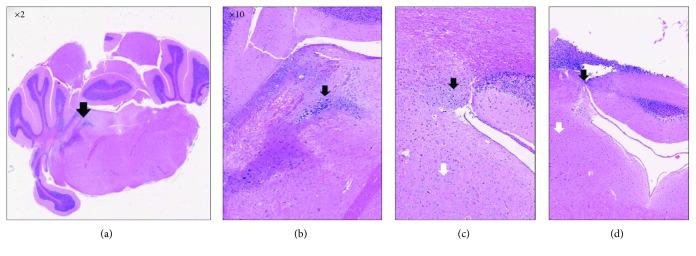
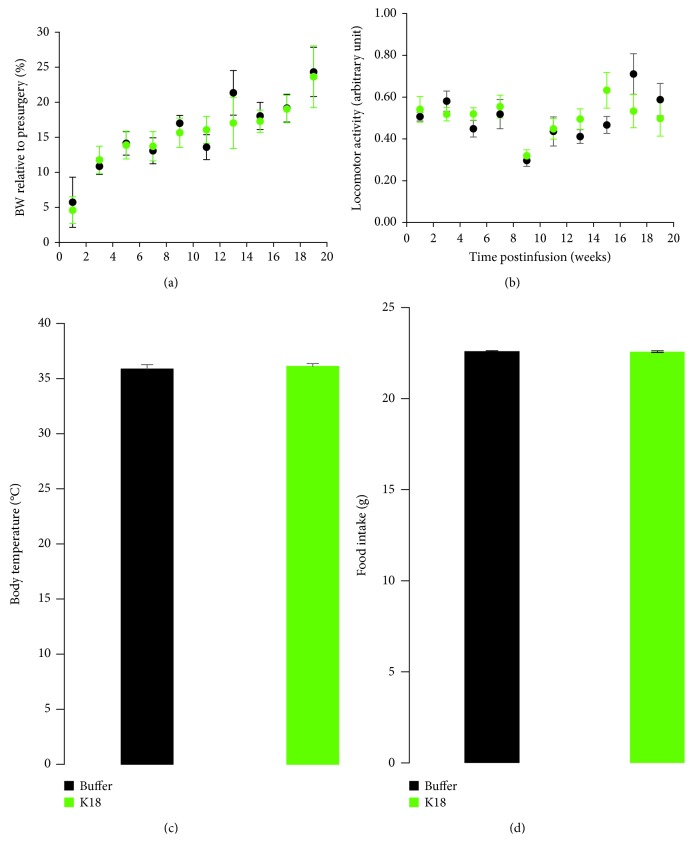
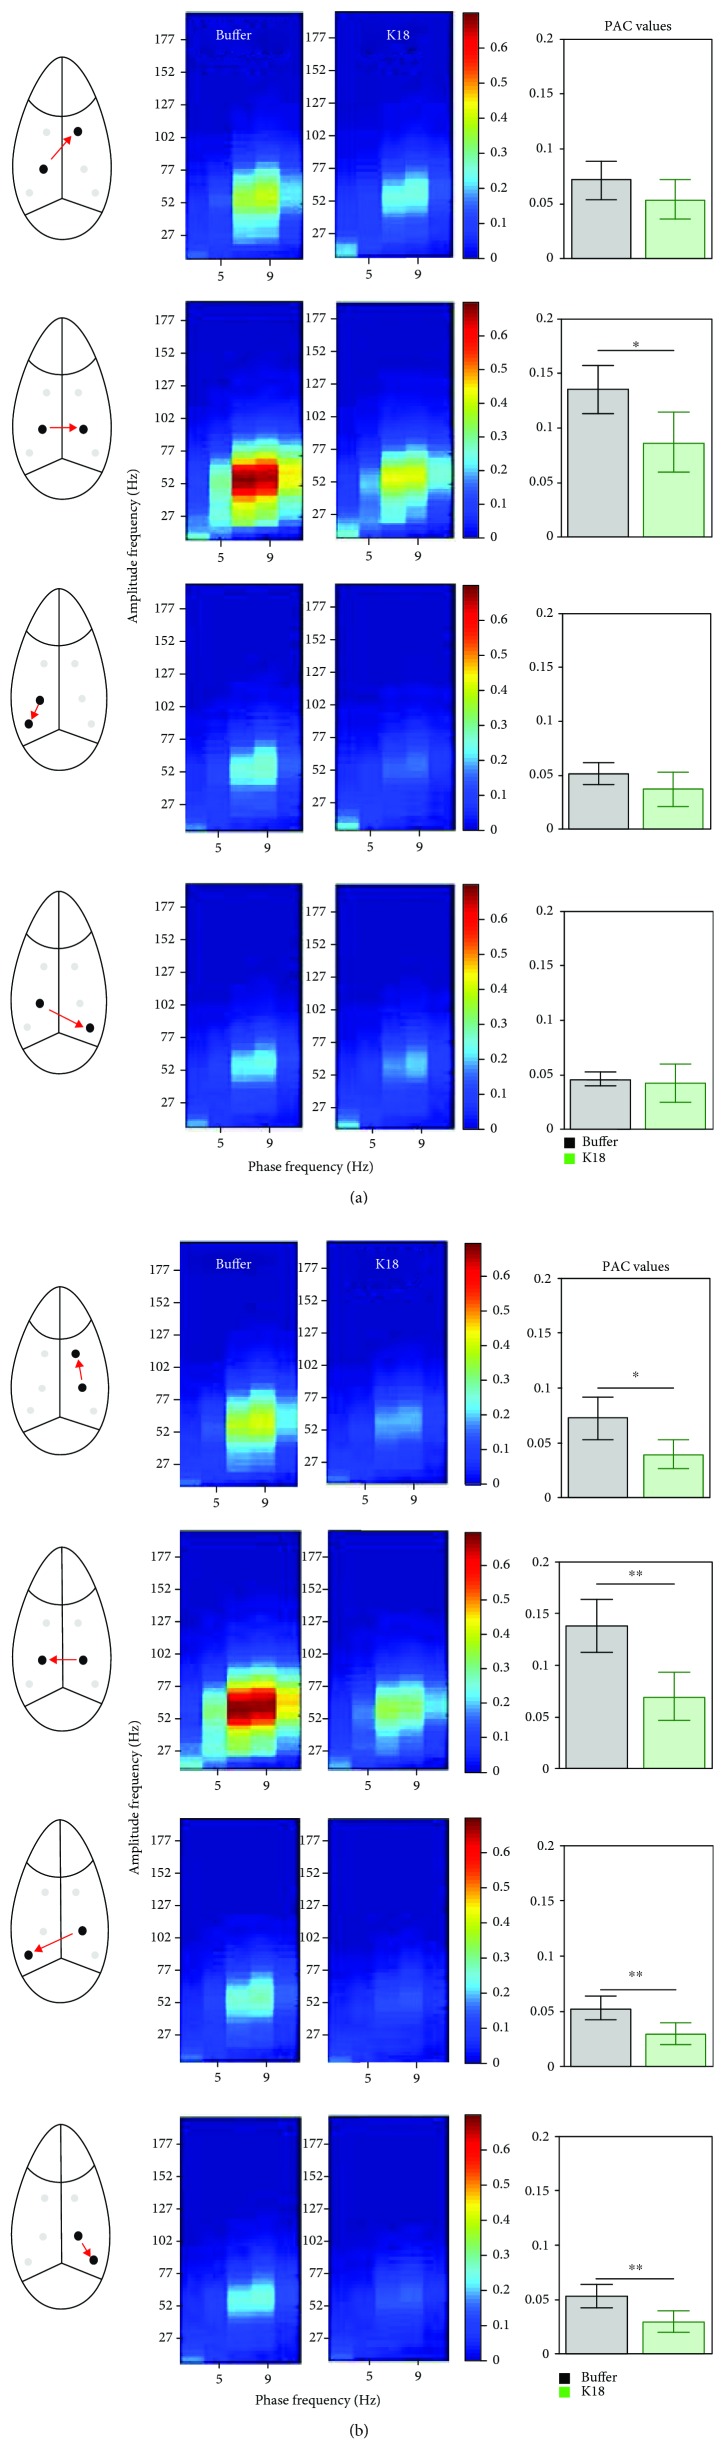
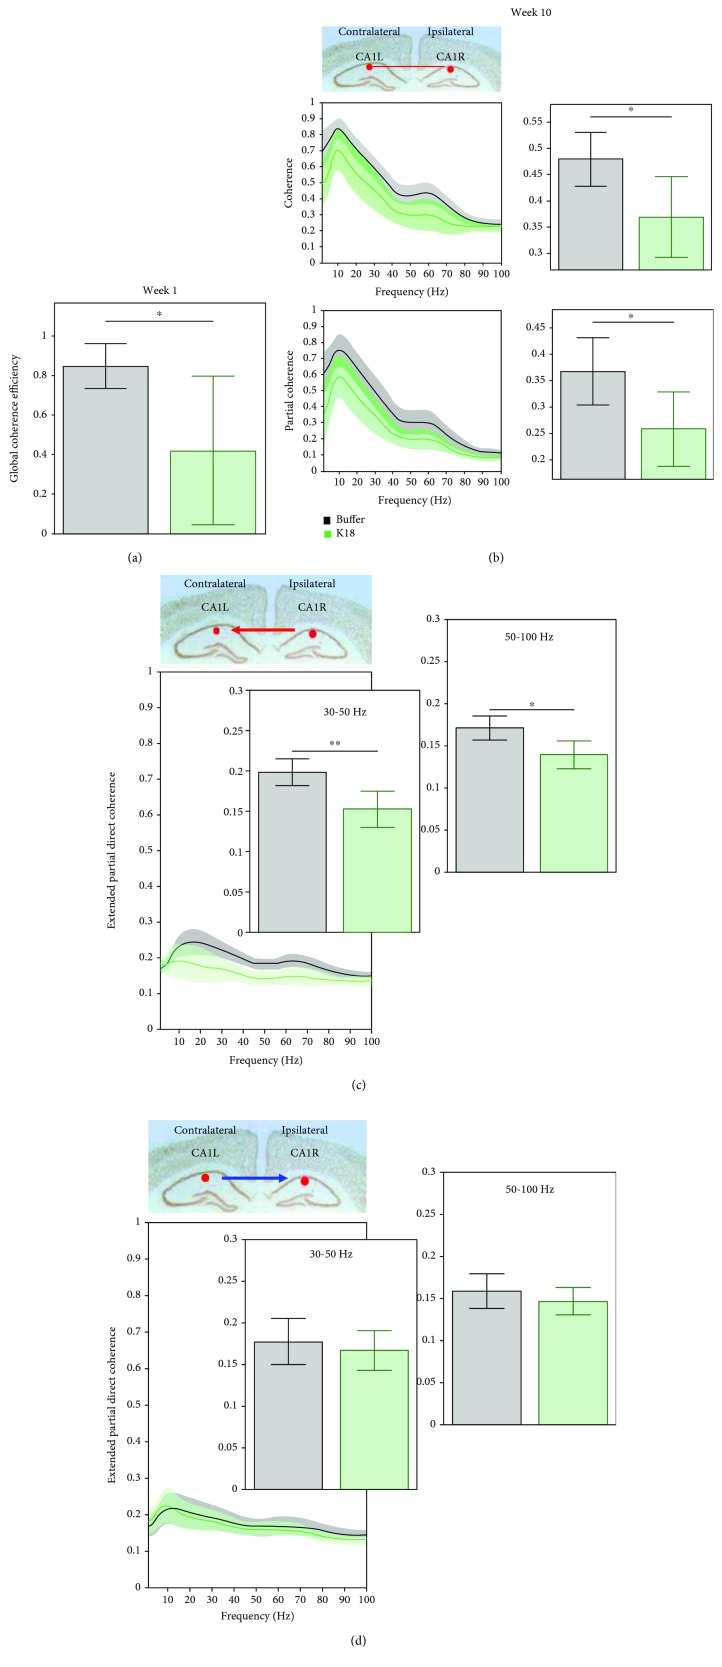
Alzheimer's disease (AD) is a progressive, neurodegenerative disease characterized by loss of synapses and disrupted functional connectivity (FC) across different brain regions. Early in AD progression, tau pathology is found in the locus coeruleus (LC) prior to amyloid-induced exacerbation of clinical symptoms. Here, a tau-seeding model in which preformed synthetic tau fibrils (K18) were unilaterally injected into the LC of P301L mice, equipped with multichannel electrodes for recording EEG in frontal cortical and CA1-CA3 hippocampal areas, was used to longitudinally quantify over 20 weeks of functional network dynamics in (1) power spectra; (2) FC using intra- and intersite phase-amplitude theta-gamma coupling (PAC); (3) coherence, partial coherence, and global coherent network efficiency (Eglob) estimates; and (4) the directionality of functional connectivity using extended partial direct coherence (PDC). A sustained leftward shift in the theta peak frequency was found early in the power spectra of hippocampal CA1 networks ipsilateral to the injection site. Strikingly, hippocampal CA1 coherence and Eglob measures were impaired in K18-treated animals. Estimation of instantaneous EEG amplitudes revealed deficiency in the propagation directionality of gamma oscillations in the CA1 circuit. Impaired PAC strength evidenced by decreased modulation of the theta frequency phase on gamma frequency amplitude further confirms impairments of the neural CA1 network. The present results demonstrate early dysfunctional hippocampal networks, despite no spreading tau pathology to the hippocampus and frontal cortex. The ability of the K18 seed in the brainstem LC to elicit such robust functional alterations in distant hippocampal structures in the absence of pathology challenges the classic view that tau pathology spread to an area is necessary to elicit functional impairments in that area.


Figures

Figure 1
Figure 1
(a) Scheme showing the placement of recording electrodes and a cannula for injection of K18 in the locus coeruleus. (b, c) Relative power spectra in frequency (1-20 Hz (b) and 20-100 Hz (c)) for the CA1R and CA1L electrodes for buffer- (black, n = 7) and K18- (green, n = 8) injected mice, at recording weeks 1, 10, and 20. Insets indicate total relative power with no significance between group differences (two-sample t-test) at 1-20 Hz and 20-100 Hz in b1 and b2, respectively. (d, e) Relative power spectra in CA1R and CA1L in low (4-6 Hz (d)) and high (6-8 Hz (e)) theta oscillations at recording weeks 1, 10, and 20. Data are presented as mean (across animals) values (and 95% CI). Horizontal lines above bar plots with asterisks indicate the presence of significant difference between buffer- and K18-injected animals (two-sample t-test; p value < 0.05).
Figure 2
Figure 2
(a) Heat maps showing the mean phase-amplitude coupling (PAC) modulation index at the CA1L and CA1R electrodes for buffer- (black, n = 7) and K18- (green, n = 8) injected mice, at recording weeks 1, 10, and 20. As shown by the color scale, “hotter” colors indicate high coupling values while “colder” colors indicate low or no coupling. Bar graphs showing the mean (across animals) theta-gamma PAC (with 95% CI) at the CA1L and CA1R electrodes for buffer- (black, n = 7) and K18- (green, n = 8) injected mice, at recording weeks 1, 10, and 20. These means along animals' PAC values are calculated as the average PAC for the window of phase frequency: 3.5–12.5 Hz, and amplitude frequency: 32–100 Hz, to focus on theta-gamma PAC. Horizontal lines above the bar plots with asterisks indicate the presence of significant difference between buffer- and K18-injected animals (two-sample t-test; p value < 0.05 and ∗∗p value < 0.01). (b) Averaged across animals' variations in gamma amplitude (vertical axes) as a function of theta phases (horizontal axes) obtained from the electrodes implanted in CA1L and CA1R for the weeks 1, 10, and 20 postadministration of the buffer and K18. Right plots show estimated phase shifts in obtained oscillations for each animal (shown as dots) and condition (buffer (black) and K18 (green) injected). Radii show circular mean values for buffer- and K18-injected groups of animals. No significant difference in means between groups across all time points was found with the Watson-Williams test. (c) Scatter graphs show mean theta-gamma PAC at the contralateral (CA1L) and ipsilateral (CA1R) CA1 regions of the K18 injection site, for all recording weeks, demonstrating changes in PAC over time, for the buffer-injected (black) and K18-injected (green) groups. Time intervals with significant differences (p < 0.05, two-sample t-test) between buffer-injected and K18-injected animals are shown by a horizontal line. (d) Bar charts quantifying the mean PAC in frontal electrodes for buffer- (black) and K18- (green) injected animals. Note that no significant difference (two-sample t-test) was observed between the study groups. Data are presented as mean values (with 95% CI).
Figure 3
Figure 3
The image in (a) is an image from the mouse brain atlas depicted with black arrows in the LC region from a sagittal view. Areas of interest: microscopic images of coronal views of the neurons of the LC (a, b) and the Purkinje/molecular layer neurons around the LC (c, d).
Figure 4
Figure 4
Mean locomotor activity, body weight, body temperature, and food intake in buffer- (black, n = 7) and K18- (green, n = 8) injected mice. (a) Body weight relative to presurgery and (b) locomotor activity were monitored daily prior and during EEG recording sessions, respectively. (c) Body temperature was measured in the middle of the study, and (d) food intake was measured daily during the first week postinfusion of K18 and buffer in the LC area. No changes in the mean activity levels, body weight, body temperature, and food intake were observed between the study groups. Data are expressed as mean ± sem.
Figure 5
Figure 5
Heat maps showing the mean phase-amplitude coupling (PAC) between contralateral CA1L and ipsilateral CA1R electrodes for buffer- (left heat maps in each frame) and K18- (right heat maps in each frame) injected animals at recording week 1 (buffer n = 7, K18 n = 8). (a) CA1L > CA1R represents the strength of PAC between theta oscillations (phase) from CA1L and gamma oscillations (amplitude) at CA1R, while (b) CA1R > CA1L represents the strength of PAC between theta oscillations from CA1R and gamma oscillations at CA1L. Bar charts quantifying the mean PAC between the stated electrodes (shown with 95% CI) for buffer- (black) and K18- (green) injected animals. These mean PAC values are calculated as the average PAC for the window of phase frequency: 3.5–11 Hz, and amplitude frequency: 32–100 Hz, to focus on theta-gamma PAC. Horizontal lines above the bar plots with asterisks indicate the presence of significant difference between buffer- and K18-injected animals (two-sample t-test; p value < 0.05 and ∗∗p value < 0.01).
Figure 6
Figure 6
(a) Graphs showing the mean (across animals) global coherence efficiency (with 95% CI) for buffer-injected (black) and K18-injected (green) mice, at week 1 (buffer n = 7, K18 n = 8). Horizontal lines above bar plots with asterisks indicate the presence of significant difference between buffer- and K18-injected animals (two-sample t-test: p value < 0.05). (b) The top line graph shows the mean (across animals) coherence values (with 95% CI) between CA1L and CA1R electrodes for buffer-injected (black) and K18-injected (green) mice, at week 10 for the frequency range 0-100 Hz. On the right-hand side, bar charts show the mean (across animals) coherence (with 95% CI) for both groups for the frequency range of interest. Bottom line graphs show the mean (across animals) partial coherence values (with 95% CI) between the same electrodes. On the right-hand side, bar charts show the mean partial coherence (with 95% CI) for both groups for the same frequency range, 0-100 Hz. Horizontal lines above bar plots with asterisks indicate the presence of significant difference between buffer- and K18-injected animals (two-sample t-test; p value < 0.05). (c) Graphs showing the mean (across animals) extended partial directed coherence (with 95% CI) from CA1R to CA1L and (d) CA1L to CA1R for buffer-injected (black) and K18-injected (green) mice, at recording week 10. On the left-hand side, these data are presented in the form of a line graph, showing mean (across animal) extended partial directed coherence as a function of frequency (with 95% CI) for both groups for the frequency range 0-100 Hz. On the right-hand side, bar charts show the mean (across animals) extended partial directed coherence (with 95% CI) for both groups for frequency ranges 30-50 and 50-100 Hz. Horizontal lines above the bar plots with asterisks indicate the presence of significant difference between buffer- and K18-injected animals (two-sample t-test; p value < 0.05 and ∗∗p value < 0.01).

References

    1. Prince M., Wimo A., Guerchet M., Gemma-Claire A., Wu Y. T., Prina M. The global impact of dementia - an analysis of prevalence, incidence, cost and trends. Alzheimer’s Disease International, 2015 World Alzheimer Report. 2015;84
    1. Alzheimer’s Association. 2015 Alzheimer’s disease facts and figures. Alzheimer's & Dementia. 2015;11(3):332–384. doi: 10.1016/j.jalz.2015.02.003. - DOI - PubMed
    1. Bickel H. Dementia in advanced age: estimating incidence and health care costs. Zeitschrift für Gerontologie und Geriatrie. 2001;34(2):108–115. doi: 10.1007/s003910170074. - DOI - PubMed
    1. Glenner G. G., Wong C. W. Alzheimer’s disease: initial report of the purification and characterization of a novel cerebrovascular amyloid protein. Biochemical and Biophysical Research Communications. 1984;120(3):885–890. doi: 10.1016/S0006-291X(84)80190-4. - DOI - PubMed
    1. Kosik K. S., Joachim C. L., Selkoe D. J. Microtubule-associated protein tau (tau) is a major antigenic component of paired helical filaments in Alzheimer disease. Proceedings of the National Academy of Sciences of the United States of America. 1986;83(11):4044–4048. doi: 10.1073/pnas.83.11.4044. - DOI - PMC - PubMed