. 2019 Jun 9;9(15):4324-4341.
doi: 10.7150/thno.32734. eCollection 2019.

Regulatory T-cells regulate neonatal heart regeneration by potentiating cardiomyocyte proliferation in a paracrine manner

Affiliations

Regulatory T-cells regulate neonatal heart regeneration by potentiating cardiomyocyte proliferation in a paracrine manner

Jiatao Li et al. Theranostics. .

Abstract

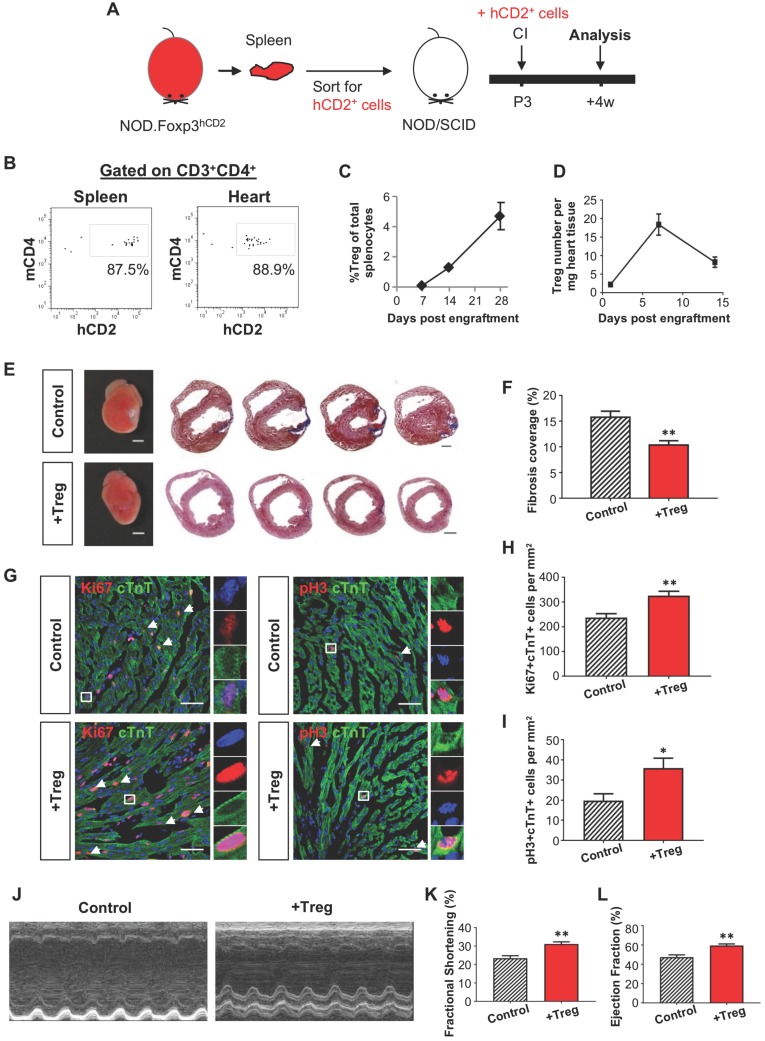
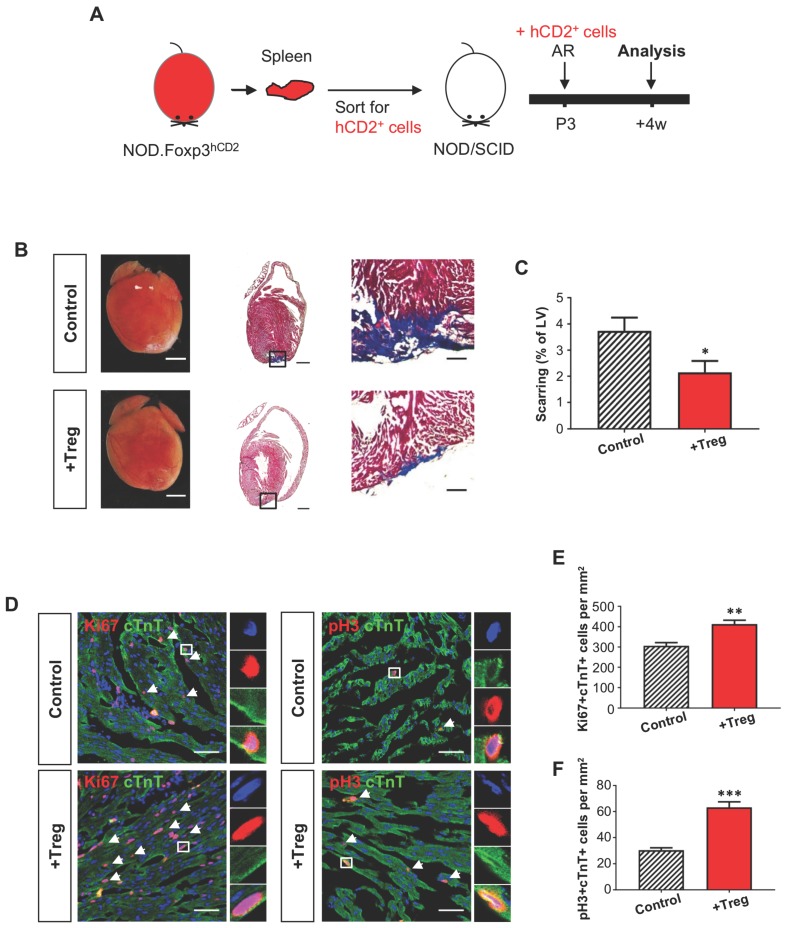
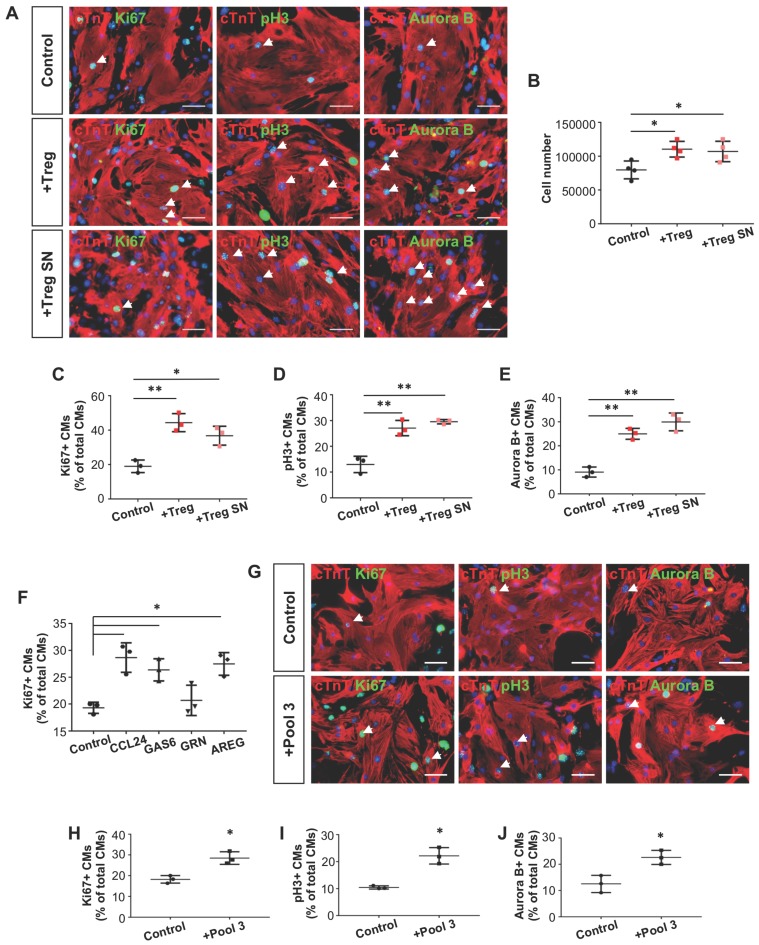
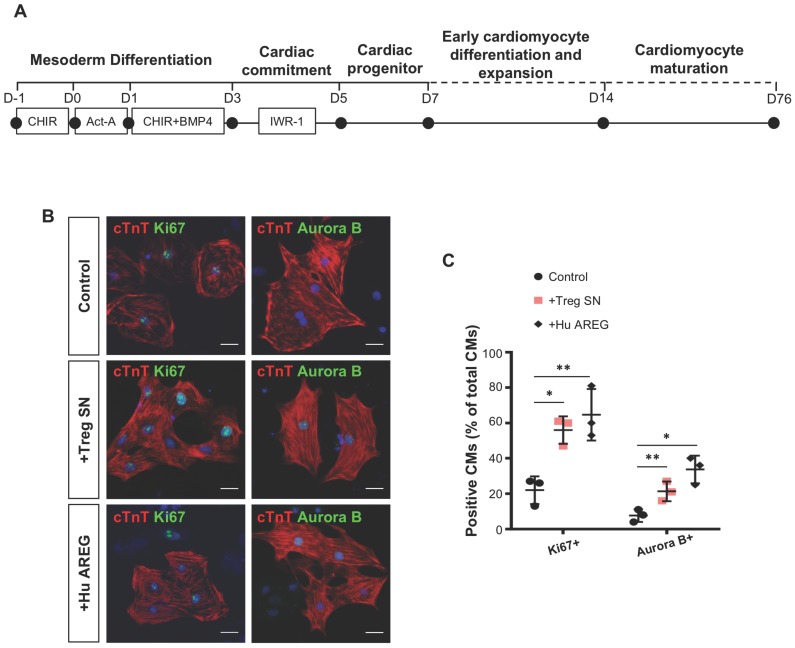
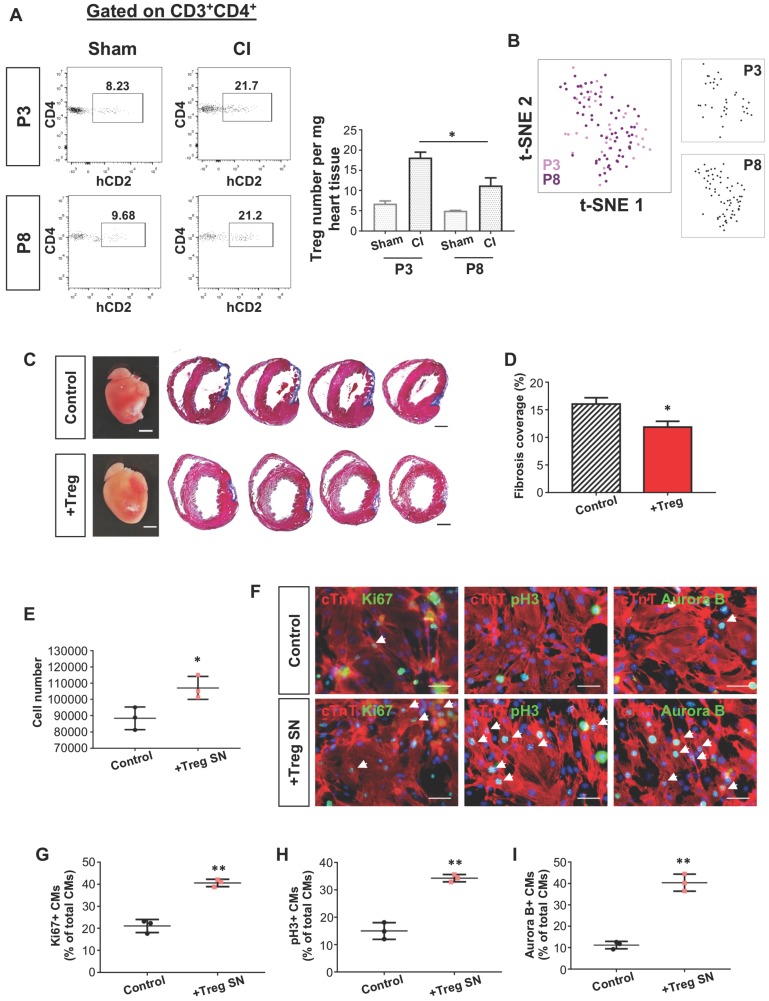
The neonatal mouse heart is capable of transiently regenerating after injury from postnatal day (P) 0-7 and macrophages are found important in this process. However, whether macrophages alone are sufficient to orchestrate this regeneration; what regulates cardiomyocyte proliferation; why cardiomyocytes do not proliferate after P7; and whether adaptive immune cells such as regulatory T-cells (Treg) influence neonatal heart regeneration have less studied. Methods: We employed both loss- and gain-of-function transgenic mouse models to study the role of Treg in neonatal heart regeneration. In loss-of-function studies, we treated mice with the lytic anti-CD25 antibody that specifically depletes Treg; or we treated FOXP3DTR with diphtheria toxin that specifically ablates Treg. In gain-of-function studies, we adoptively transferred hCD2+ Treg from NOD.Foxp3hCD2 to NOD/SCID that contain Treg as the only T-cell population. Furthermore, we performed single-cell RNA-sequencing of Treg to uncover paracrine factors essential for cardiomyocyte proliferation. Results: Unlike their wild type counterparts, NOD/SCID mice that are deficient in T-cells but harbor macrophages fail to regenerate their injured myocardium at as early as P3. During the first week of injury, Treg are recruited to the injured cardiac muscle but their depletion contributes to more severe cardiac fibrosis. On the other hand, adoptive transfer of Treg results in mitigated fibrosis and enhanced proliferation and function of the injured cardiac muscle. Mechanistically, single-cell transcriptomic profiling reveals that Treg could be a source of regenerative factors. Treg directly promote proliferation of both mouse and human cardiomyocytes in a paracrine manner; and their secreted factors such as CCL24, GAS6 or AREG potentiate neonatal cardiomyocyte proliferation. By comparing the regenerating P3 and non-regenerating P8 heart, there is a significant increase in the absolute number of intracardiac Treg but the whole transcriptomes of these Treg do not differ regardless of whether the neonatal heart regenerates. Furthermore, even adult Treg, given sufficient quantity, possess the same regenerative capability. Conclusion: Our results demonstrate a regenerative role of Treg in neonatal heart regeneration. Treg can directly facilitate cardiomyocyte proliferation in a paracrine manner.

Keywords: CD4+ regulatory T-cells; cardiac fibrosis; cardiomyocyte proliferation; heart regeneration; macrophages; single-cell RNA-seq.


Conflict of interest statement

Competing Interests: The authors have declared that no competing interest exists.

Figures

Figure 1
Figure 1
Loss-of-function of CD4+ Treg leads to increased fibrosis and reduced cardiomyocyte proliferation after cryoinfarction. (A) Schematic diagram showing the experimental design. Flow cytometric analysis showing (B) co-expression of GFP and FOXP3 in Foxp3DTR/GFP mice and (C) depletion efficiency of CD3+CD4+FOXP3+ Treg in the spleen and heart after treatment with diphtheria toxin. Quantification of (C) showing (D) %Treg among total CD3+ T-cells, n=4 or (E) absolute number of Treg per mg tissue at day 7 after CI, n=4. (F) Images of scar tissues, scale bars: 2000 um; and Masson's trichrome staining showing representative serial cross sections of fibrotic tissues in blue, scale bars: 1000 um. (G) Quantification of fibrotic tissue coverage based on (F), n=9. Immunostaining on frozen sections for (H) COLA1+ (red) and cTnT+ (green) cells within the infarct zone, scale bars: 100 um; or (J) Ki67+ (red) or pH3 (red) and cTnT+ (green) cells within the border zone at day 7 post CI, scale bars: 50 um. (J) Arrows indicate cardiomyocytes positive for Ki67 or pH3 and square denotes magnified images on the right. Quantification of absolute number of (I) %cTnT+ coverage, n=5; and (K) Ki67+cTnT+ or (L) pH3+cTnT+ cardiomyocytes per mm2 area, n=7. (D, E, G, I, K, L) Data are presented as mean±S.E.M., *P<0.05, **P<0.01, ***P<0.001.
Figure 2
Figure 2
Adoptive transfer of CD4+ Treg potentiates neonatal heart regeneration after cryoinfarction. (A) Schematic diagram showing the experimental design. (B) Flow cytometric analysis showing engraftment and infiltration of CD3+CD4+hCD2+ Treg in the spleen and myocardium, respectively, at day 7 following CI to a P3 heart of NOD/SCID mice. Quantification of (C) %Treg among total splenocytes or (D) absolute number of hCD2+ Treg per mg heart tissue at the indicated time points after adoptive transfer by flow cytometry, n=3 per time point. (E) Images of scar tissues, scale bars: 2000 um; and Masson's trichrome staining showing representative serial cross sections of fibrotic tissues in blue at 4 weeks post CI, scale bars: 1000 um. (F) Quantification of fibrotic tissue coverage based on (E), n=7. (G) Immunostaining on frozen sections for Ki67+ (red) or pH3 (red) and cTnT+ (green) cells within the border zone at day 7 post CI, scale bars: 50 um. Arrows indicate cardiomyocytes positive for Ki67 or pH3 and square denotes magnified images on the right. Quantification of absolute number of (H) Ki67+cTnT+ or (I) pH3+cTnT+ cardiomyocytes per mm2 area, n=7. (J) Echocardiographic analysis and quantification showing (K) %fractional shortening or (L) %ejection fraction at 8 weeks post CI, n=7. (C, D, F, H, I, K, L) Data are presented as mean±S.E.M., *P<0.05, **P<0.01.
Figure 3
Figure 3
Adoptive transfer of FOXP3+ Treg leads to reduced fibrosis of the neonatal heart after apical resection. (A) Schematic diagram showing the experimental design. (B) Images of scar tissues, scale bars: 2000 um; Masson's trichrome staining showing a representative section of fibrotic tissues in blue, scale bars: 1000 um; and a magnified image, scale bars: 200 um. (C) Quantification of fibrotic tissue coverage based on (B), n=6. (D) Immunostaining on frozen sections for Ki67+ (red) or pH3 (red) and cTnT+ (green) cells within the border zone at day 7 post CI, scale bars: 50 um. Arrows indicate cardiomyocytes positive for Ki67 or pH3 and square denotes magnified images on the right. Quantification showing the absolute number of (D) Ki67+cTnT+ or (E) pH3+cTnT+ cardiomyocytes per mm2 area, n=7. (C, E, F) Data are presented as mean±S.E.M., *P<0.05, **P<0.01, ***P<0.001.
Figure 4
Figure 4
Single cell transcriptomic profiling reveals that Treg are a source of paracrine factors. (A) Biaxial scatter plots by t-SNE analysis showing single-cell transcriptomic clustering of Foxp3+ Treg purified from the spleen or heart at day 7 post CI to P3 ICR mice. Cells were subgrouped into specific clusters (C1-4). (B) Analysis showing selected most significantly upregulated pathways determined by GO functional annotations in terms of biological processes of C1 splenic and C2 heart Treg (Tables S1). (C) Upregulated genes in (B) were displayed by a heatmap. (D) Violin plots showing selected most significantly upregulated genes that regulate macrophage activity or regeneration processes. (E) qRT-PCR validation of selected genes identified in (C, D) based on expression level, novelty and relative function in regeneration. Data are presented as mean±S.E.M., n=4, *P<0.05, **P<0.01.
Figure 5
Figure 5
Treg directly promote proliferation of mouse neonatal cardiomyocytes in a paracrine manner. Immunocytochemistry for cTnT+ (red) and Ki67+ (green), pH3+ (green) or Aurora B+ (green) cells at day 1 after coculture of (A) CD3+CD4+hCD2+ Treg, Treg supernatant (SN), or (G) the combination of CCL24, GAS6 and AREG (Pool 3) with mouse neonatal cardiomyocytes of P1 ICR hearts, scale bars: 50 um. Quantification of (B) the absolute number of total cTnT+ cardiomyocytes after cocultured for 3 days; or (C) %Ki67+cTnT+, (D) %pH3+cTnT+ or (E) %Aurora B+cTnT+ proliferating cardiomyocytes among total cTnT+ cardiomyocytes based on (A). Quantification of proliferating cardiomyocytes after cultured with (F) the respective paracrine factors or (H-J) Pool 3 for 1 day. Data are presented as mean±S.D., n = 3 independent experiments, *P<0.05, **P<0.01.
Figure 6
Figure 6
Treg directly promote proliferation of human fetal-like cardiomyocytes in a paracrine manner. (A) Schematic diagram showing the differentiation protocol for generating human fetal-like cardiomyocytes from embryonic stem cells (hESC-CM). (B) Immunocytochemistry and (C) quantification of cTnT+ (red) and Ki67+ (green) or Aurora B+ (green) cells at day 3 after coculture of Treg supernatant or human amphiregulin (AREG) with hESC-CM, scale bars: 20 um. Data are presented as mean±S.D., n = 3 independent experiments, *P<0.05, **P<0.01.
Figure 7
Figure 7
The quantity but not the age of Treg determines the outcome of neonatal heart regeneration. (A) Flow cytometric analysis showing infiltration of CD3+CD4+hCD2+ Treg into the injured myocardium of ICR mice at day 7 post CI to the P3 or P8 heart compared to the sham control, n=4. (B) Biaxial scatter plots by t-SNE analysis showing single-cell transcriptomic clustering of Foxp3+ Treg purified from the injured myocardium at day 7 post CI to P3 or P8 ICR mice. (C) Images of scar tissues, scale bars: 2000 um; Masson's trichrome staining showing a representative section of fibrotic tissues in blue, scale bars: 1000 um. (D) Quantification of fibrotic tissue coverage based on (C). (E) Quantification of the absolute number of total cTnT+ cardiomyocytes after cultured in Treg SN for 3 days. (F) Immunocytochemistry for cTnT+ (red) and Ki67+ (green), pH3+ (green) or Aurora B+ (green) cells at day 1 after culture of Treg supernatant (SN) with mouse neonatal cardiomyocytes of P1 ICR hearts, scale bars: 50 um. Quantification of (G) %Ki67+cTnT+, (H) %pH3+cTnT+ or (I) %Aurora B+cTnT+ proliferating cardiomyocytes among total cTnT+ cardiomyocytes based on (F). Data are presented as (A) mean±S.E.M., n=4; (D) mean±S.E.M., n=6; or (E, G-I) mean±S.D., n = 3 independent experiments; *P<0.05, **P<0.01.

Similar articles

Cited by

References

    1. Porrello ER, Mahmoud AI, Simpson E, Hill JA, Richardson JA, Olson EN. et al. Transient regenerative potential of the neonatal mouse heart. Science. 2011;331:1078–1080. - PMC - PubMed
    1. Porrello ER, Mahmoud AI, Simpson E, Johnson BA, Grinsfelder D, Canseco D. et al. Regulation of neonatal and adult mammalian heart regeneration by the miR-15 family. Proc Natl Acad Sci U S A. 2013;110:187–192. - PMC - PubMed
    1. Jesty SA, Steffey MA, Lee FK, Breitbach M, Hesse M, Reining S. et al. c-kit+ precursors support postinfarction myogenesis in the neonatal, but not adult, heart. Proc Natl Acad Sci U S A. 2012;109:13380–13385. - PMC - PubMed
    1. Lavine KJ, Epelman S, Uchida K, Weber KJ, Nichols CG, Schilling JD. et al. Distinct macrophage lineages contribute to disparate patterns of cardiac recovery and remodeling in the neonatal and adult heart. Proc Natl Acad Sci U S A. 2014;111:16029–16034. - PMC - PubMed
    1. Haubner BJ, Schneider J, Schweigmann U, Schuetz T, Dichtl W, Velik-Salchner C. et al. Functional Recovery of a Human Neonatal Heart After Severe Myocardial Infarction. Circ Res. 2016;118:216–221. - PubMed

Publication types

MeSH terms

Substances