. 2019 Jun 9;9(15):4474-4493.
doi: 10.7150/thno.31942. eCollection 2019.

Astrocytic connexin 43 potentiates myelin injury in ischemic white matter disease

Affiliations

Astrocytic connexin 43 potentiates myelin injury in ischemic white matter disease

Minghuan Wang et al. Theranostics. .

Abstract

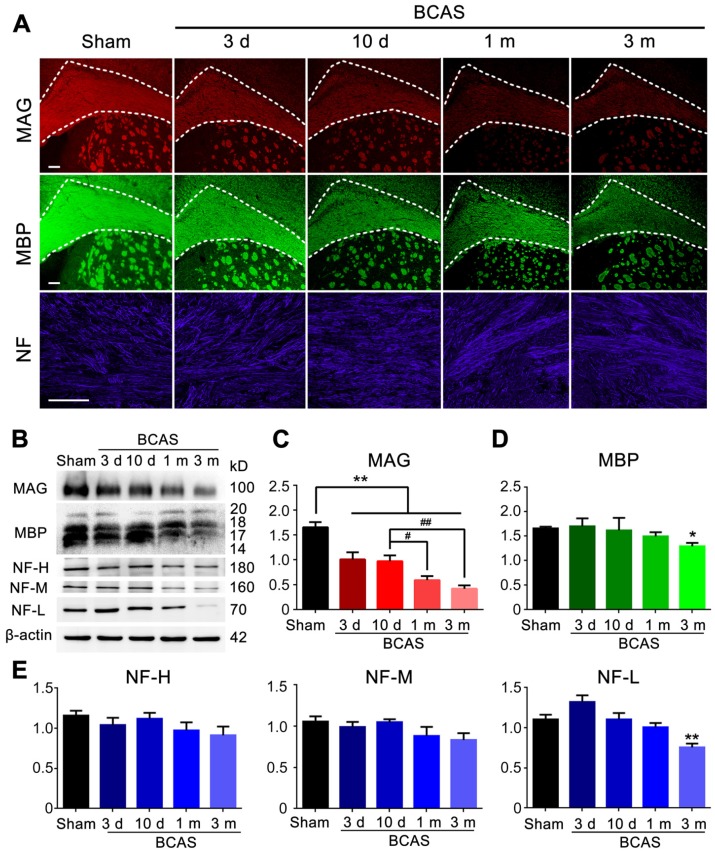
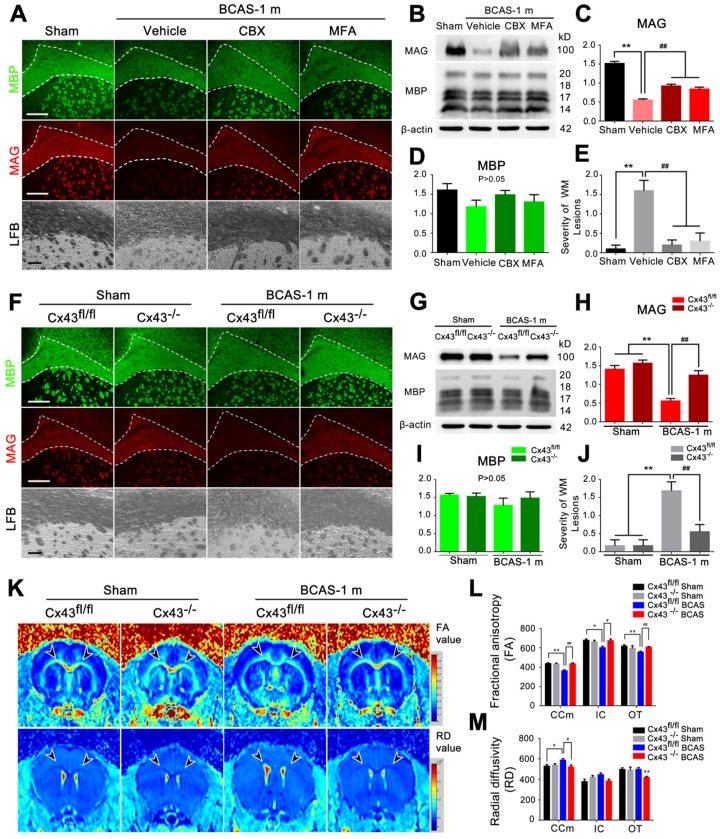
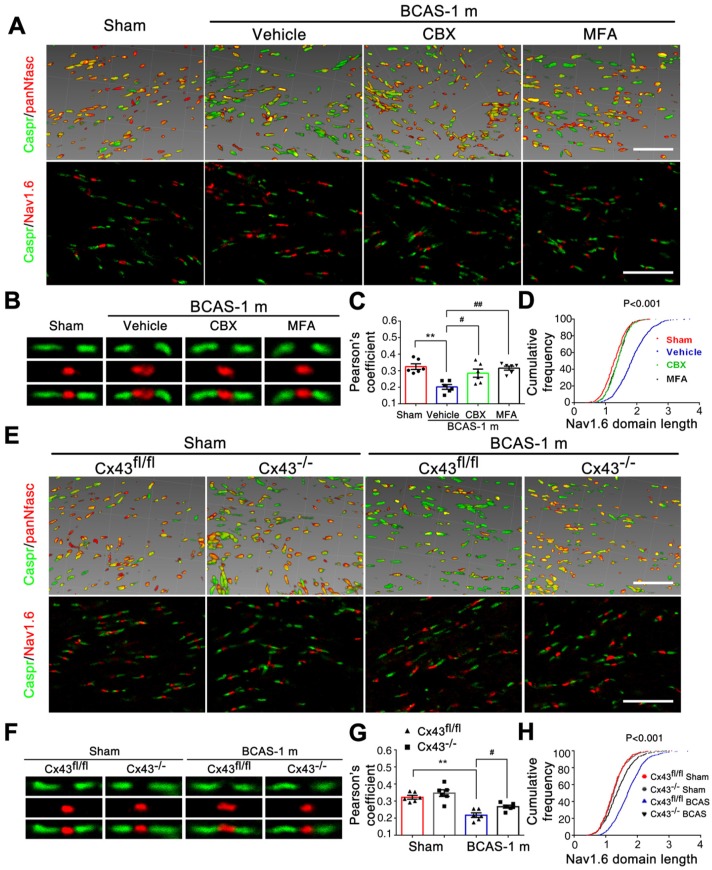
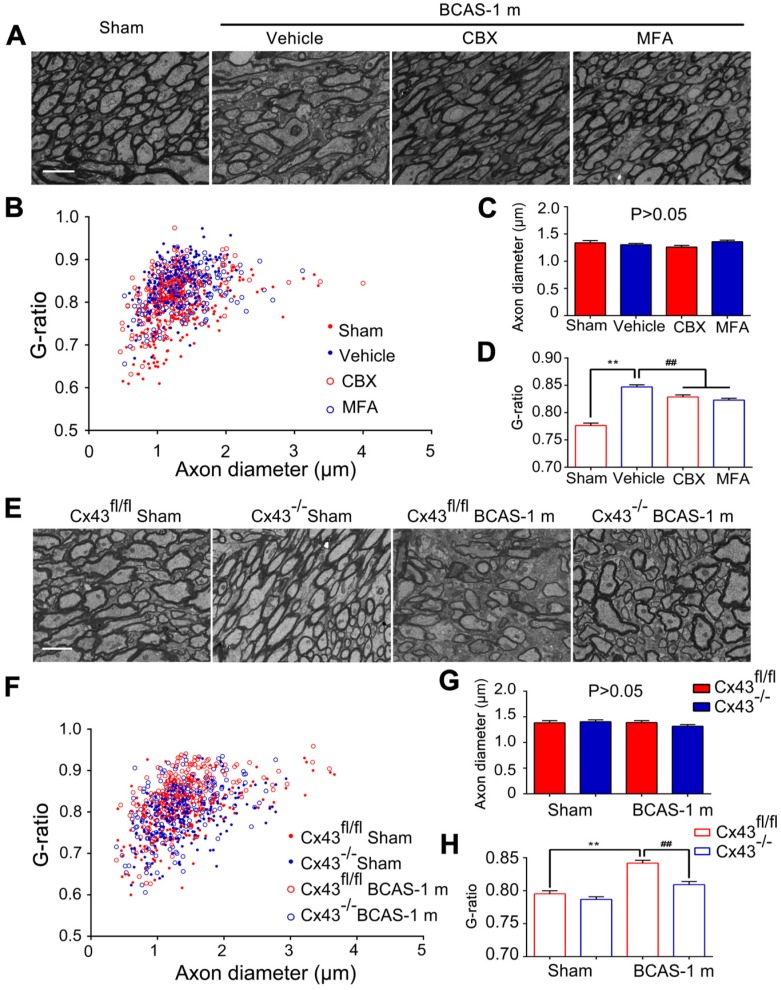
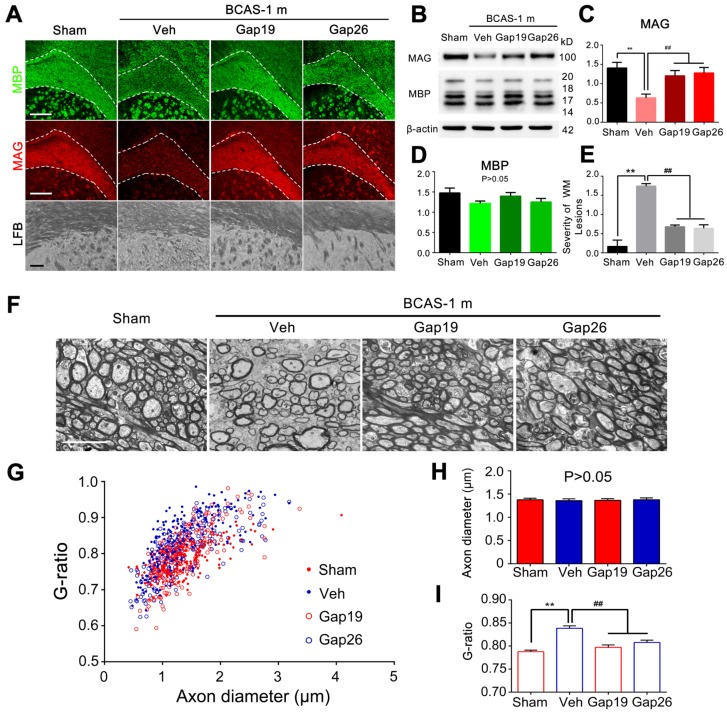
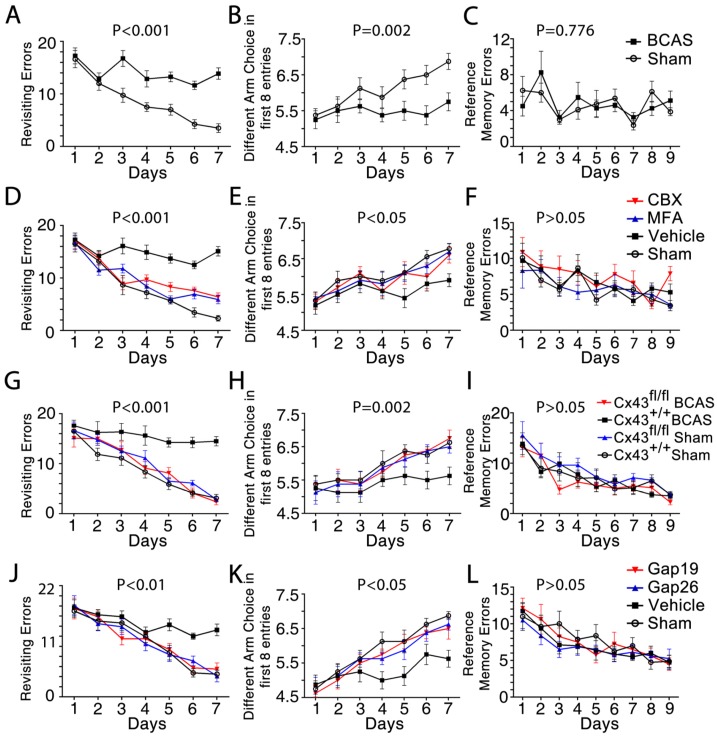
Rational: Myelin loss is a characteristic feature of both ischemic white matter disease and its associated vascular dementia, and is a hallmark of chronic cerebral hypoperfusion due to carotid artery stenosis. Yet the cellular mechanisms involved in ischemic dysmyelination are not well-understood, and no effective treatment has emerged to prevent or slow hypoperfusion-related demyelination. In a study employing the bilateral common carotid artery stenosis (BCAS) mouse model, we found reduced cerebral blood flow velocity and arteriolar pulsatility, and confirmed that prolonged BCAS provoked myelin disruption. These pathological features were associated with marked cognitive decline, in the absence of evident damage to axons. Methods: To assess the role of astroglial communication in BCAS-associated demyelination, we investigated the effect of deleting or inhibiting connexin 43 (Cx43), a constituent of astroglial gap junctions and hemichannels. Results: Genetic deletion and pharmacological inhibition of gap junctions both protected myelin integrity and rescued cognitive decline in the BCAS-treated mice. Gap junction inhibition also suppressed the transient increase in extracellular glutamate observed in the callosal white matter of wild-type mice exposed to BCAS. Conclusion: These findings suggest that astrocytic Cx43 may be a viable target for attenuating the demyelination and cognitive decline associated with chronic cerebral hypoperfusion.

Keywords: astrocyte; connexin 43; ischemic white matter disease; myelin injury.


Conflict of interest statement

Competing Interests: The authors have declared that no competing interest exists.

Figures

Figure 1
Figure 1
Reduction of blood flow velocity and arteriole pulsatility after BCAS. (A) Schematic of BCAS model. (B) Representative images showed the penetrating artery at a depth of 60 μm below cerebral cortex surface in BCAS mice at three days post-surgery. Red blood cell (RBC) velocity was detected by two photon line scanning from the penetrating arterioles centerline axis (white line). The streaks within the line scan images represent non-fluorescent RBCs moving across a fluorescent background, where δx represents the distance traveled by RBCs during the time interval, δt. The RBC velocity is then calculated from the regression slope as shown in the equation. Scale bar, 2 µm. (C) Representative images of RBC movement in penetrating vessels and comparison of RBC velocity along a penetrating arteriole at three days, ten days, and one month post BCAS. **p˂0.01 **p˂0.01 versus Sham, one-way ANOVA with Dunnett's post-hoc test, n=6 mice for each group and sampling of three vessels for each mouse. (D) Cortical penetrating arteries were selected and the X-T line scans (white lines) were generated orthogonal to the vessel axis. Vascular pulsatility was then calculated as the absolute value of the integral of vascular diameter during a three second recording. The penetrating arteriole diameters and pulsatility were evaluated by two photon imaging at three days, ten days, and one month post-BCAS. Scale bar, 20 µm. (E-F) A bar histogram comparison of penetrating arteriole diameters and pulsatility at three days, ten days and one month post BCAS compared to sham operated mice *p˂0.05 **p˂0.01 versus Sham, #p˂0.05 ##p˂0.01 versus three days post BCAS, one-way ANOVA with Dunnett's post-hoc test, n=6 mice in each group and sampling of three vessels in each mouse.
Figure 2
Figure 2
Myelin disruption was observed in chronic hypoperfusion mice. (A) Representative images depicting immunofluorescent labeling of myelin-associated glycoprotein (MAG), myelin basic protein (MBP), and neurofilament (NF) in coronal slices from sham-operated mice and bilateral common carotid artery stenosis (BCAS) mice at different time points post-surgery (three days, ten days, one month and three months). Scale bar, 100 µm. (B) The expression of MAG, MBP and NF (three major NF subunits based upon their molecular mass: lowest (NF-L), the middle (NF-M) and the highest (NF-H)) was determined by western blots at three days, ten days, one month, and three months post-BCAS and quantitative analysis of results in (B) was performed (C-E). *p˂0.05, **p˂0.01 versus Sham, #p˂0.05 ##p˂0.01 versus ten days post-BCAS, one-way ANOVA with Dunnett's post-hoc test, n=6 mice for each group.
Figure 3
Figure 3
White matter disruption following BCAS detected by MRI and electron microscopy. (A, C) Selected regions of 7.0 Tesla (T) MRI for inspecting the integrity of myelin sheath and axonal structures in different regions of white matter (the medial part of corpus callosum (CCm), peripheral part of corpus callosum (CCp), anterior commissure (AC), fimbria of hippocampus (F), the internal capsule (IC) and the optic tract (OT)) at different time points (three days, ten days, one month, and three months) post BCAS. (B, D) Quantitative analysis of fractional anisotropy (FA) and radial diffusivity (RD) at different time points (three days, ten days, one month and three months). Arrowheads indicate vacuoles and delamination, which are classical signs of disruption of myelinated structures. *p˂0.05, **p˂0.01 versus Sham, one-way ANOVA with Dunnett's post-hoc test, n=6 mice for sham and three months, n=5 for three and ten days, and n=7 for one month. (E) Representative electron microscopy images of axons in corpus callosum of sham-operated and BCAS mice at three days, ten days, one month and three months post-BCAS. Representative electron microscopy images are from sham-operated and BCAS mice at one month post-BCAS. Scale bar, 2 µm. (F) Scatter plot diagram of the g ratios (the inner axonal diameter relative to the total outer diameter) and axon diameter was performed at one month post-injury. (G) Quantitative analysis of g ratios at different time points (three days, ten days, one month and three months) post injury. **p˂0.01, p>0.05 versus Sham, one-way ANOVA with Dunnett's post-hoc test, n=200 myelinated axons (40 axons per mouse, 5 mice per group) for each group.
Figure 4
Figure 4
BCAS-associated white matter disruption was protected by gap junction inhibition. (A) Representative confocal images of coronal sections labeled with MBP and MAG from sham-operated and carbenoxolone (CBX) and meclofenamic acid (MFA) treated groups. The severity of white matter lesions was also assessed by Luxol fast blue (LFB) staining. Quantitative analysis was performed in (E). **p˂0.01 versus Sham, ##p˂0.01 versus Vehicle, one-way ANOVA with Dunnett's post-hoc test, n=10 mice per group. Scale bars, 300 µm and 50 µm. (B) Expression of MAG and MBP was determined by western blots in mice from sham-operated and vehicle, CBX and MFA treated group. (C-D) Quantitative analysis of (B). **p˂0.01 versus Sham, ##p˂0.01 versus Vehicle, one-way ANOVA with Dunnett's post-hoc test, n=6 mice per group. (F) Representative confocal images of coronal sections stained for MBP and MAG from Cx43fl/fl BCAS mice, GFAP-Cre+ Cx43fl/fl (Cx43-/-) mice and sham-operated littermate controls at one month post-surgery. Expression of MAG and MBP was determined by western blots (G-I) and severity of white matter lesion was assessed by LFB staining. Quantitative analysis was performed in (J). **p˂0.01 versus Sham, ##p˂0.01 versus Cx43fl/fl BCAS mice, one-way ANOVA with Dunnett's post-hoc test, n=6 mice per group. Scale bars, 300 µm, 50 µm. (K) 7 T MRI scan detecting the integrity of myelin sheath and axonal structures in corpus callosum, internal capsule and optic tract in Cx43fl/fl BCAS mice, Cx43-/- BCAS mice and sham-operated control at one month post-surgery. (L-M) Quantitative analysis of fractional anisotropy value (FA) and axial diffusivity (RD) value in (K). *p<0.05, **p<0.01 versus Cx43fl/fl Sham, #p<0.05, ## p<0.01 versus Cx43fl/fl BCAS mice, one-way ANOVA with Dunnett's post-hoc test, n=4 for Cx43-/- sham-operated control, n=5 for Cx43fl/fl BCAS mice, Cx43-/- BCAS mice and Cx43fl/fl sham-operated control.
Figure 5
Figure 5
Disruption of axon-glial interaction was reversed by gap junction blocking. (A) Representative confocal images immunostained for Caspr/panNfasc and Caspr/Nav1.6 in response to hypoperfusion in CBX, MFA, and vehicle-treated mice as well as sham-operated controls at one month post-surgery. Scale bar, 10 µm. (B) A higher magnification of (A) is shown. (C) Quantitative analysis of the Caspr/panNfasc co-localization. **p˂0.01 versus Sham, #p˂0.05, ##p˂0.01 versus Vehicle, one-way ANOVA with Dunnett's post-hoc test, n=6 mice per group. (D) Summary of the length of Nav1.6 domain in the corpus callosum is shown in the curve. p˂0.001 CBX-, MFA-treated versus Vehicle, Vehicle versus Sham, one-way ANOVA with Dunnett's post-hoc test, n=6 mice for each group and 100 Nav1.6 domains for each mouse. (E) Representative confocal images labeled with Caspr/panNfasc and Caspr/Nav1.6 in Cx43fl/fl, Cx43-/- mice and sham-operated controls at one month post BCAS. Scale bar, 10 µm. (F) A higher magnification of (E) is shown. (G) Quantitative analysis of Caspr/panNfasc colocalization is shown in histogram. n=6 mice per group. **p˂0.01 versus Sham, #p˂0.05 versus Cx43lox/lox (Cx43fl/fl) BCAS mice, one-way ANOVA with Dunnett's post-hoc test. (H) Summary of the length of the Nav1.6 clusters in the corpus callosum is shown in the curve. p˂0.001 Cx43fl/fl BCAS mice versus Sham, Cx43-/- BCAS mice versus Cx43fl/fl BCAS mice, one-way ANOVA with Dunnett's post-hoc test, n=6 mice for each group and 100 Nav1.6 domains for each mouse.
Figure 6
Figure 6
Ultrastructural myelin injury was attenuated by inhibition of connexin 43. (A) Representative electron microscopy images from brains collected at one month post BCAS in CBX, MFA, and vehicle-treated mice, as well as their sham-operated controls. Scale bar, 2.5 µm. (B-D) Quantitative analysis of the g ratios and axon diameters was performed. **p˂0.01 versus Sham, ##p˂0.01 versus Vehicle, one-way ANOVA with Dunnett's post-hoc test, n=200 myelinated axons (40 axons per mouse, five mice per group) for each group. (E) Representative electron microscopy images in Cx43fl/fl mice and GFAP-Cre+ Cx43fl/fl (Cx43-/-) mice at one month post BCAS as well as their sham-operated controls. Scale bar, 2.5 µm. (F-H) Quantitative analysis of the g ratios and axon diameters was performed. **p˂0.01 versus Sham, ##p˂0.01 versus Cx43fl/fl BCAS mice, one-way ANOVA with Dunnett's post-hoc test, n=200 myelinated axons (40 axons per mouse, five mice per group) for each group.
Figure 7
Figure 7
Protection from BCAS-associated white matter disruption by selective inhibition of Cx43 by two mimetic peptides, Gap19 and Gap26. (A) Representative confocal images of coronal sections labeled with MBP and MAG from sham-operated and Gap19 or Gap26-treated groups. The severity of white matter lesions was also assessed by Luxol fast blue (LFB) staining. Quantitative analysis was performed in (E). **p˂0.01 versus Sham, ##p˂0.01 versus Vehicle, one-way ANOVA with Dunnett's post-hoc test, n=6 mice per group. Scale bars, 300 µm and 50 µm. (B) Expression of MAG and MBP was determined by western blots in mice from sham-operated and vehicle, Gap19, and Gap26-treated groups. (C-D) Quantitative analysis of (B). **p˂0.01 versus Sham, ##p˂0.01 versus Vehicle, one-way ANOVA with Dunnett's post-hoc test, n=6 mice per group. (F) Representative electron microscopy images from brains collected at one month post BCAS in CBX, MFA and vehicle treated mice as well as their sham-operated controls. Scale bar, 2.5 µm. (G-I) Quantitative analysis of the g ratios and axon diameters was performed. **p˂0.01 versus Sham, ##p˂0.01 versus Vehicle, one-way ANOVA with Dunnett's post-hoc test, n=200 myelinated axons (40 axons per mouse, five mice per group) for each group.
Figure 8
Figure 8
Working memory impairment was improved by inhibition of astroglial Cx43. The working memory of mice from each group was assessed by the eight-arm maze test at one month post-injury. One-way ANOVA with repeated analysis. (A-C) At one month post injury the BCAS mice made many more revisiting errors (p<0.001) and fewer different arm choices in the first eight entries (p=0.002) compared to the sham-operated mice. No impairment of spatial reference memory was revealed for BCAS mice in the eight-arm maze test (p=0.776). n=8 mice for each group. (D-F) There were far fewer revisiting errors in MFA- and CBX-treated groups (p<0.001) and far more different arm choices made in the first eight entries (p<0.05) compared to vehicle-treated mice, while no obvious difference of reference memory errors was observed (p>0.05). n=9 for Sham, n=10 for Vehicle and MFA- and CBX-treated groups. (G-I) At one month after BCAS, GFAP-Cre+ Cx43fl/fl (Cx43-/-) mice made fewer revisiting errors (p<0.001) and more different arm choices in the first eight entries (p=0.002) compared to their littermate controls, while no obvious difference in reference memory errors was evident (p>0.05). n=8 mice for each group. (J-L) There were far fewer revisiting errors in the Gap26- and Gap19-treated groups (p<0.01), and far more different arm choices made in the first eight entries (p<0.05) comparing to vehicle-treated mice, while no obvious difference of reference memory errors was observed (p>0.05). n=8 mice for each group.
Figure 9
Figure 9
Interstitial glutamate levels post-BCAS were normalized by ablation of astroglial connexin43. (A) Representative chromatograms of microdialysis results depicting the elution profiles of standard amino acid (AA) solutions and microdialysate samples after derivatization with OPA-sulfite for the detection of glutamate. The dashed square inset indicated the profile of the extracellular glutamate concentration. Black curve: standard AA solution (10 µM); Green curve: microdialysate from white matter. (B) A higher magnification image of a representative microdialysis chromatogram. The black curve depicts results for Cx43fl/fl mice and the red curve GFAP-Cre+ Cx43fl/fl (Cx43-/-) mice. (C-E) The interstitial concentrations of glutamate (C), lactate (D) and adenosine (E) in corpus callosum in Cx43fl/fl and Cx43-/- BCAS mice as well as sham-operated controls at three days and one month post-surgery. *p˂0.05 versus Sham, #p˂0.05, ##p˂0.01 versus Cx43fl/fl mice at three days post-BCAS, one-way ANOVA with Dunnett's post-hoc test, n=6 mice for each group. (F) The normalized 1H-NMR spectra of white matter tissue extracts, with the dashed square insets, indicating the 13C-NMR spectra profile of Glu4 in white matter tissue extracts. This figure was derived from the average values of Glu4 concentration in white matter tissue extract and standard error (SE), where SE was calculated based on the standard deviation and the number of replicates. (G) The proton signals connected with the C4 in Glutamate in the NMR spectra, which was the same as the dash square in Fig. 9G. The black curve depicts the results for Cx43fl/fl mice and the red curve for GFAP-Cre+ Cx43fl/fl (Cx43-/-) mice. The green band shows the range of standard error for Cx43fl/fl mice and the blue band shows the corresponding range for Cx43-/- mice. Glu4: sum of all resonances of Glu labeled at the carbon 4 position. p˂0.01 versus Cx43fl/fl mice three days post-BCAS, one-way ANOVA with Dunnett's post-hoc test, n=8 for Cx43-/- sham-operated mice and Cx43-/- mice at three days post BCAS, n=9 for Cx43-/- mice at one month post BCAS, n=7 for all the littermate control groups.

Similar articles

Cited by

References

    1. Johnston SC, O'Meara ES, Manolio TA, Lefkowitz D, O'Leary DH, Goldstein S. et al. Cognitive impairment and decline are associated with carotid artery disease in patients without clinically evident cerebrovascular disease. Ann Intern Med. 2004;140:237–47. - PubMed
    1. Buratti L, Balucani C, Viticchi G, Falsetti L, Altamura C, Avitabile E. et al. Cognitive deterioration in bilateral asymptomatic severe carotid stenosis. Stroke. 2014;45:2072–7. - PubMed
    1. Iadecola C. The pathobiology of vascular dementia. Neuron. 2013;80:844–66. - PMC - PubMed
    1. Mathiesen EB, Waterloo K, Joakimsen O, Bakke SJ, Jacobsen EA, Bonaa KH. Reduced neuropsychological test performance in asymptomatic carotid stenosis: The Tromso Study. Neurology. 2004;62:695–701. - PubMed
    1. Andrabi SA, Kang HC, Haince JF, Lee YI, Zhang J, Chi ZK. et al. Iduna protects the brain from glutamate excitotoxicity and stroke by interfering with poly(ADP-ribose) polymer-induced cell death. Nat Med. 2011;17:692–U82. - PMC - PubMed

Publication types

MeSH terms