Meta-Analysis
. 2019 Jul 1;5(1):18.
doi: 10.1038/s41522-019-0091-8. eCollection 2019.

Gut microbiota phenotypes of obesity

Affiliations
Meta-Analysis

Gut microbiota phenotypes of obesity

Maggie A Stanislawski et al. NPJ Biofilms Microbiomes. .

Abstract

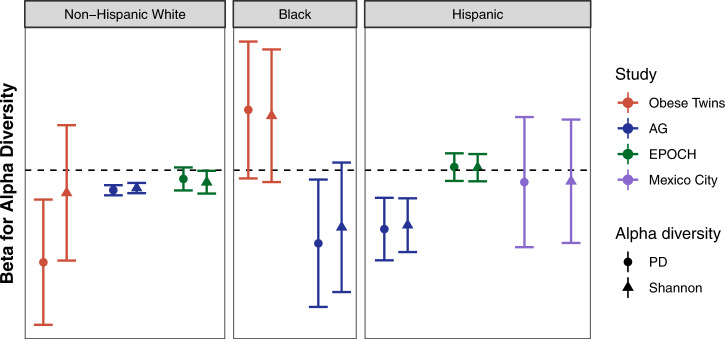
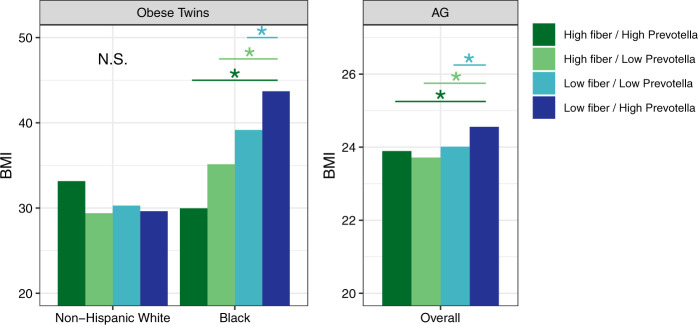
Obesity is a disease with a complex etiology and variable prevalence across different populations. While several studies have reported gut microbiota composition differences associated with obesity in humans, there has been a lack of consistency in the nature of the reported changes; it has been difficult to determine whether methodological differences between studies, underlying differences in the populations studied, or other factors are responsible for this discordance. Here we use 16 S rRNA data from previously published studies to explore how the gut microbiota-obesity relationship varies across heterogeneous Western populations, focusing mainly on the relationship between (1) alpha diversity and (2) Prevotella relative abundance with BMI. We provide evidence that the relationship between lower alpha diversity and higher BMI may be most consistent in non-Hispanic white (NHW) populations and/or those with high socioeconomic status, while the relationship between higher Prevotella relative abundance and BMI may be stronger among black and Hispanic populations. We further examine how diet may impact these relationships. This work suggests that gut microbiota phenotypes of obesity may differ with race/ethnicity or its correlates, such as dietary components or socioeconomic status. However, microbiome cohorts are often too small to study complex interaction effects and non-white individuals are greatly underrepresented, creating substantial challenges to understanding population-level patterns in the microbiome-obesity relationship. Further study of how population heterogeneity influences the relationship between the gut microbiota and obesity is warranted.

Keywords: Microbial communities; Microbiota.


Conflict of interest statement

Competing interestsThe authors declare no competing interests.

Figures

Fig. 1
Fig. 1
Results of adjusted regression models of BMI as a function of alpha diversity. These plots show the regression β estimates (and 95% confidence intervals) for phylogenetic diversity and Shannon diversity index. The dotted line shows 0; estimates significantly below the line indicate that lower alpha diversity is associated with higher BMI and vice versa. This plot suggests that the association often reported in the literature between lower alpha diversity and obesity may be most consistent among Non-Hispanic white populations (left) and/or among relatively healthy populations of high socioeconomic status, such as AG (shown in blue)
Fig. 2
Fig. 2
Estimated BMI by high fat red meat intake and alpha diversity. The relationship between alpha diversity and BMI (Fig. 1) in AG differed according to dietary intake of “high fat red meat.” No dietary interactions (fat, meat, or fiber) with alpha diversity were found in the other cohorts examined. This plot shows the estimated BMI from adjusted regression models by categories of intake of high fat red meat intake and alpha diversity (Phylogenetic and Shannon diversity): frequent (≥3 times per week) or low intake of high fat red meat and high (top quartile) or low-moderate alpha diversity. Those with frequent high fat red meat intake and low alpha diversity had significantly higher BMI than all other groups
Fig. 3
Fig. 3
Results of adjusted regression models of BMI as a function of Prevotella. These plots show the regression β estimates (and 95% confidence intervals) for Prevotella (relative abundance in Obese Twins and AG; the ratio of Prevotella relative abundance to the sum of the relative abundance of Prevotella and Bacteroides in Mexico City; see Methods for details). The dotted line shows 0; estimates significantly above the line indicate that higher Prevotella is associated with higher BMI. This plot shows that the magnitude of the effect estimates for Prevotella is larger for blacks and Hispanics than for NHWs
Fig. 4
Fig. 4
The relationship between Prevotella and BMI (Fig. 3) in Obese Twins and AG differed according to dietary intake of fiber. This plot shows the estimated BMI from adjusted regression models by categories of high/low fiber and Prevotella relative abundance, defined according to the different measures in each study (see Methods). The interaction between fiber and Prevotella was only apparent in blacks in Obese Twins; AG lacked power to examine these categories by race/ethnicity. In both studies, individuals with low fiber and high Prevotella had the highest BMI, and those with high fiber and Prevotella had significantly lower BMI

References

    1. Wang Y, Beydoun MA. The obesity epidemic in the United States gender, age, socioeconomic, racial/ethnic, and geographic characteristics: a systematic review and meta-regression analysis. Epidemiol. Rev. 2007;29:6–28. doi: 10.1093/epirev/mxm007. - DOI - PubMed
    1. Zupancic ML, et al. Analysis of the gut microbiota in the old order amish and its relation to the metabolic syndrome. PLoS ONE. 2012;7:e43052. doi: 10.1371/journal.pone.0043052. - DOI - PMC - PubMed
    1. Ogden CL, Yanovski SZ, Carroll MD, Flegal KM. The epidemiology of obesity. Gastroenterology. 2007;132:2087–2102. doi: 10.1053/j.gastro.2007.03.052. - DOI - PubMed
    1. Turnbaugh PJ, et al. A core gut microbiome in obese and lean twins. Nature. 2008;457:480–484. doi: 10.1038/nature07540. - DOI - PMC - PubMed
    1. Hermes GDA, Zoetendal EG, Smidt H. Molecular ecological tools to decipher the role of our microbial mass in obesity. Benef. Microbes. 2015;6:61–81. doi: 10.3920/BM2014.0016. - DOI - PubMed

Publication types