. 2019 Jul 1:5:110.
doi: 10.1038/s41420-019-0189-z. eCollection 2019.

E1A oncogene induced sensitization to NK cell induced apoptosis requires PIDD and Caspase-2

Affiliations

E1A oncogene induced sensitization to NK cell induced apoptosis requires PIDD and Caspase-2

Jay R Radke et al. Cell Death Discov. .

Abstract

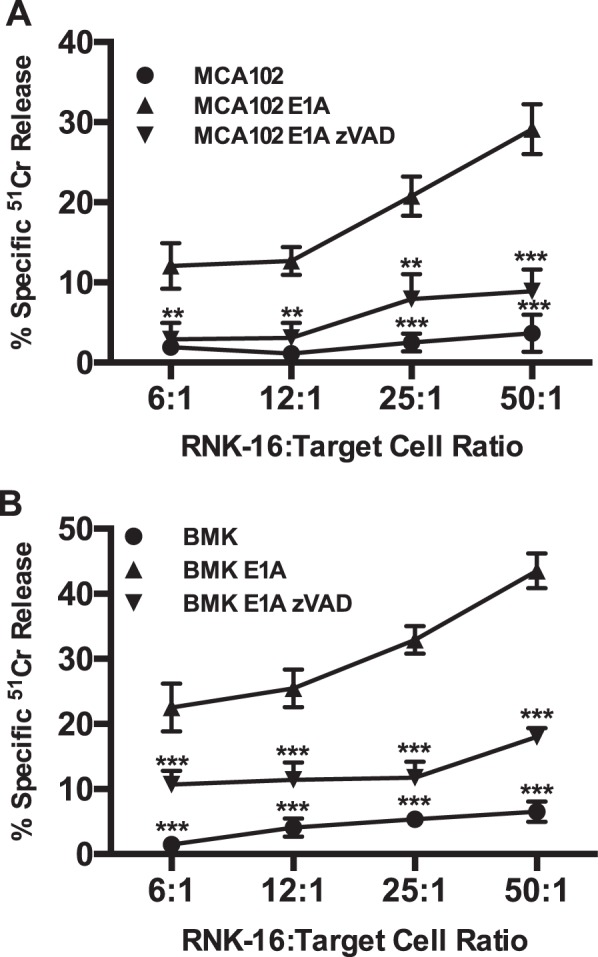
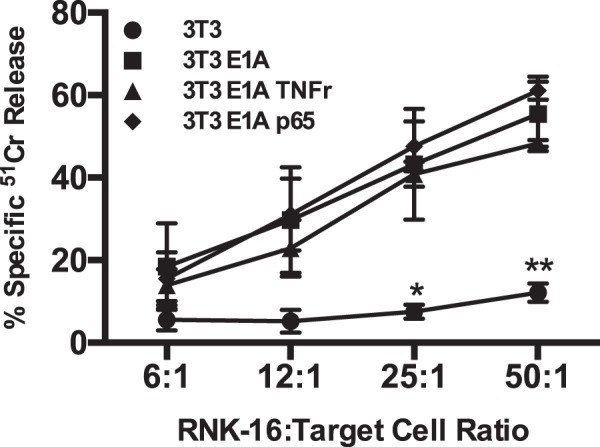
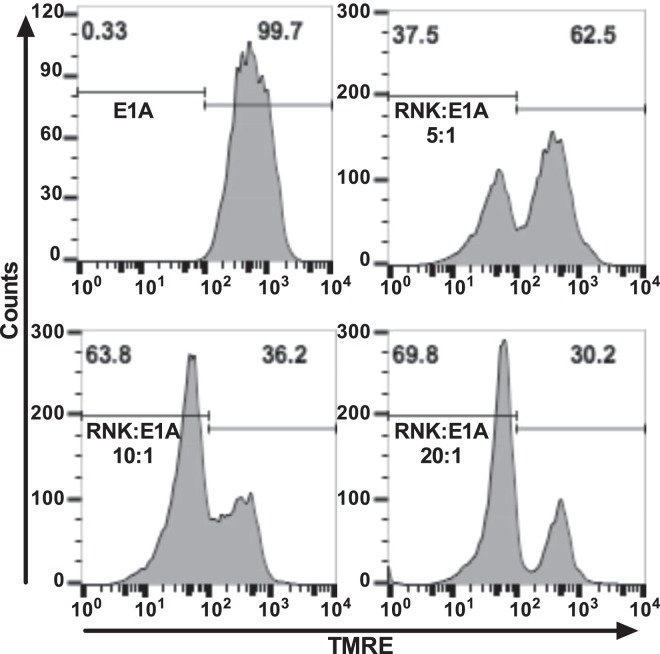
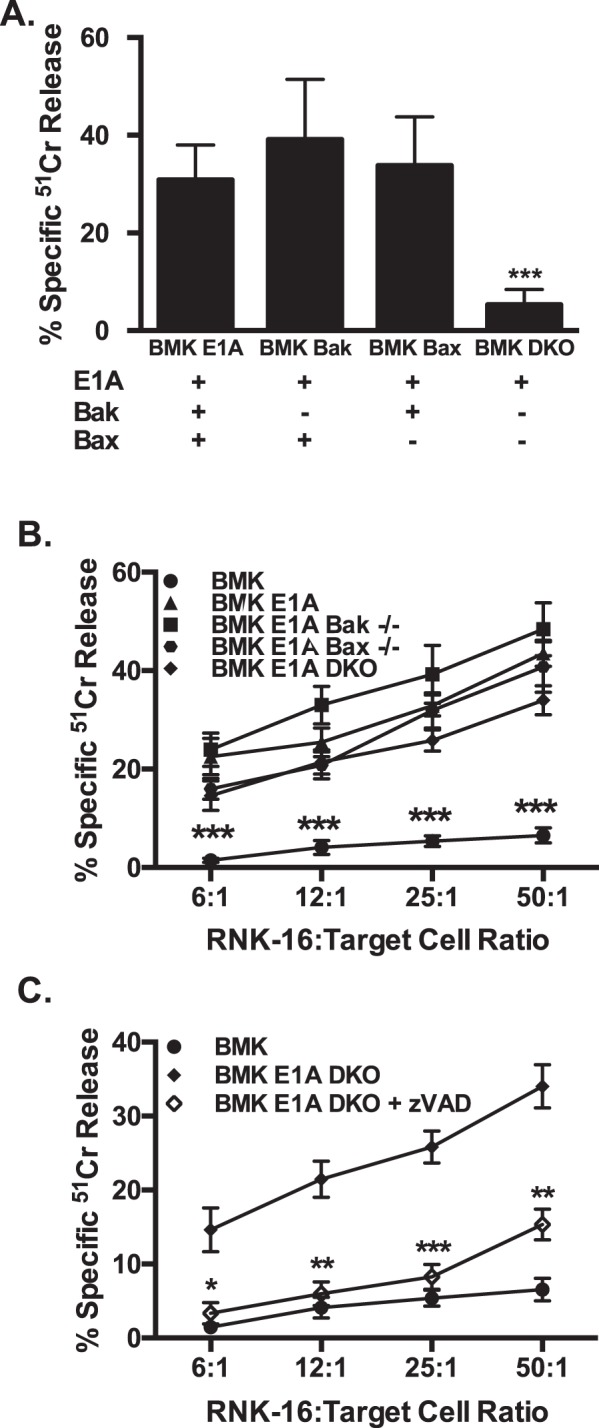
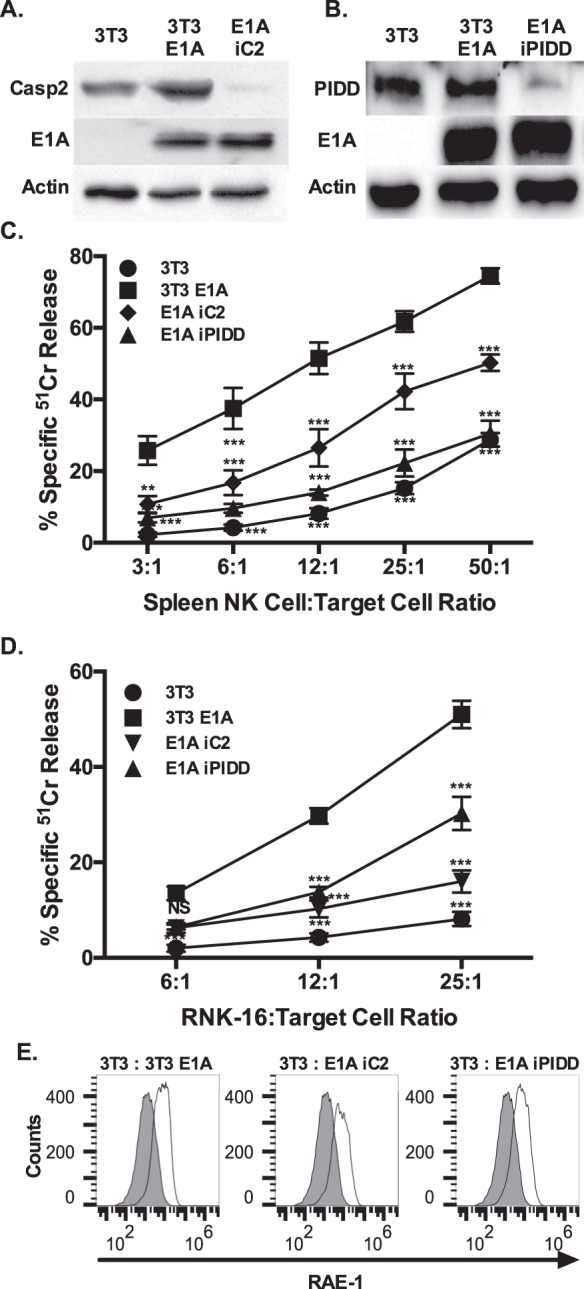
Expression of the adenovirus E1A oncogene sensitizes tumor cells to innate immune rejection by NK cells. This increased NK sensitivity is only partly explained by an E1A-induced increase in target cell surface expression of NKG2D ligands. The post-recognition mechanisms by which E1A sensitizes cells to the apoptotic cell death response to NK injury remains to be defined. E1A sensitizes cells to apoptotic stimuli through two distinct mechanisms-repression of NF-κB-dependent antiapoptotic responses and enhancement of caspase-2 activation and related mitochondrial injury. The current studies examined the roles of each of these post-NKG2D-recognition pathways in the increased sensitivity of E1A-positive target cells to NK killing. Sensitization to NK-induced apoptosis was independent of E1A-mediated repression of cellular NF-κB responses but was dependent on the expression of both caspase-2 and the upstream, caspase-2 activating molecule, PIDD. Target cells lacking caspase-2 or PIDD expression retained E1A-induced increased expression of the NKG2D ligand, RAE-1. NK cell-induced mitochondrial injury of E1A-expressing cells did not require expression of the mitochondrial molecules, Bak or Bax. These results define a PIDD/caspase-2-dependent pathway, through which E1A sensitizes cells to NK-mediated cytolysis independently of and complementarily to E1A-enhanced NKG2D/RAE-1 ligand expression.

Keywords: Apoptosis; Innate immunity.


Conflict of interest statement

Conflict of interestThe authors declare that they have no conflict of interest.

Figures

Fig. 1
Fig. 1. Role of caspases in NK-mediated cytolysis of E1A-expressing cells.
a [Cr51]-labeled MCA102 (circle), MCA102 E1A (triangle) cells were incubated with RNK-16 cells at the indicated RNK:target ratios in the absence or presence (inverted triangle) of 100 μM zVAD-fmk. After 6 h, supernatants were collected and % specific Cr51 release was assessed (mean ± SEM; n = 4, ***P < 0.0001, **P ≤ 0.0084, one-way ANOVA). b [Cr51]-labeled BMK (circle) or BMK-E1A (triangle) cells were incubated with RNK-16 cells at the indicated RNK:target ratios in the absence or presence (inverted triangle) of 100 μM zVAD-fmk. After 6 h, supernatants were collected and % specific Cr51 release was assessed (mean ± SEM; n = 4, ***P ≤ 0.0001, one-way ANOVA)
Fig. 2
Fig. 2. Role of NF-κB-dependent cellular responses in susceptibility of E1A-expressing cells to NK.
[Cr51]-labeled NIH-3T3 (circle), 3T3-E1A (square), 3T3-E1A TNF resistant (TNFr) (triangle) or 3T3-E1A p65 RelA (p65) (diamond) cells were incubated with RNK-16 cells at the indicated RNK:target ratios. After 6 h, supernatants were collected and % specific Cr51 release was assessed (mean ± SEM; n = 3, **P = 0.0015, *P = 0.0126, one-way ANOVA)
Fig. 3
Fig. 3. NK cell induced mitochondrial injury.
3T3-E1A cells were incubated with cell tracker blue-stained RNK-16 cells at the indicated ratios of RNK:E1A cells for 4 h and then stained with TMRE. Histograms show non-blue gated cells (3T3-E1A cells) and are representative of four individual experiments. Percentage of non-blue cells are shown above the markers
Fig. 4
Fig. 4. Role of Bak and Bax in RNK cytolysis of E1A-expressing cells.
a [H3]-thymidine-labeled BMK-E1A, BMK-E1A-Bak−/− (BMK Bak), BMK-E1A-Bax−/− (BMK Bax), or BMK-E1A-Bak/Bax−/−/−/− (BMK DKO) cells were incubated with ceramide (100 µM) overnight. Supernatants were collected and % specific thymidine release was assessed (mean ± SEM; n = 5, ***P = 0.001, one-way ANOVA). b [Cr51]-labeled BMK (circle), BMK-E1A (triangle), BMK-E1A-Bak−/− (square), BMK-E1A-Bax−/− (inverted triangle) or BMK-E1A-Bak/Bax−/−/−/− (double knockout = DKO, diamond) cells were incubated with RNK-16 cells at the indicated RNK:target ratios. After 6 h, supernatants were collected and % specific 51Cr release was assessed (mean ± SEM; n = 4, ***P ≤ 0.0003, one-way ANOVA). c [Cr51]-labeled BMK (circle) or BMK-E1A-Bak/Bax−/−/−/− (double knockout = DKO, diamonds) cells were incubated with RNK-16 cells at the indicated RNK:target ratios in the absence (filled diamond) or presence (open diamond) of 100 μM zVAD-fmk. After 6 h, supernatants were collected and % specific 51Cr release was assessed (mean ± SEM; n = 4, ***P ≤ 0.0001, **P = 0.0016, one-way ANOVA)
Fig. 5
Fig. 5. Role of caspase-2, PIDD and RAE-1 in the sensitivity of E1A-expressing cells to NK cell lysis.
a Expression of Casp-2, E1A and actin in 3T3, 3T3-E1A and E1A-iC2 cell lines (originally published in. b Expression of PIDD, E1A and actin in 3T3, 3T3-E1A and E1A-iPIDD cell lines. c [Cr51]-labeled 3T3 (circle), 3T3-E1A (square), E1A-iC2 (inverted triangle), and E1A-iPIDD (triangle) cells were incubated with nude rat splenic NK cells at the indicated spleen cell:target ratios. % specific 51Cr release was assessed (mean ± SEM; n = 4, ***P ≤ 0.0002, **P = 0.0012, one-way ANOVA). d [Cr51]-labeled 3T3 (circle), 3T3-E1A (square), E1A-iC2 (inverted triangle), and E1A-iPIDD (triangle) cells were incubated with RNK-16 cells at the indicated RNK:target ratios. % specific 51Cr release was assessed (mean ± SEM; n = 4, ***P ≤ 0.0008, one-way ANOVA). d RAE-1 expression on 3T3 (filled histogram) compared to 3T3-E1A (open histogram), E1A-iC2 (open histogram), and E1A-iPIDD (open histogram) cells. Data shown are representative of four individual experiments

Similar articles

References

    1. Felsani A, Mileo AM, Paggi MG. Retinoblastoma family proteins as key targets of the small DNA virus oncoproteins. Oncogene. 2006;25:5277–5285. doi: 10.1038/sj.onc.1209621. - DOI - PubMed
    1. Ralston R, Bishop M. The protein products of the myc and myb oncogenes and adenovirus E1a are structurally related. Nature. 1983;306:803–806. doi: 10.1038/306803a0. - DOI - PubMed
    1. Cook, J. L. & Routes, J. M. Role of the innate immune response in determining the tumorigenicity of neoplastic cells. 106, 99–107; discussion 107–108, 143–160 (2001). - PubMed
    1. Cook JL, Lewis AM. Immunological surveillance against DNA-virus-transformed cells: correlations between natural killer cell cytolytic competence and tumor susceptibility of athymic rodents. J. Virol. 1987;61:2155–2161. - PMC - PubMed
    1. Routes JM, Ryan S, Li H, Steinke J, Cook JL. Dissimilar immunogenicities of human papillomavirus E7 and adenovirus E1A proteins influence primary tumor development. Virology. 2000;277:48–57. doi: 10.1006/viro.2000.0571. - DOI - PubMed