. 2019 Oct;20(5):511-528.
doi: 10.1007/s10162-019-00729-z. Epub 2019 Jul 8.

Pre-operative Brain Imaging Using Functional Near-Infrared Spectroscopy Helps Predict Cochlear Implant Outcome in Deaf Adults

Affiliations

Pre-operative Brain Imaging Using Functional Near-Infrared Spectroscopy Helps Predict Cochlear Implant Outcome in Deaf Adults

Carly A Anderson et al. J Assoc Res Otolaryngol. 2019 Oct.

Abstract

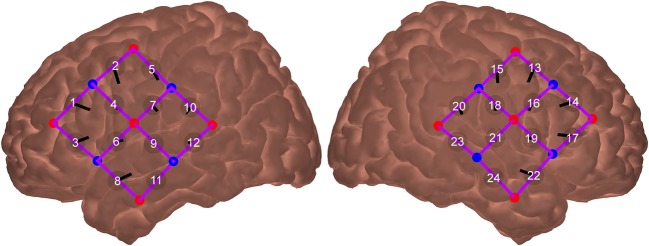
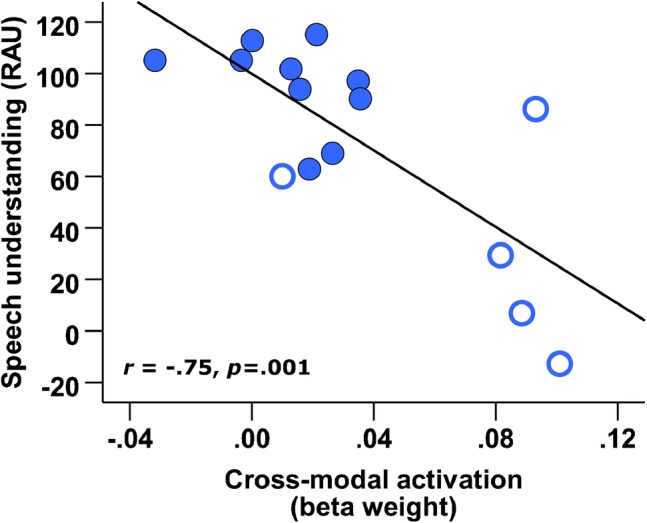
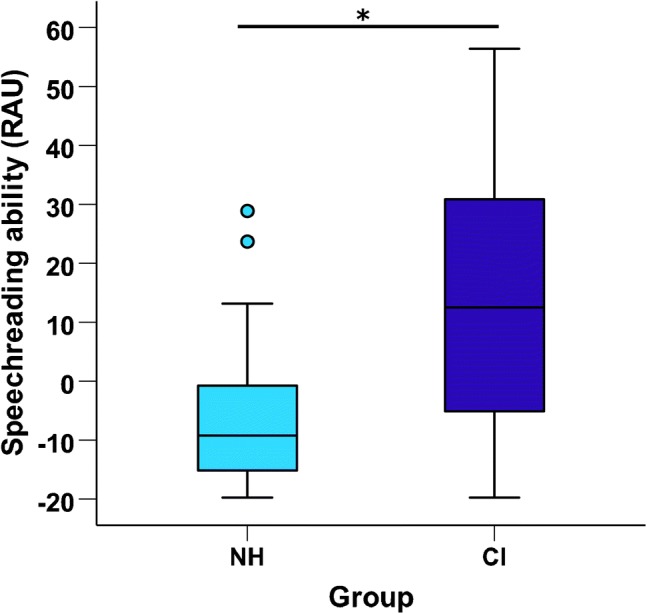
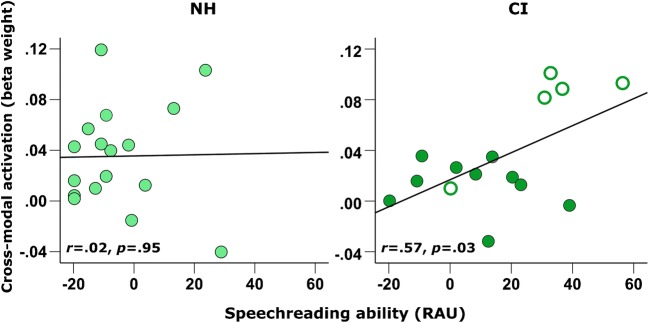
Currently, it is not possible to accurately predict how well a deaf individual will be able to understand speech when hearing is (re)introduced via a cochlear implant. Differences in brain organisation following deafness are thought to contribute to variability in speech understanding with a cochlear implant and may offer unique insights that could help to more reliably predict outcomes. An emerging optical neuroimaging technique, functional near-infrared spectroscopy (fNIRS), was used to determine whether a pre-operative measure of brain activation could explain variability in cochlear implant (CI) outcomes and offer additional prognostic value above that provided by known clinical characteristics. Cross-modal activation to visual speech was measured in bilateral superior temporal cortex of pre- and post-lingually deaf adults before cochlear implantation. Behavioural measures of auditory speech understanding were obtained in the same individuals following 6 months of cochlear implant use. The results showed that stronger pre-operative cross-modal activation of auditory brain regions by visual speech was predictive of poorer auditory speech understanding after implantation. Further investigation suggested that this relationship may have been driven primarily by the inclusion of, and group differences between, pre- and post-lingually deaf individuals. Nonetheless, pre-operative cortical imaging provided additional prognostic value above that of influential clinical characteristics, including the age-at-onset and duration of auditory deprivation, suggesting that objectively assessing the physiological status of the brain using fNIRS imaging pre-operatively may support more accurate prediction of individual CI outcomes. Whilst activation of auditory brain regions by visual speech prior to implantation was related to the CI user's clinical history of deafness, activation to visual speech did not relate to the future ability of these brain regions to respond to auditory speech stimulation with a CI. Greater pre-operative activation of left superior temporal cortex by visual speech was associated with enhanced speechreading abilities, suggesting that visual speech processing may help to maintain left temporal lobe specialisation for language processing during periods of profound deafness.

Keywords: cochlear implantation; cross-modal plasticity; functional near-infrared spectroscopy; prognostic imaging; speechreading; superior temporal cortex.


Conflict of interest statement

The authors declare that they have no conflict of interest.

Figures

Fig. 1
Fig. 1
Mean position of fNIRS optodes and measurement channels. Measurement channels are labelled numerically, source optodes are indicated in red and detector optodes are indicated in blue
Fig. 2
Fig. 2
Pre-implant STC activation to visual speech predicts CI outcome. Scatterplot of bilateral STC activation to visual speech before implantation and future CI outcome, with best fitting regression line shown (n = 15). Filled markers represent data obtained from post-lingually deaf CI users, and open markers represent data obtained from pre- and peri-lingually deaf CI users
Fig. 3
Fig. 3
Group-level cortical activation map for visual speech. Amplitude of cortical activation to visual speech for normal-hearing controls (NH, n = 17) and CI users before implantation (CI, n = 16), colour coded by t value. Significantly activated channels releveled by one-tailed t tests (p < .05, FDR corrected) are highlighted
Fig. 4
Fig. 4
Group-averaged time courses of cross-modal activation to visual speech. Changes in HbO (red) and HbR (blue) concentration, as well as HbT levels (purple), during the presentation of visual speech (stimulation period indicated by shaded grey bar) shown for normal-hearing controls (labelled NH) and CI users before implantation (labelled CI), panelled by ROI. Coloured shading indicates ± 1 standard error across participants
Fig. 5
Fig. 5
Mean amplitude of cross-modal activation to visual speech. Bar graph showing mean amplitude of cross-modal activation to visual speech (beta weight) for normal-hearing controls (NH, n = 17) and CI users before implantation (CI, n = 16), panelled by ROI. Error bars represent ± 1 standard error. n.s. non-significant
Fig. 6
Fig. 6
Speechreading ability in control subjects and CI users before implantation. Box plot displaying speechreading ability (words correctly identified, RAU) for normal-hearing controls (NH, n = 17) and CI users (CI, n = 17) before implantation. *p = .01, 2-tailed
Fig. 7
Fig. 7
Pre-implant STC activation to visual speech and speechreading ability. Scatterplot of pre-implant bilateral STC activation to visual speech and speechreading ability with regression lines shown, panelled by group NH (n = 17) and CI (n = 15). Filled markers represent data obtained from post-lingually deaf CI users, and open markers represent data obtained from pre- and peri-lingually deaf CI users
Fig. 8
Fig. 8
Correlation between left and right STC activation and speechreading ability in CI users. Scatterplot of pre-implant STC activation to visual speech and speechreading ability in CI users (n = 15) with regression line shown, panelled by ROI. Filled markers represent data obtained from post-lingually deaf CI users, and open markers represent data obtained from pre- and peri-lingually deaf CI users
Fig. 9
Fig. 9
Correlations between cross-modal activation and clinical history of deafness. Scatterplot of pre-implant bilateral STC activation to visual speech with a age-at-onset of bilateral hearing loss and b duration of bilateral hearing loss, with regression lines shown (n = 15). Filled markers represent data obtained from post-lingually deaf CI users, and open markers represent data obtained from pre- and peri-lingually deaf CI users

References

    1. Aasted CM, Yücel MA, Cooper RJ, Dubb J, Tsuzuki D, Becerra L, Petkov MP, Borsook D, Dan I, Boas DA. Anatomical guidance for functional near-infrared spectroscopy: AtlasViewer tutorial. NEUROW. 2015;2:020801–020801. - PMC - PubMed
    1. Anderson CA (2016) Cortical predictors and correlates of cochlear implant outcome: a longitudinal study using functional near-infrared spectroscopy. PhD thesis, University of Nottingham. http://eprints.nottingham.ac.uk/id/eprint/37948
    1. Anderson CA, Lazard DS, Hartley DEH. Plasticity in bilateral superior temporal cortex: effects of deafness and cochlear implantation on auditory and visual speech processing. Hear Res. 2017;343:138–149. doi: 10.1016/j.heares.2016.07.013. - DOI - PubMed
    1. Anderson CA, Wiggins IM, Kitterick PT, Hartley DEH. Adaptive benefit of cross-modal plasticity following cochlear implantation in deaf adults. Proc Natl Acad Sci. 2017;114:10256–10261. doi: 10.1073/pnas.1704785114. - DOI - PMC - PubMed
    1. Auer ET, Bernstein LE. Enhanced visual speech perception in individuals with early-onset hearing impairment. J Speech Language Hear Res. 2007;50:1157–1165. doi: 10.1044/1092-4388(2007/080). - DOI - PubMed

Publication types