

P-Rex1 Overexpression Results in Aberrant Neuronal Polarity and Psychosis-Related Behaviors
- PMID: 31286410
- PMCID: PMC6864005
- DOI: 10.1007/s12264-019-00408-2
P-Rex1 Overexpression Results in Aberrant Neuronal Polarity and Psychosis-Related Behaviors
Abstract
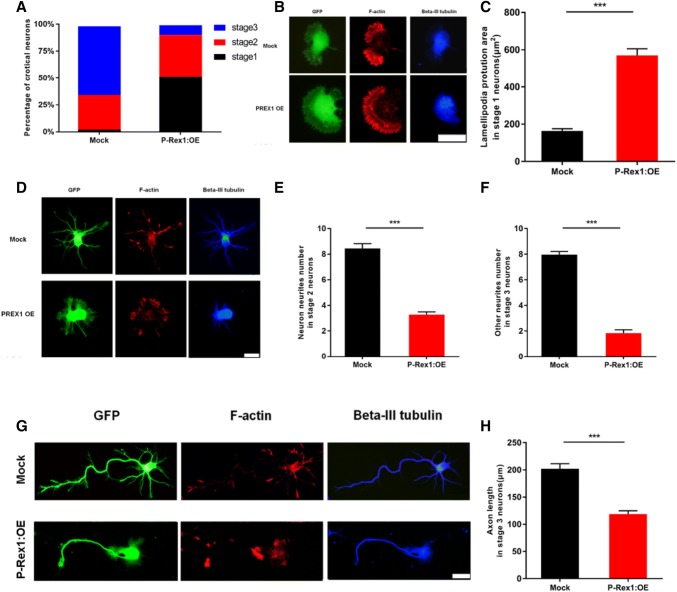
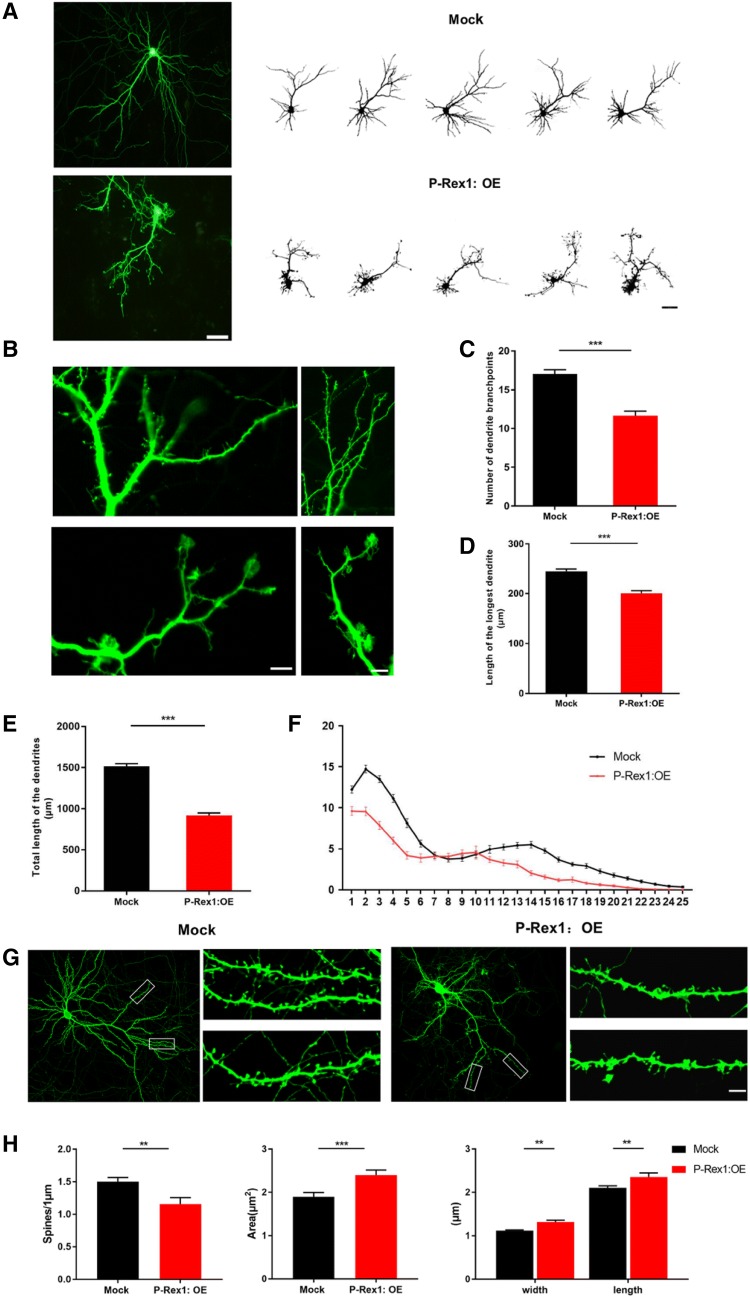
Neuronal polarity is involved in multiple developmental stages, including cortical neuron migration, multipolar-to-bipolar transition, axon initiation, apical/basal dendrite differentiation, and spine formation. All of these processes are associated with the cytoskeleton and are regulated by precise timing and by controlling gene expression. The P-Rex1 (phosphatidylinositol-3,4,5-trisphosphate dependent Rac exchange factor 1) gene for example, is known to be important for cytoskeletal reorganization, cell motility, and migration. Deficiency of P-Rex1 protein leads to abnormal neuronal migration and synaptic plasticity, as well as autism-related behaviors. Nonetheless, the effects of P-Rex1 overexpression on neuronal development and higher brain functions remain unclear. In the present study, we explored the effect of P-Rex1 overexpression on cerebral development and psychosis-related behaviors in mice. In utero electroporation at embryonic day 14.5 was used to assess the influence of P-Rex1 overexpression on cell polarity and migration. Primary neuron culture was used to explore the effects of P-Rex1 overexpression on neuritogenesis and spine morphology. In addition, P-Rex1 overexpression in the medial prefrontal cortex (mPFC) of mice was used to assess psychosis-related behaviors. We found that P-Rex1 overexpression led to aberrant polarity and inhibited the multipolar-to-bipolar transition, leading to abnormal neuronal migration. In addition, P-Rex1 overexpression affected the early development of neurons, manifested as abnormal neurite initiation with cytoskeleton change, reduced the axon length and dendritic complexity, and caused excessive lamellipodia in primary neuronal culture. Moreover, P-Rex1 overexpression decreased the density of spines with increased height, width, and head area in vitro and in vivo. Behavioral tests showed that P-Rex1 overexpression in the mouse mPFC caused anxiety-like behaviors and a sensorimotor gating deficit. The appropriate P-Rex1 level plays a critical role in the developing cerebral cortex and excessive P-Rex1 might be related to psychosis-related behaviors.
Keywords: Lamellipodia; Neurodevelopment; P-Rex1; Polarity; Psychosis-related behavior.
Conflict of interest statement
The authors declare no conflict of interest.
Figures


Similar articles
-
Involvement of a Rac activator,P-Rex1, in neurotrophin-derived signaling and neuronal migration.J Neurosci. 2005 Apr 27;25(17):4406-19. doi: 10.1523/JNEUROSCI.4955-04.2005. J Neurosci. 2005. PMID: 15858067 Free PMC article.
-
Drebrin-like (Dbnl) Controls Neuronal Migration via Regulating N-Cadherin Expression in the Developing Cerebral Cortex.J Neurosci. 2019 Jan 23;39(4):678-691. doi: 10.1523/JNEUROSCI.1634-18.2018. Epub 2018 Nov 30. J Neurosci. 2019. PMID: 30504273 Free PMC article.
-
P-Rex1 - a multidomain protein that regulates neurite differentiation.J Cell Sci. 2008 Sep 1;121(Pt 17):2892-903. doi: 10.1242/jcs.030353. Epub 2008 Aug 12. J Cell Sci. 2008. PMID: 18697831
-
The Rho guanine nucleotide exchange factor P-Rex1 as a potential drug target for cancer metastasis and inflammatory diseases.Pharmacol Res. 2020 Mar;153:104676. doi: 10.1016/j.phrs.2020.104676. Epub 2020 Jan 30. Pharmacol Res. 2020. PMID: 32006571 Review.
-
Decoding the molecular mechanisms of neuronal migration using in utero electroporation.Med Mol Morphol. 2016 Jun;49(2):63-75. doi: 10.1007/s00795-015-0127-y. Epub 2015 Nov 25. Med Mol Morphol. 2016. PMID: 26608533 Review.
Cited by
-
Rac-maninoff and Rho-vel: The symphony of Rho-GTPase signaling at excitatory synapses.Small GTPases. 2022 Jan;13(1):14-47. doi: 10.1080/21541248.2021.1885264. Epub 2021 May 6. Small GTPases. 2022. PMID: 33955328 Free PMC article.
-
P-Rex1 Controls Sphingosine 1-Phosphate Receptor Signalling, Morphology, and Cell-Cycle Progression in Neuronal Cells.Cells. 2021 Sep 18;10(9):2474. doi: 10.3390/cells10092474. Cells. 2021. PMID: 34572121 Free PMC article.
-
Ash1l loss-of-function results in structural birth defects and altered cortical development.Brain. 2025 Jan 7;148(1):55-68. doi: 10.1093/brain/awae218. Brain. 2025. PMID: 38943682 Free PMC article.
-
Autism candidate gene DIP2A regulates spine morphogenesis via acetylation of cortactin.PLoS Biol. 2019 Oct 10;17(10):e3000461. doi: 10.1371/journal.pbio.3000461. eCollection 2019 Oct. PLoS Biol. 2019. PMID: 31600191 Free PMC article.
-
F-BAR proteins CIP4 and FBP17 function in cortical neuron radial migration and process outgrowth.bioRxiv [Preprint]. 2024 Oct 25:2024.10.25.620310. doi: 10.1101/2024.10.25.620310. bioRxiv. 2024. Update in: J Neurosci. 2025 Aug 20;45(34):e1952242025. doi: 10.1523/JNEUROSCI.1952-24.2025. PMID: 39484544 Free PMC article. Updated. Preprint.
References
-
- Rakic P. Mode of cell migration to the superficial layers of fetal monkey neocortex. J Comp Neurol. 1972;145:61–83. - PubMed
-
- Rakic P, Stensas LJ, Sayre E, Sidman RL. Computer-aided three-dimensional reconstruction and quantitative analysis of cells from serial electron microscopic montages of foetal monkey brain. Nature. 1974;250:31–34. - PubMed
-
- Craig AM, Banker G. Neuronal polarity. Annu Rev Neurosci. 1994;17:267–310. - PubMed
-
- Nadarajah B, Alifragis P, Wong RO, Parnavelas JG. Neuronal migration in the developing cerebral cortex: observations based on real-time imaging. Cereb Cortex. 2003;13:607–611. - PubMed
MeSH terms
Substances
LinkOut - more resources
Full Text Sources
Medical
Miscellaneous
