Review
. 2019 Oct;22(10):1690-1708.
doi: 10.1111/ele.13335. Epub 2019 Jul 8.

Thermal biology of mosquito-borne disease

Affiliations
Review

Thermal biology of mosquito-borne disease

Erin A Mordecai et al. Ecol Lett. 2019 Oct.

Abstract

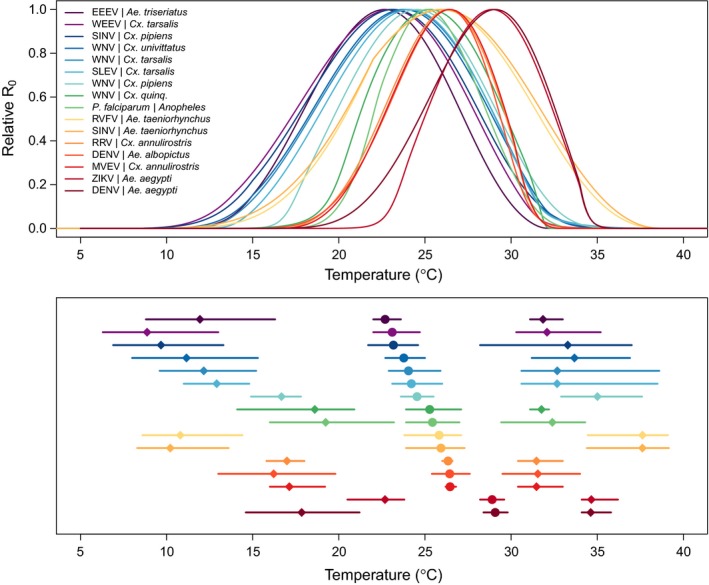
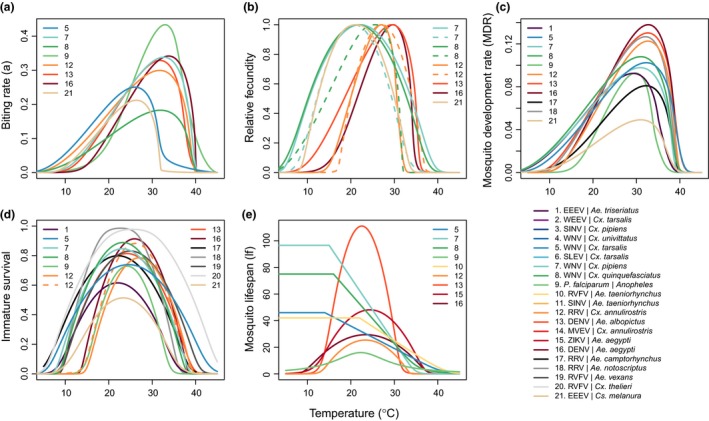
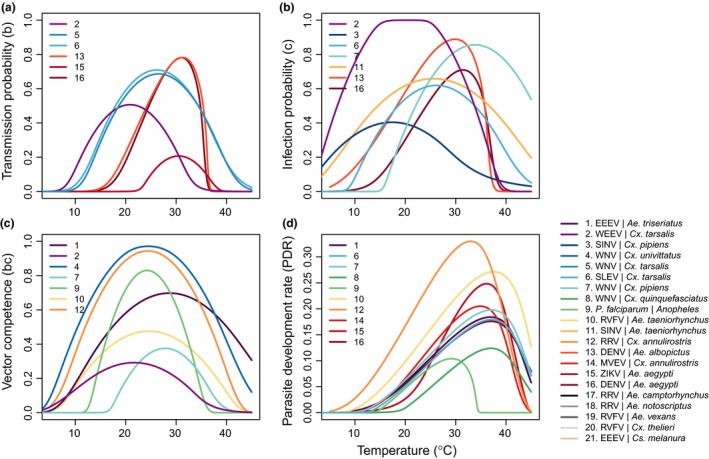
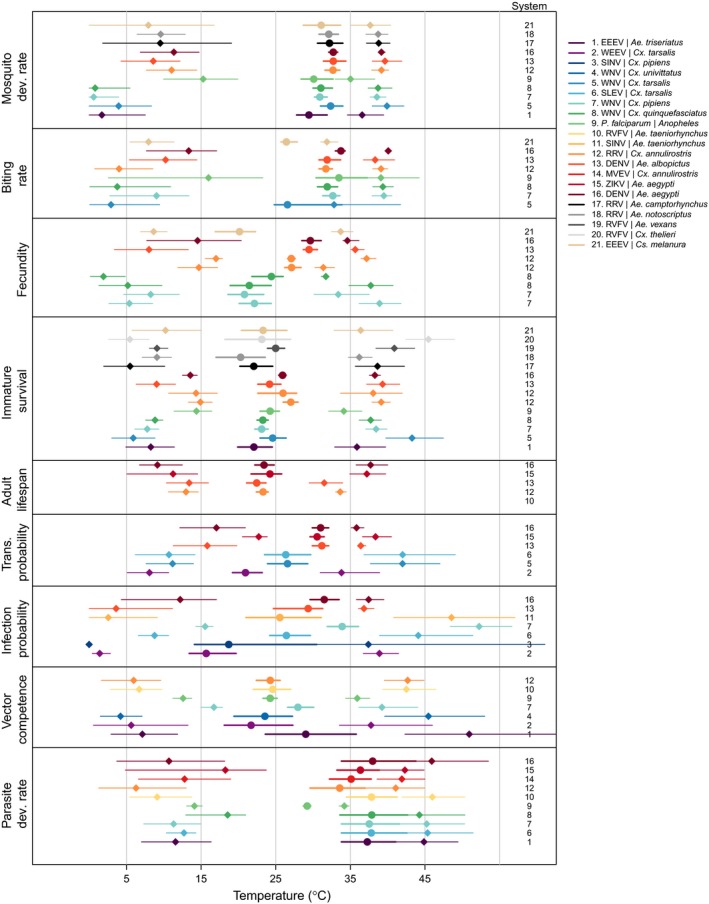
Mosquito-borne diseases cause a major burden of disease worldwide. The vital rates of these ectothermic vectors and parasites respond strongly and nonlinearly to temperature and therefore to climate change. Here, we review how trait-based approaches can synthesise and mechanistically predict the temperature dependence of transmission across vectors, pathogens, and environments. We present 11 pathogens transmitted by 15 different mosquito species - including globally important diseases like malaria, dengue, and Zika - synthesised from previously published studies. Transmission varied strongly and unimodally with temperature, peaking at 23-29ºC and declining to zero below 9-23ºC and above 32-38ºC. Different traits restricted transmission at low versus high temperatures, and temperature effects on transmission varied by both mosquito and parasite species. Temperate pathogens exhibit broader thermal ranges and cooler thermal minima and optima than tropical pathogens. Among tropical pathogens, malaria and Ross River virus had lower thermal optima (25-26ºC) while dengue and Zika viruses had the highest (29ºC) thermal optima. We expect warming to increase transmission below thermal optima but decrease transmission above optima. Key directions for future work include linking mechanistic models to field transmission, combining temperature effects with control measures, incorporating trait variation and temperature variation, and investigating climate adaptation and migration.

Keywords: Arbovirus; Ross River virus; West Nile virus; Zika virus; climate change; dengue virus; malaria; mosquito; temperature; thermal performance curve.


Figures

Figure 1
Figure 1
The trait‐based approach to understanding effects of temperature on vector‐borne disease transmission. In this approach, we derive trait thermal performance curves from experimental data, synthesise their combined temperature‐dependent effect on R0, validate the model with independent field observations, and project predicted temperature suitability for transmission onto current and future climates.
Figure 2
Figure 2
Temperature‐dependent R0 models are consistently unimodal with differing thermal optima and limits across systems. Top panel: temperature‐dependent R0 models for 16 vector–pathogen systems; bottom panel: R0 thermal optima (temperature where R0 peaks; circles) and lower and upper limits (temperature where R0 = 0; diamonds), with 95% credible intervals (lines). Curves depict empirically parameterised temperature‐dependent R0 models for each vector – pathogen pair, normalised so the y‐axis ranges from 0 to 1 because other factors that affect the absolute magnitude of R0 vary by system. Colors designate different vector – pathogen systems, ordered by thermal optima for R0 in the both panels. Abbreviations for all vectors and parasites are given in Table S1.
Figure 3
Figure 3
Trait thermal performance curves for vector life history traits vary by species. Thermal performance curves estimated from laboratory experimental data across different vector species that transmit different pathogens (systems are numbered in each panel; overall system numbering key and color scheme are in the main legend). Color scheme is consistent with Fig. 2, i.e., ordered by thermal optima for R0; systems for which no R0 model was calculated are listed last. Vector traits are (a) biting rate (a); (b) relative fecundity; (c) mosquito development rate (MDR); (d) immature survival; and (e) mosquito lifespan (lf). Fecundity is rescaled to range from zero to one because it is alternatively measured as eggs per female per day (EFD; Ae. aegypti, Cx. annulirostris), eggs per female per oviposition cycle (EFOC; Ae. albopictus, Cx. pipiens), number of larvae per raft (nLR; Cx. annulirostris [dashed line]), eggs per raft (EPR; Cx. quinquefasciatus), or proportion ovipositing (pO; Cx. pipiens [dashed line], Cx. quinquefasciatus [dashed line], Cs. melanura). Immature survival probability is measured as egg‐to‐adult survival probability (pEA; Ae. aegypti, Ae. albopictus, An. gambiae), larva‐to‐adult survival probability (pLA; Ae. camptorhynchus, Ae. notoscriptus, Ae. triseriatus, Ae. vexans, Cx. annulirostris, Cx. pipiens, Cx. quinquefasciatus, Cx. tarsalis, Cs. melanura), proportion of egg rafts that hatch (pRH; Cx. annulirostris [dashed line]), or egg viability (EV; Cx. thelieri). To be conservative, for three temperate vectors that can undergo diapause and therefore survive cold temperatures (Cx. tarsalis, Cx. pipiens, Cx. quinquefasciatus), lifespan (lf) was assumed to be constant from 0ºC to the lowest temperature measured in the experiments (14‐16ºC), because a decline at low temperatures was not observed in the data. Abbreviations for all vectors and parasites are given in Table S1.
Figure 4
Figure 4
Trait thermal performance curves for pathogen transmission traits within the vector vary by species. Thermal performance curves estimated from laboratory experimental data across different pathogens and vectors (systems are numbered in each panel; overall system numbering key and color scheme are in the main legend). Color scheme is consistent with Figs 2 and 3. Traits are (a) transmission probability (b); (b) infection probability (c); (c) vector competence (bc); and (d) parasite development rate (PDR). Abbreviations for all vectors and parasites are given in Table S1.
Figure 5
Figure 5
Traits vary in thermal minimum, optimum, and maximum across species. For each vector and/or pathogen for which a trait was measured, points show the mean thermal optimum (circles) and lower and upper thermal limits (diamonds) along with their 95% credible intervals (lines). Traits are mosquito development rate (MDR), biting rate (a), fecundity (EFD, EFOC, nLR, EPR, pO), immature survival (pEA, pLA, pRH, EV), adult mosquito lifespan (lf), transmission probability (b), infection probability (c), vector competence (bc), and parasite development rate (PDR). Traits for which minima, optima, or maxima were not estimated are not shown. Not all traits were measured in all species. Color scheme is consistent with Figs 2 and 3. Systems are numbered to the right of each trait; overall system numbering key and color scheme are in the main legend. Abbreviations for all vectors and parasites are given in Table S1.

References

    1. Akey, D.H. , Potter, H.W. & Jone, R.H. (1978). Effects of rearing temperature and larval density on longevity, size, and fecundity in the biting gnat Culicoides variipennis. Ann. Entomol. Soc. Am., 71, 411–418.
    1. Alonso, D. , Bouma, M.J. & Pascual, M. (2011). Epidemic malaria and warmer temperatures in recent decades in an East African highland. Proc. R. Soc. B Biol. Sci., 278, 1661–1669. - PMC - PubMed
    1. Alsan, M. (2015). The effect of the TseTse fly on African development. Am. Econ. Rev., 105, 382–410.
    1. Amarasekare, P. & Savage, V. (2012). A framework for elucidating the temperature dependence of fitness. Am. Nat., 179, 178–191. - PubMed
    1. Angilletta, M.J. (2009). Thermal Adaptation: A Theoretical and Empirical Synthesis. Oxford, UK:Oxford University Press.