

Multiple C2 domains and transmembrane region proteins (MCTPs) tether membranes at plasmodesmata
- PMID: 31286648
- PMCID: PMC6680132
- DOI: 10.15252/embr.201847182
Multiple C2 domains and transmembrane region proteins (MCTPs) tether membranes at plasmodesmata
Abstract
In eukaryotes, membrane contact sites (MCS) allow direct communication between organelles. Plants have evolved a unique type of MCS, inside intercellular pores, the plasmodesmata, where endoplasmic reticulum (ER)-plasma membrane (PM) contacts coincide with regulation of cell-to-cell signalling. The molecular mechanism and function of membrane tethering within plasmodesmata remain unknown. Here, we show that the multiple C2 domains and transmembrane region protein (MCTP) family, key regulators of cell-to-cell signalling in plants, act as ER-PM tethers specifically at plasmodesmata. We report that MCTPs are plasmodesmata proteins that insert into the ER via their transmembrane region while their C2 domains dock to the PM through interaction with anionic phospholipids. A Atmctp3/Atmctp4 loss of function mutant induces plant developmental defects, impaired plasmodesmata function and composition, while MCTP4 expression in a yeast Δtether mutant partially restores ER-PM tethering. Our data suggest that MCTPs are unique membrane tethers controlling both ER-PM contacts and cell-to-cell signalling.
Keywords: ER-PM membrane contact sites; intercellular communication in plants; multiple C2 domains and transmembrane region proteins; plasmodesmata.
© 2019 The Authors. Published under the terms of the CC BY 4.0 license.
Conflict of interest statement
The authors declare that they have no conflict of interest.
Figures
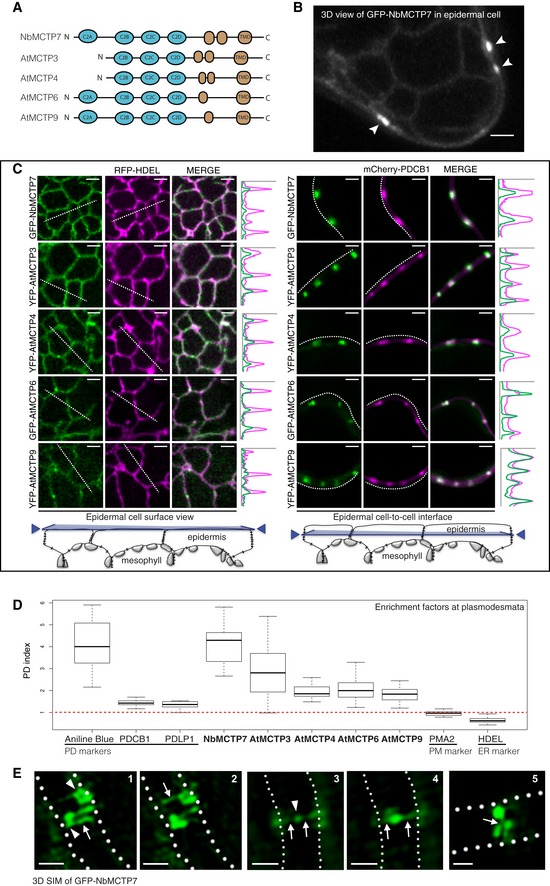
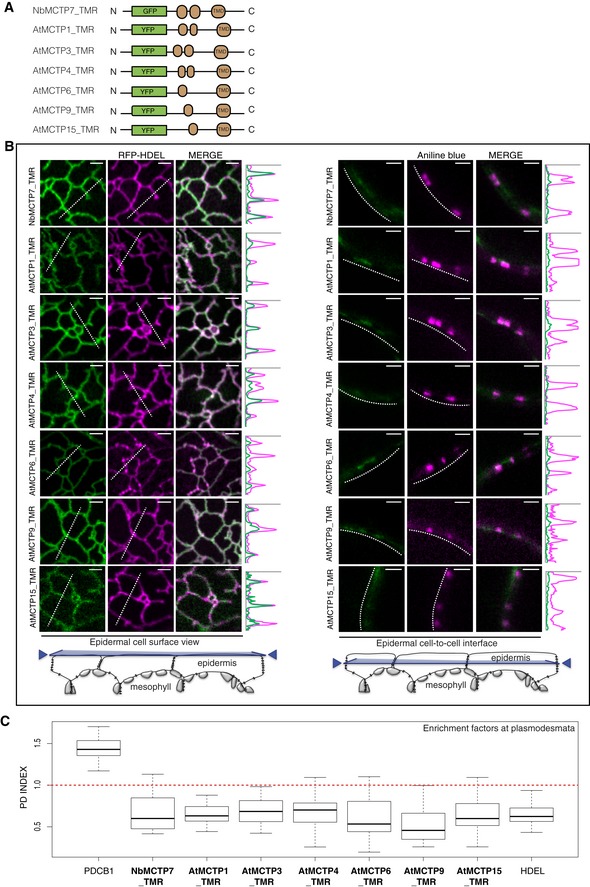
Schematic representation of MCTP domain organisation, with three to four C2 domains at the N‐terminus and multiple transmembrane domains (TMD) at the C‐terminus.
GFP‐NbMCTP7 associates with punctae at the cell periphery (white arrowheads) and labels a reticulated network at the cell surface resembling the cortical ER. Maximum projection of z‐stack. Scale bar, 2 μm.
Single optical sections at cell surface (left) or cell‐to‐cell interface (right), showing the co‐localisation between MCTPs and the ER marker RFP‐HDEL (left) and the plasmodesmata marker mCherry‐PDCB1 (right). Intensity plots along the white dashed lines are shown for each co‐localisation pattern. Scale bars, 2 μm.
The plasmodesmata (PD) index of individual MCTPs is above 1 (red dashed line) and similar to known plasmodesmata markers (aniline blue, PDCB1, PDLP1) confirming enrichment at plasmodesmata. By comparison, the PM‐localised proton pump ATPase PMA2 and the ER marker HDEL that are not enriched at plasmodesmata have a PD index below 1. In the box plot, median is represented by horizontal line, values between quartiles 1 and 3 are represented by box ranges, and minimum and maximum values are represented by error bars. Three biological replicates were analysed.
3D‐SIM images (individual z‐sections) of GFP‐NbMCTP7 within three different pit fields (panels 1‐2, 3‐4 and 5, respectively) showing fluorescence signal continuity throughout the pores, enrichment at plasmodesmal neck regions (1‐2, arrowheads in 1), central cavity (3‐4, arrowhead in 3) and branching at central cavity (5, arrow). Dashed lines indicate position of cell wall borders. Scale bars, 500 nm.
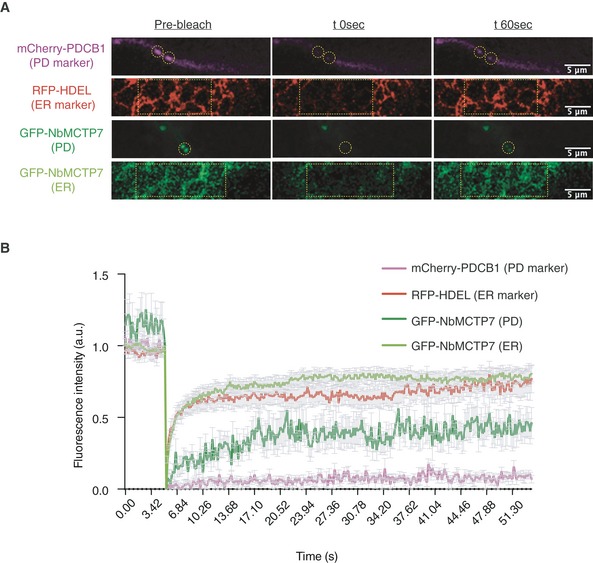
Representative pre‐bleach and post‐bleach images for mCherry‐PDCB1 (purple; plasmodesmata marker), RFP‐HDEL (red; ER marker) and GFP‐NbMCTP7 at plasmodesmata (dark green) and at the cortical ER (light green). Yellow dashed boxes or circles indicate the bleach region.
FRAP comparing the mobility of GFP‐NbMCTP7 at plasmodesmata (dark green) and at the cortical ER (light green) to that of RFP‐HDEL (red) and mCherry‐PDCB1 (purple). NbMCTP7 is highly mobile when associated with the ER as indicated by fast fluorescent recovery but shows reduced mobility when associated with plasmodesmata. Data are averages of at least 3 separate experiments; error bars indicate standard error.
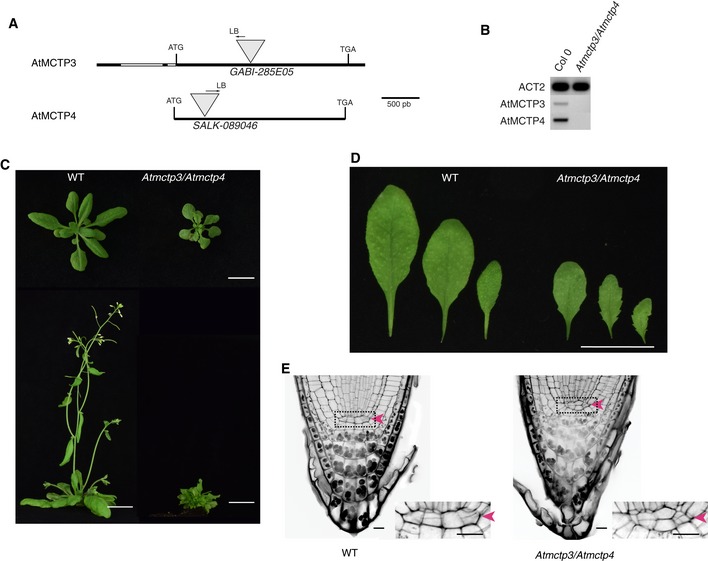
- A–E
Characterisation of Atmctp3/Atmctp4 double mutant in Arabidopsis. (A) Schematic representation of T‐DNA insertions in AtMCTP3 and AtMCTP4. LB, left border. (B) RT–PCR analysis of AtMCTP3, AtMCTP4 and Actin2 (ACT2) transcripts in Col‐0 wild‐type (WT) and Atmctp3/Atmctp4 double mutant showing the absence of full‐length transcripts in the Atmctp3/Atmctp4 double mutant. (C) Rosette and inflorescence stage phenotypes of Atmctp3/Atmctp4 double mutant compared to Col‐0 WT. Scale bar, 2 cm. (D) Leaf phenotypes of Atmctp3/Atmctp4 double mutant compared to WT. Scale bar, 2 cm. (E) Pseudo‐Schiff propidium iodide method‐stained root tips of WT and Atmctp3/Atmctp4 double mutant. Defect in quiescent centre (QC, red arrowheads) cell organisation was observed in 20 out of 20 plants examined. Scale bars, 10 μm.
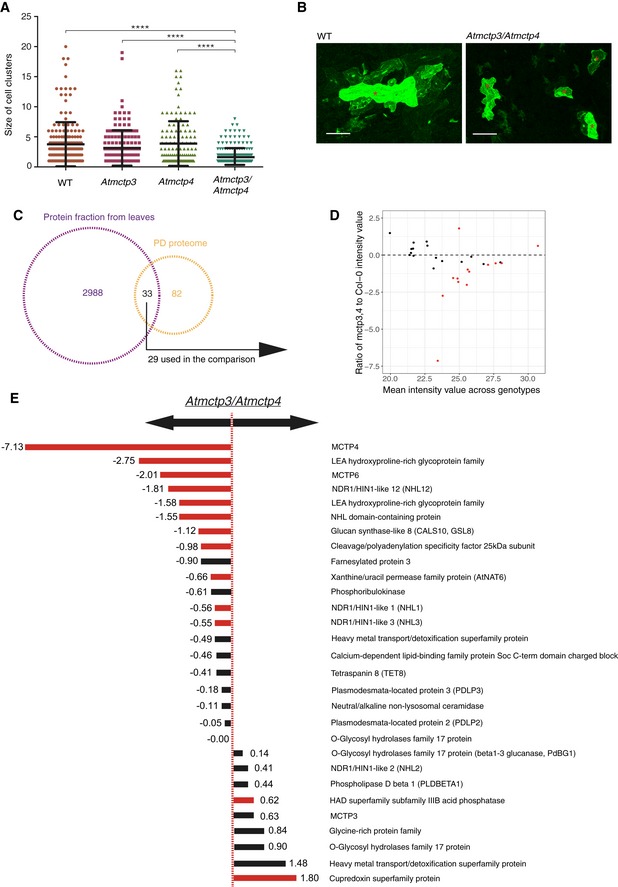
- A, B
Macromolecular trafficking through plasmodesmata is reduced in Atmctp3/Atmctp4 Arabidopsis mutant. Leaves of Col‐0, Atmctp3, Atmctp4 single mutants and Atmctp3/Atmctp4 double mutant were bombarded with a GFP‐sporamin (47 kDa) expression plasmid. Diffusion of GFP‐sporamin to surrounding cells 72 h after bombardment was used as a measure of plasmodesmata molecular trafficking. (A) Scatter plot representation with the black lines representing the mean value (middle) and SD. (B) Representative GFP‐sporamin fluorescent foci observed by confocal microscopy 72 h after bombardment. Bombarded cells are indicated by a red star. n = 50 foci for Col‐0; n = 37 foci for Atmctp3 single mutant; n = 33 foci for Atmctp4 single mutant; and n = 48 foci for Atmctp3/Atmctp4 double mutant (3 biological replicates). Pairwise comparisons by Wilcoxon test, ****P < 0.0001. Scale bar, 100 μm.
- C–E
Comparative proteomic analysis of Atmctp3/Atmctp4 and Col‐0. (C) Intersection between the protein identities obtained from leaf tissue and those in the plasmodesmata proteome (Appendix Table S1). Only proteins appearing in at least 3/5 samples were employed for the comparison (29). (D) Plot of the log2 ratios of the average plasmodesmata protein intensities in Atmctp3/Atmctp4 relative to Col‐0. Dashed line indicates no change (0 = log2(1)), above the line enrichments, below the line depletions. (E) List of plasmodesmata proteins detected in leaf tissue and their ratios of abundance in Atmctp3/Atmctp4 relative to Col‐0. Please note that we detected AtMCTP3 unique peptides at relatively high abundance in the Atmctp3/Atmctp4 mutant. These peptides are located before the T‐DNA insertion, and it is therefore likely that a truncated non‐functional protein is still translated at levels similar to the wild‐type (see Appendix Fig S8). Bars for the proteins whose differential abundance is supported by statistical testing (t‐test with P‐value correction for false discovery rate. P < 0.05) are in red. Bars for other proteins are in black.
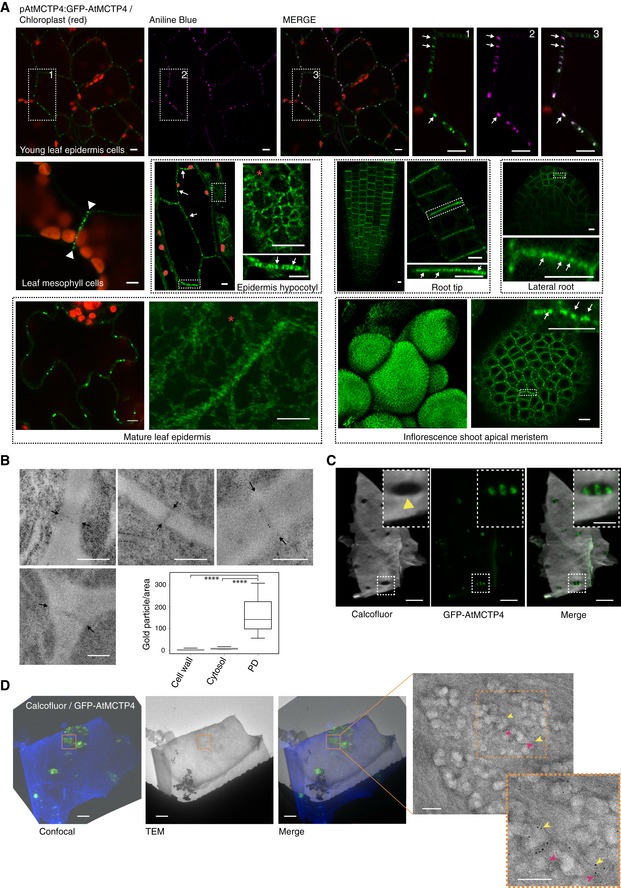
Subcellular localisation of GFP‐AtMCTP4 under AtMCTP4 native promoter in Arabidopsis transgenic lines visualised by confocal microscopy. In all tissues examined, GFP‐MCTP4 shows a typical punctate distribution of plasmodesmata at the cell boundaries (indicated by white arrows). In leaf, spongy mesophyll GFP‐AtMCTP4 punctate pattern was visible only on adjoining walls (arrowheads), which contain plasmodesmata but absent from non‐adjoining walls. GFP‐AtMCTP4 dots at the cell periphery are immobile (see Movie EV2) and co‐localise perfectly with aniline blue (top row) confirming plasmodesmata localisation. In most tissues examined, an ER‐reticulated pattern was also observable (red stars). Boxed regions are magnified in adjacent panels. Please note that the hypocotyl epidermis was imaged in airy scan mode and chloroplasts were manually outlined in red. Scale bars, 5 μm.
Immunogold localisation of GFP‐AtMCTP4 to plasmodesmata. Thin sections of pAtMCTP4:GFP‐AtMCTP4 transgenic Arabidopsis roots subjected to immunogold labelling using anti‐GFP antibodies (5 and 10 nm gold particles). Electron micrographs showing wall sections with plasmodesmata labelled by gold particles. Gold particles were quantified relative to the area occupied by plasmodesmata, cell wall and cytosol, respectively (see Materials and Methods). ****P < 0.001 in pairwise Wilcoxon test (total particles count 298). In the box plot, median is represented by horizontal line, values between quartiles 1 and 3 are represented by box ranges, and minimum and maximum values are represented by error bars. Scale bars, 300 nm
Confocal observation of cell walls purified from pAtMCTP4:GFP‐AtMCTP4. Cell wall was stained with calcofluor, revealing plasmodesmata pit fields where calcofluor staining, hence cellulose, is absent/reduced (yellow arrowhead). GFP‐AtMCTP4 signal is systematically associated with plasmodesmata pit fields (see boxed magnified region and Appendix Fig S10). Scale bars, 5 and 2.5 μm in boxed regions.
CLEM on cell walls purified from pAtMCTP4:GFP‐AtMCTP4 Arabidopsis seedlings combined with immunogold labelling against callose (yellow arrow; 10‐nm gold particles) and PDCB1 protein (magenta arrow; 5‐nm gold particles), two plasmodesmata markers. TEM = transmission electron microscopy. For CLEM, also see Appendix Fig S11. Scale bars, 5 μm for confocal images and 200 nm for TEM images.
Schematic representation of truncated MCTPs tagged with GFP/YFP.
Optical sections at cell surface (left) and cell‐to‐cell interface (right) showing the co‐localisation between GFP/YFP‐MCTP_TMR constructs and the ER marker RFP‐HDEL (left) and the plasmodesmata marker aniline blue (right). Intensity plots along the white dashed lines are shown for each co‐localisation pattern. When expressed in epidermal cells, GFP/YFP‐MCTP_TMR constructs associate with the ER but plasmodesmata association is lost. Scale bars, 2 μm.
The PD index of individual truncated MCTP_TMR constructs is below 1 (red dashed line), similar to the ER marker RFP‐HDEL confirming loss of plasmodesmata localisation. In the box plot, median is represented by horizontal line, values between quartiles 1 and 3 are represented by box ranges, and minimum and maximum values are represented by error bars. Three biological replicates were analysed.
- A
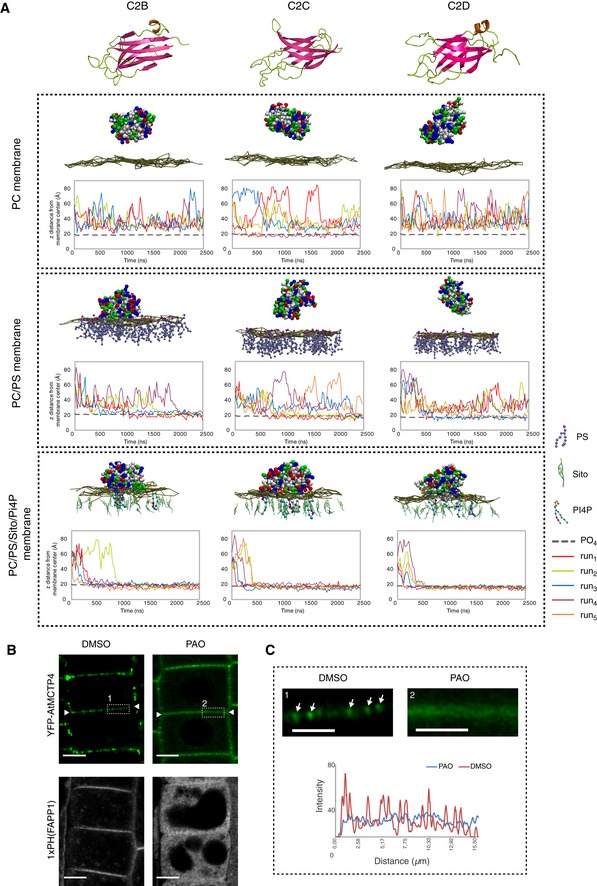
Top: 3D‐atomistic model of the individual AtMCTP4 C2 domains. Beta strands are shown in pink, loops in green and alpha helices in orange. Bottom: molecular dynamics of individual AtMCTP4 C2 domains with different biomimetic lipid bilayer compositions: phosphatidylcholine (PC) alone, with phosphatidylserine (PS) (PC/PS 3:1) and with PS, sitosterol (Sito) and phosphoinositol‐4‐phosphate (PI4P)(PC/PS/Sito/PI4P 57:19:20:4). The plots show the distance between the protein's closest residue to the membrane and the membrane centre, over time. The membrane's phosphate plane is represented by a PO4 grey line on the graphs and a dark green meshwork on the simulation image captures (above graphs). For each individual C2 domain and a given lipid composition, the simulations were repeated four to five times (runs 1–5). C2 membrane docking was only considered as positive when a minimum of four independent repetitions showed similarly stable interaction with the membrane. All C2 domains of AtMCTP4 show membrane interaction when anionic lipid, in particular PI4P, is present. The amino acid colour code is as follows: red, negatively charged (acidic) residues; blue, positively charged (basic) residues; green, polar uncharged residues; and white, hydrophobic residues.
- B, C
Confocal microscopy of Arabidopsis root epidermal cells of UBQ10:YFP‐AtMCTP4 transgenic lines after 40‐min treatment with DMSO (mock) and PAO (60 μM), an inhibitor of PI4 kinase. To confirm PI4P depletion upon PAO treatment, we used the PI4P Arabidopsis sensor line 1xPH(FAPP1) 74. (B) PAO treatment leads to a loss of plasmodesmal punctate signal at the cell periphery (apical–basal boundary is highlighted by white arrowheads in B) for YFP‐AtMCTP4, and redistribution of PM‐localised 1xPH(FAPP1) to the cytoplasm. (C) Magnified boxed regions from (B) and profile plot along the cell wall after DMSO (1) or PAO (2) treatment, respectively (arrows: plasmodesmal punctae). Scale bars, 5 μm in (B) and 2.5 μm in (C).
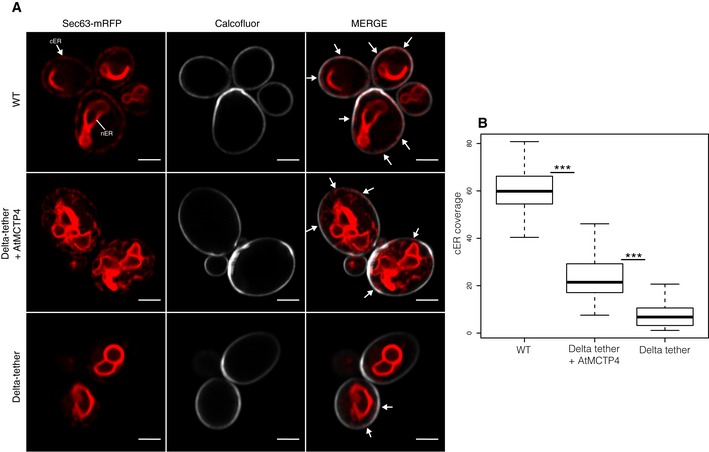
Top to bottom: Wild‐type (WT) cell, Δtether expressing untagged AtMCTP4 and Δtether cells, respectively. The cortical ER (cER) and nuclear ER (nER) are labelled by the ER marker Sec63‐RFP (red), while the cell periphery is stained by calcofluor (white). In WT cells, both nER and cER are visible, whereas in Δtether cell only remains of the cER are visible (arrows), due to the loss of ER‐PM tethering factors. When AtMCTP4 is expressed in the yeast Δtether, partial recovery of cER is observable (arrows). Scale bars, 2 μm.
Quantification of cER expressed as a ratio of the length of cER to length of the PM in WT, Δtether+AtMCTP4 and Δtether cells. Numbers of cells used for quantifying the cER: n = 39 for WT, n = 49 for Δtether+AtMCTP4 and n = 61 for Δtether strains. Wilcoxon test was used to compare the extent of cER between the different strains, i.e. WT versus Δtether+AtMCTP4 and Δtether+AtMCTP4 versus Δtether (***P < 0.001). In the box plot, median is represented by horizontal line, values between quartiles 1 and 3 are represented by box ranges, and minimum and maximum values are represented by error bars.
References
-
- Tilsner J, Nicolas W, Rosado A, Bayer EM (2016) Staying tight: plasmodesmata membrane contact sites and the control of cell‐to‐cell connectivity. Annu Rev Plant Biol 67: 337–364 - PubMed
-
- Gallagher KL, Sozzani R, Lee C‐M (2014) Intercellular protein movement: deciphering the language of development. Annu Rev Cell Dev Biol 30: 207–233 - PubMed
-
- Vatén A, Dettmer J, Wu S, Stierhof YD, Miyashima S, Yadav SR, Roberts CJ, Campilho A, Bulone V, Lichtenberger R et al (2011) Callose biosynthesis regulates symplastic trafficking during root development. Dev Cell 21: 1144–1155 - PubMed
Publication types
MeSH terms
Substances
Grants and funding
- 772103-BRIDGING/EC|H2020|H2020 Priority Excellent Science|H2020 European Research Council (ERC)/International
- OSEZ-2017-BRIDGING/Centre National de la Recherche Scientifique (CNRS)/International
- ANR-14-CE19-0006-01/Agence Nationale de la Recherche (ANR)/International
- 1.E.096.18/FNRS|Fonds pour la Formation à la Recherche dans l'Industrie et dans l'Agriculture (FRIA)/International
- NEAMEMB PDR T.1003.14/Fonds De La Recherche Scientifique - FNRS (FNRS)/International
LinkOut - more resources
Full Text Sources
Other Literature Sources
Molecular Biology Databases
Research Materials
Miscellaneous
