

An information network flow approach for measuring functional connectivity and predicting behavior
- PMID: 31286688
- PMCID: PMC6710195
- DOI: 10.1002/brb3.1346
An information network flow approach for measuring functional connectivity and predicting behavior
Abstract
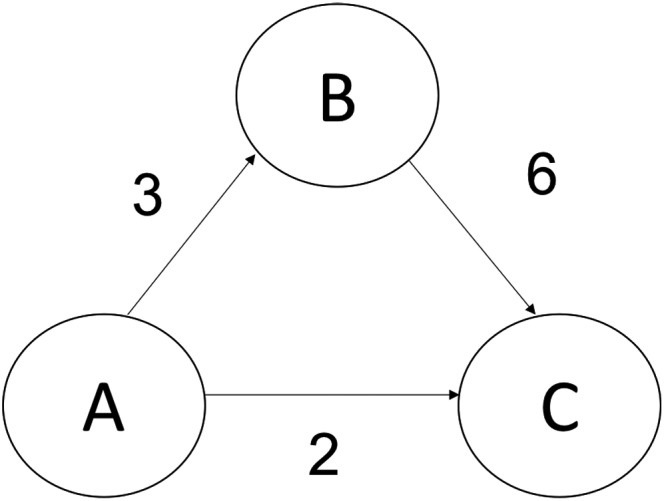
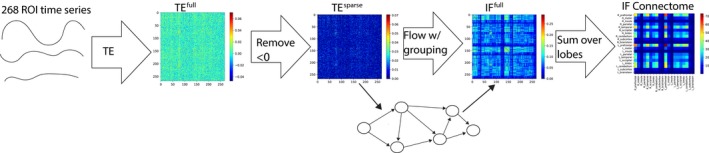
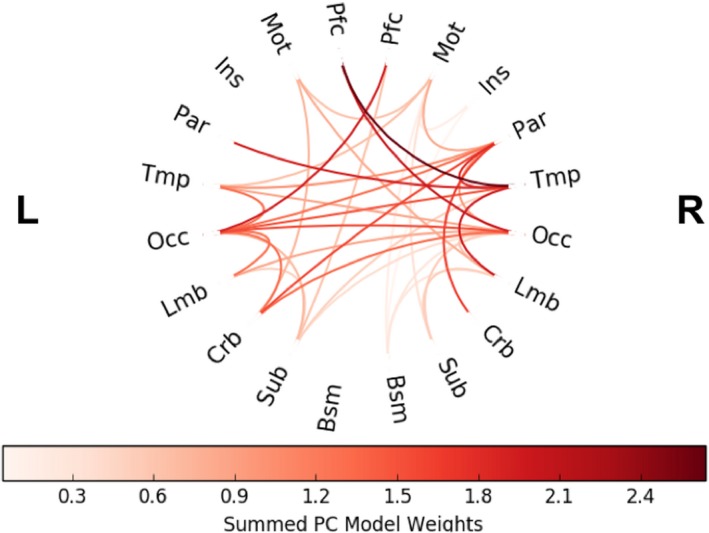
Introduction: Connectome-based predictive modeling (CPM) is a recently developed machine-learning-based framework to predict individual differences in behavior from functional brain connectivity (FC). In these models, FC was operationalized as Pearson's correlation between brain regions' fMRI time courses. However, Pearson's correlation is limited since it only captures linear relationships. We developed a more generalized metric of FC based on information flow. This measure represents FC by abstracting the brain as a flow network of nodes that send bits of information to each other, where bits are quantified through an information theory statistic called transfer entropy.
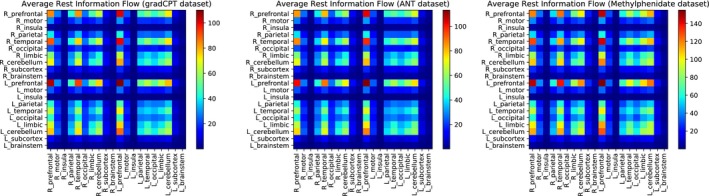
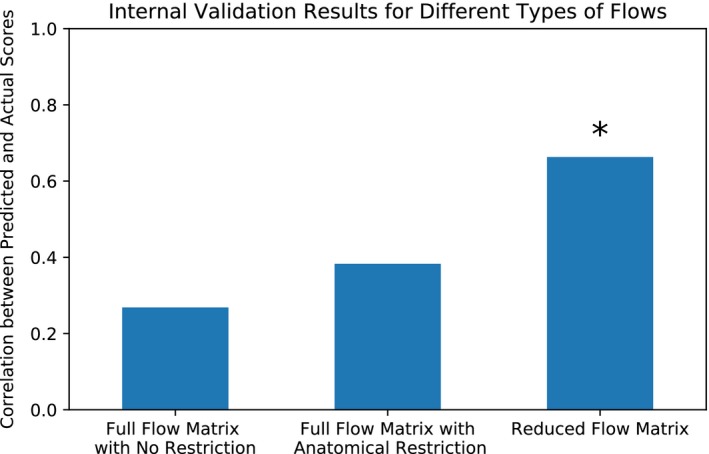
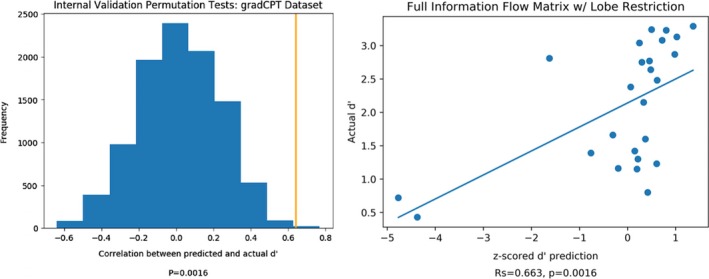
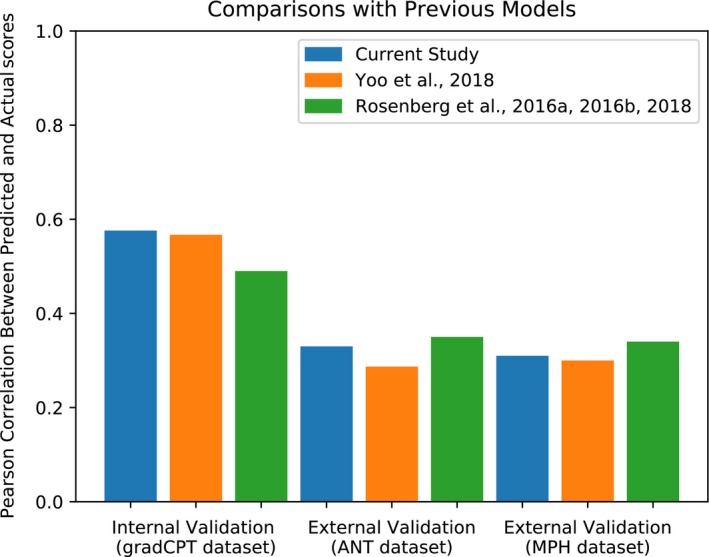
Methods: With a sample of individuals performing a sustained attention task and resting during functional magnetic resonance imaging (fMRI) (n = 25), we use the CPM framework to build machine-learning models that predict attention from FC patterns measured with information flow. Models trained on n - 1 participants' task-based patterns were applied to an unseen individual's resting-state pattern to predict task performance. For further validation, we applied our model to two independent datasets that included resting-state fMRI data and a measure of attention (Attention Network Task performance [n = 41] and stop-signal task performance [n = 72]).
Results: Our model significantly predicted individual differences in attention task performance across three different datasets.
Conclusions: Information flow may be a useful complement to Pearson's correlation as a measure of FC because of its advantages for nonlinear analysis and network structure characterization.
Keywords: functional connectivity; information flow; predictive model; resting-state fMRI connectivity; sustained attention.
© 2019 The Authors. Brain and Behavior published by Wiley Periodicals, Inc.
Conflict of interest statement
The authors declare no competing financial interests.
Figures


Similar articles
-
Connectome-based predictive modeling of attention: Comparing different functional connectivity features and prediction methods across datasets.Neuroimage. 2018 Feb 15;167:11-22. doi: 10.1016/j.neuroimage.2017.11.010. Epub 2017 Nov 6. Neuroimage. 2018. PMID: 29122720 Free PMC article.
-
Dynamic functional connectivity during task performance and rest predicts individual differences in attention across studies.Neuroimage. 2019 Mar;188:14-25. doi: 10.1016/j.neuroimage.2018.11.057. Epub 2018 Dec 3. Neuroimage. 2019. PMID: 30521950 Free PMC article.
-
Network and state specificity in connectivity-based predictions of individual behavior.Hum Brain Mapp. 2024 Jun 1;45(8):e26753. doi: 10.1002/hbm.26753. Hum Brain Mapp. 2024. PMID: 38864353 Free PMC article.
-
A functional connectivity-based neuromarker of sustained attention generalizes to predict recall in a reading task.Neuroimage. 2018 Feb 1;166:99-109. doi: 10.1016/j.neuroimage.2017.10.019. Epub 2017 Oct 12. Neuroimage. 2018. PMID: 29031531 Free PMC article.
-
Neuroimaging of individual differences: A latent variable modeling perspective.Neurosci Biobehav Rev. 2019 Mar;98:29-46. doi: 10.1016/j.neubiorev.2018.12.022. Epub 2019 Jan 3. Neurosci Biobehav Rev. 2019. PMID: 30611798 Free PMC article. Review.
Cited by
-
Between-module functional connectivity of the salient ventral attention network and dorsal attention network is associated with motor inhibition.PLoS One. 2020 Dec 3;15(12):e0242985. doi: 10.1371/journal.pone.0242985. eCollection 2020. PLoS One. 2020. PMID: 33270664 Free PMC article.
-
Drinking severity mediates the relationship between hypothalamic connectivity and rule-breaking/intrusive behavior differently in young women and men: an exploratory study.Quant Imaging Med Surg. 2024 Sep 1;14(9):6669-6683. doi: 10.21037/qims-24-815. Epub 2024 Aug 26. Quant Imaging Med Surg. 2024. PMID: 39281112 Free PMC article.
-
Dementia ConnEEGtome: Towards multicentric harmonization of EEG connectivity in neurodegeneration.Int J Psychophysiol. 2022 Feb;172:24-38. doi: 10.1016/j.ijpsycho.2021.12.008. Epub 2021 Dec 27. Int J Psychophysiol. 2022. PMID: 34968581 Free PMC article. Review.
-
Network connectivity predicts language processing in healthy adults.Hum Brain Mapp. 2020 Sep;41(13):3696-3708. doi: 10.1002/hbm.25042. Epub 2020 May 25. Hum Brain Mapp. 2020. PMID: 32449559 Free PMC article.
-
The challenges and prospects of brain-based prediction of behaviour.Nat Hum Behav. 2023 Aug;7(8):1255-1264. doi: 10.1038/s41562-023-01670-1. Epub 2023 Jul 31. Nat Hum Behav. 2023. PMID: 37524932 Review.
References
-
- Ahuja, R. K. , Magnanti, T. L. , & Orlin, J. B. (2014). Network flows theory, algorithms and applications. Harlow, London, UK: Paerson Education.
-
- Deligianni, F. , Robinson, E. , Beckmann, C. F. , Sharp, D. , Edwards, A. D. , & Rueckert, D. (2011). Inference of functional connectivity from direct and indirect structural brain connections. In 2011 IEEE International Symposium on Biomedical Imaging: From Nano to Macro (pp. 849–852). IEEE.
Publication types
MeSH terms
Grants and funding
LinkOut - more resources
Full Text Sources
