. 2019 Jul 8;16(1):138.
doi: 10.1186/s12974-019-1533-1.

STAT3 activation in circulating myeloid-derived cells contributes to retinal microvascular dysfunction in diabetes

Affiliations

STAT3 activation in circulating myeloid-derived cells contributes to retinal microvascular dysfunction in diabetes

Mei Chen et al. J Neuroinflammation. .

Abstract

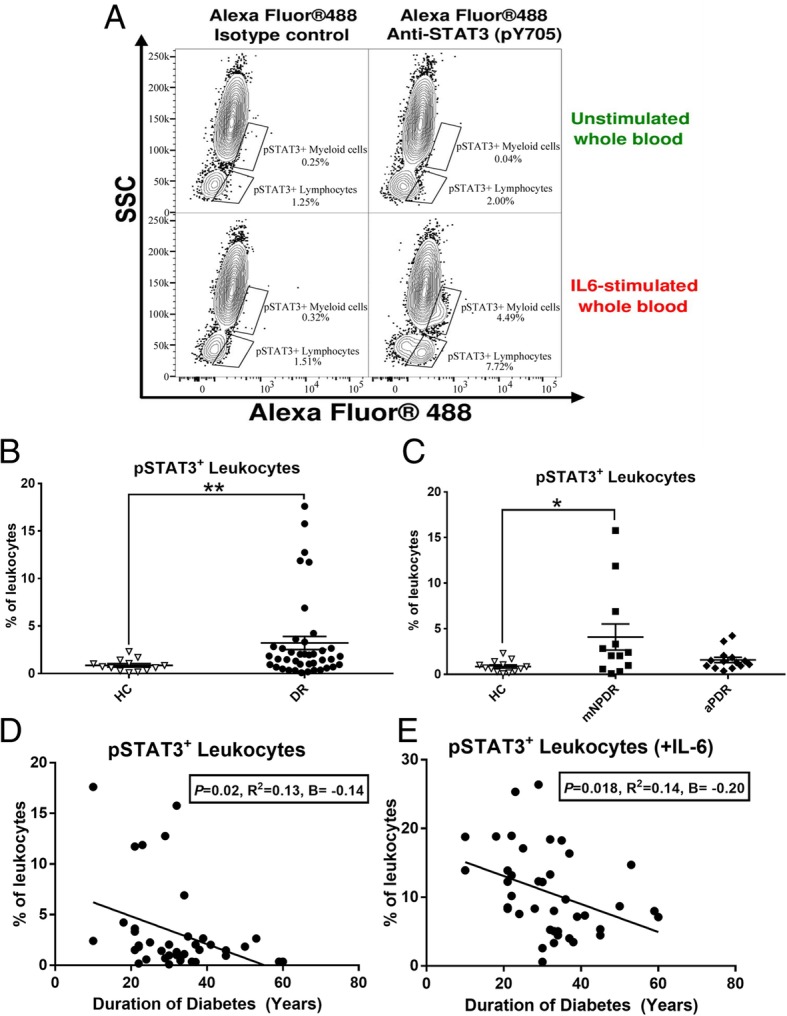
Background: Leukostasis is a key patho-physiological event responsible for capillary occlusion in diabetic retinopathy. Circulating monocytes are the main cell type entrapped in retinal vessels in diabetes. In this study, we investigated the role of the signal transducer and activator of transcription 3 (STAT3) pathway in diabetes-induced immune cell activation and its contribution to retinal microvascular degeneration.

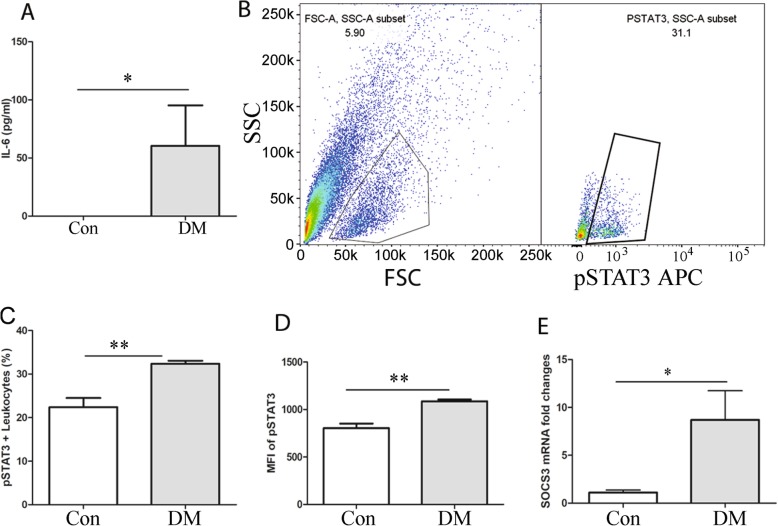
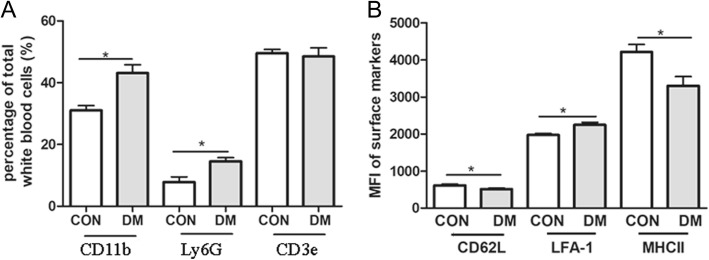
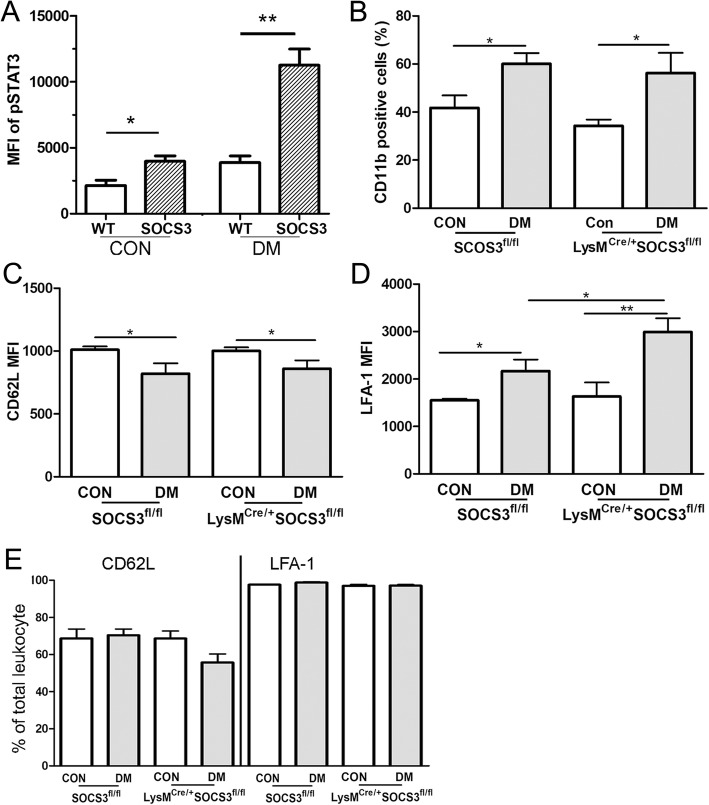
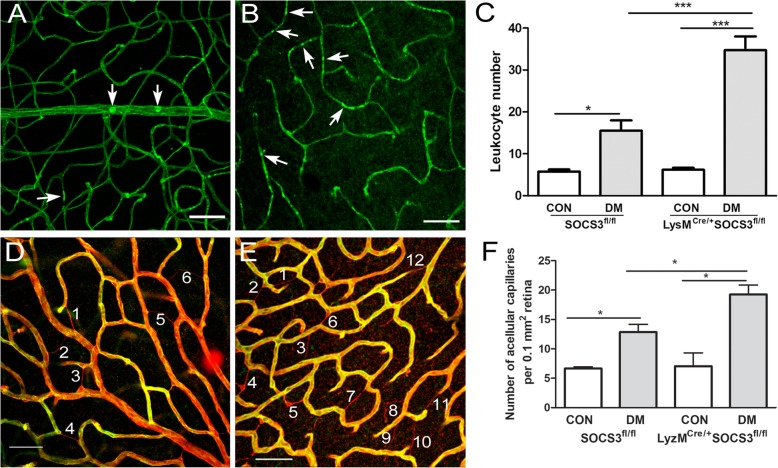
Methods: Forty-one patients with type 1 diabetes (T1D) [mild non-proliferative diabetic retinopathy (mNPDR) (n = 13), active proliferative DR (aPDR) (n = 14), inactive PDR (iPDR) (n = 14)] and 13 age- and gender-matched healthy controls were recruited to the study. C57BL/6 J WT mice, SOCS3fl/fl and LysMCre/+SOCS3fl/fl mice were rendered diabetic by Streptozotocin injection. The expression of the phosphorylated human and mouse STAT3 (pSTAT3), mouse LFA-1, CD62L, CD11b and MHC-II in circulating immune cells was evaluated by flow cytometry. The expression of suppressor of cytokine signalling 3 (SOCS3) was examined by real-time RT-PCR. Mouse plasma levels of cytokines were measured by Cytometric Beads Array assay. Retinal leukostasis was examined following FITC-Concanavalin A perfusion and acellular capillary was examined following Isolectin B4 and Collagen IV staining.

Results: Compared to healthy controls, the expression of pSTAT3 in circulating leukocytes was statistically significantly higher in mNPDR but not aPDR and was negatively correlated with diabetes duration. The expression of pSTAT3 and its inhibitor SOCS3 was also significantly increased in leukocytes from diabetic mice. Diabetic mice had higher plasma levels of IL6 and CCL2 compared with control mice. LysMCre/+SOCS3fl/fl mice and SOCS3fl/fl mice developed comparative levels of diabetes, but leukocyte activation, retinal leukostasis and number of acellular capillaries were statistically significantly increased in LysMCre/+SOCS3fl/fl diabetic mice.

Conclusion: STAT3 activation in circulating immune cells appears to contribute to retinal microvascular degeneration and may be involved in DR initiation in T1D.

Keywords: Diabetic retinopathy; Inflammation; Monocytes; SOCS3.


Conflict of interest statement

The authors declare that they have no competing interests.

Figures

Fig. 1
Fig. 1
pSTAT3 expression in circulating lekocytes from diabetes patients. a Representative image showing gating strategy (Alexa Fluor 488 vs SSC) used to elucidate pSTAT3 expression on peripheral whole blood with/without IL-6 stimulation alongside either Alexa Fluor 488-conjugated Isotype control or anti-STAT3 (pY705) staining. b The percentage of total pSTAT3+ circulating leukocytes in unstimulated whole blood of all T1D patients (n = 39) compared with healthy control (n = 13). c The percentage of total pSTAT3+ circulating leukocytes in unstimulated whole blood of health control (n = 13), mNPDR (n = 13) and aPDR (n = 14). d, e Correlation of T1D duration against percentages of circulating pSTAT3+ leukocytes without IL-6 stimulation (d) and with 20 min IL-6 stimulation (e). The B values (regression coefficient) reported in d, e are changes in pSTAT3 expression associated with a unit (1 year) increase in T1D duration. The R2 is the magnitude correlation coefficient between T1D duration and pSTAT3 expression. b, c Data are presented as mean ± SEM. b independent sample T test. c One-way ANOVA with Tukey’s post-hoc test. *p < 0.05; **p < 0.01. d, e Linear regression, line on each graph is regression line. n = 40
Fig. 2
Fig. 2
Activation of the IL-6-STAT3-SOCS3 pathway in circulating leukocytes. a Plasma cytokine IL-6 in non-diabetic (CON, n = 7) and STZ-induced diabetic mice (DM, n = 13). b The gating strategy to identify pSTAT3+ leukocyte by flow cytometry. FSC and SSC were used to identify blood leukocytes. pSTAT3+ leukocytes were then identified. c The percentage of pSTAT3+ leukocytes in non-diabetic (CON, n = 5) and diabetic mice (3-month diabetes duration, n = 4) after IL-6 stimulation. d The mean fluorescent intensity (MFI) of pSTAT3 in circulating leukocytes from control (n = 5) and diabetic mice (3-month diabetes duration, n = 4) after 40 min IL-6 stimulation. e mRNA level of SOCS3 in circulating leukocytes in control (n = 4) and diabetic mice (n = 8). Data were presented as mean ± SEM. a Mann-Whitney test, ce Student t test. *p < 0.05; **p < 0.01
Fig. 3
Fig. 3
Activation of circulating leukocytes in diabetic mice. a FACS analysis shows that CD11b+ myeloid cells, Ly6G+ neutrophils and CD3+ T cells in control (n = 4) and diabetic mice (with 3-month diabetes duration, n = 5). b The mean fluorescence intensity (MFI) of CD62L, LFA-1 and MHC II in circulating CD11b+ myeloid cells from healthy control (n = 6) and diabetic mice (n = 13). Data were presented as mean ± SEM. Student t test, * < 0.05
Fig. 4
Fig. 4
Myeloid cell activation in LysMCre/+SOCS3fl/fl diabetic mice. a Fresh blood were collected from WT and LysMCre/+SOCS3fl/fl mice without or with 3-month diabetes and treated with IL-6 for 40 min. pSTAT3 expression was the examined by flow cytometry. Data showing are mean fluorescent intensity (MFI) of pSTAT3 in circulating leukocytes from WT and LysMCre/+SOCS3fl/fl mice with and without diabetes. Student t test, *p < 0.05. b The percentage of CD11b+ cells in SOCS3fl/fl and LysMCre/+ SOCS3fl/fl mice with and without 3-month diabetes. c, d The mean fluorescent intensity (MFI) of CD62L (c) and LFA (d) in circulating leukocytes in SOCS3fl/fl and LysMCre/+ SOCS3fl/fl mice with and without diabetes. e Percentage of CD62L+ and LFA-1+ leukocytes in SOCS3fl/fl and LysMCre/+ SOCS3fl/fl mice with and without diabetes. n = 4~ 6 per group. Data were presented as mean ± SEM. Two-way ANOVA followed by Bonferroni test. *p < 0.05; **p < 0.01
Fig. 5
Fig. 5
Increased leukostasis and avascular capillaries in LysMCre/+SOCS3fl/fl diabetic mice. ac Retinal leukostasis was evaluated by Con-A perfusion in SOCS3fl/fl and LysMCre/+SOCS3fl/fl mice with/without 2-months diabetes and examined by confocal microscopy. a, b Representative confocal images of retinal flatmount showing entrapped leukocytes (arrows) in diabetic SOCS3fl/fl (a) and LysMCre/+ SOCS3fl/fl (b). c Bar figure showing the number of entrapped leukocytes in SOCS3fl/fl and LysMCre/+SOCS3fl/fl mice. df Acellular capillary was examined by confocal microscopy of collagen IV (red) and Isolectin B4 (green) stained retinal flatmounts from in SOCS3fl/fl and LysMCre/+SOCS3fl/fl mice with/without 6-month diabetes. Representative confocal images of retina flatmount stained with collagen IV (Red) and Isolectin B4 (green) in diabetic SOCS3fl/fl (d) and LysMCre/+SOCS3fl/fl (e) mice. Acellular capillaries are positive for collagen IV but negative for Isolectin B4 (numbered). f Bar figure showing the quantification of acellular capillaries. Data were presented as mean ± SEM. N > 6 per group. Two-way ANOVA followed by Bonferroni test. CON: non-diabetes, DM: diabetes. *p < 0.05; ***p < 0.001

Similar articles

Cited by

References

    1. Tang J, Kern TS. Inflammation in diabetic retinopathy. Prog Retin Eye Res. 2011;30(5):343–358. - PMC - PubMed
    1. Xu H, Chen M. Diabetic retinopathy and dysregulated innate immunity. Vis Res. 2017;139:39–46. - PubMed
    1. Xu H, Chen M, Forrester JV. Para-inflammation in the aging retina. Prog Retin Eye Res. 2009;28(5):348–368. - PubMed
    1. Miyake K, Kaisho T. Homeostatic inflammation in innate immunity. Curr Opin Immunol. 2014;30:85–90. - PubMed
    1. Chan JK, Roth J, Oppenheim JJ, Tracey KJ, Vogl T, Feldmann M, et al. Alarmins: awaiting a clinical response. J Clin Invest. 2012;122(8):2711–2719. - PMC - PubMed

Substances