Randomized Controlled Trial
. 2019 Sep;101(3):617-627.
doi: 10.4269/ajtmh.19-0193.

Persistent Hotspots in Schistosomiasis Consortium for Operational Research and Evaluation Studies for Gaining and Sustaining Control of Schistosomiasis after Four Years of Mass Drug Administration of Praziquantel

Affiliations
Randomized Controlled Trial

Persistent Hotspots in Schistosomiasis Consortium for Operational Research and Evaluation Studies for Gaining and Sustaining Control of Schistosomiasis after Four Years of Mass Drug Administration of Praziquantel

Nupur Kittur et al. Am J Trop Med Hyg. 2019 Sep.

Abstract

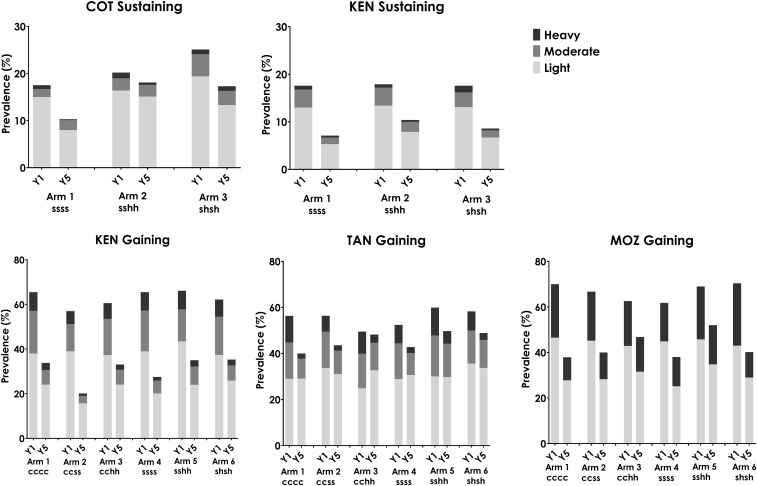
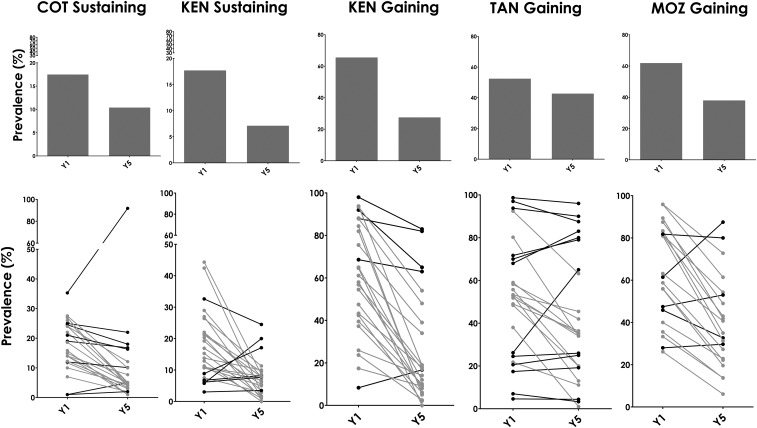
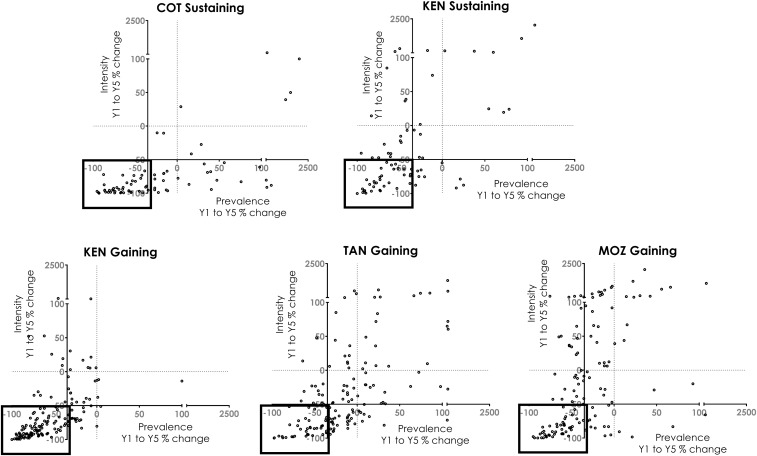
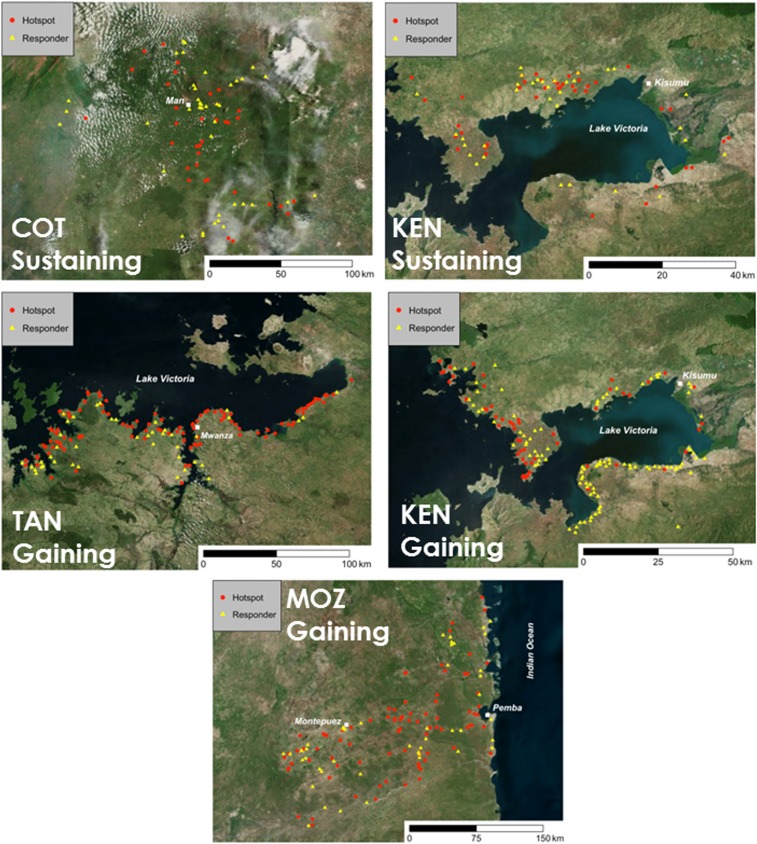
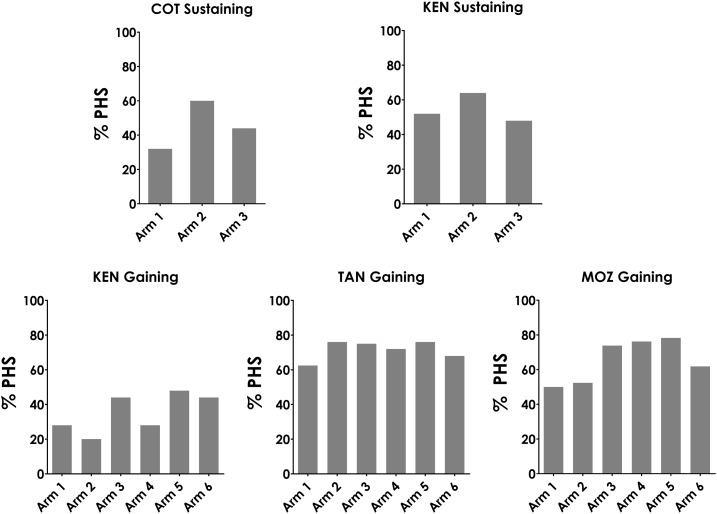
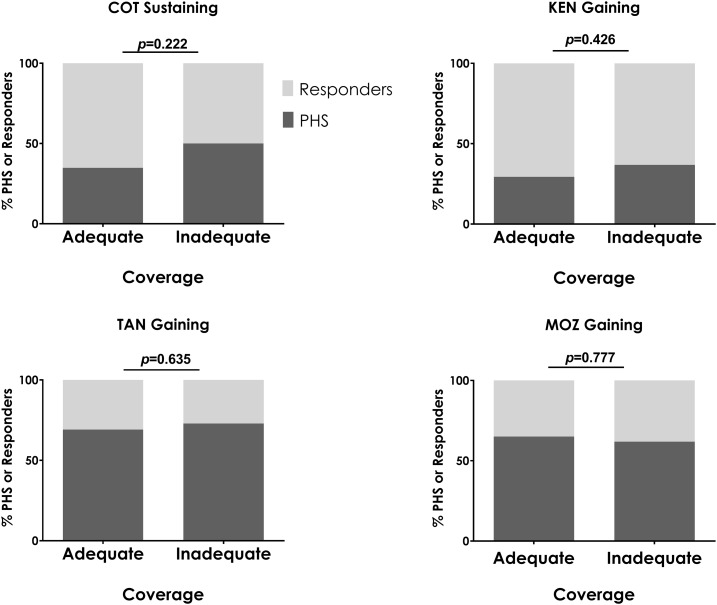
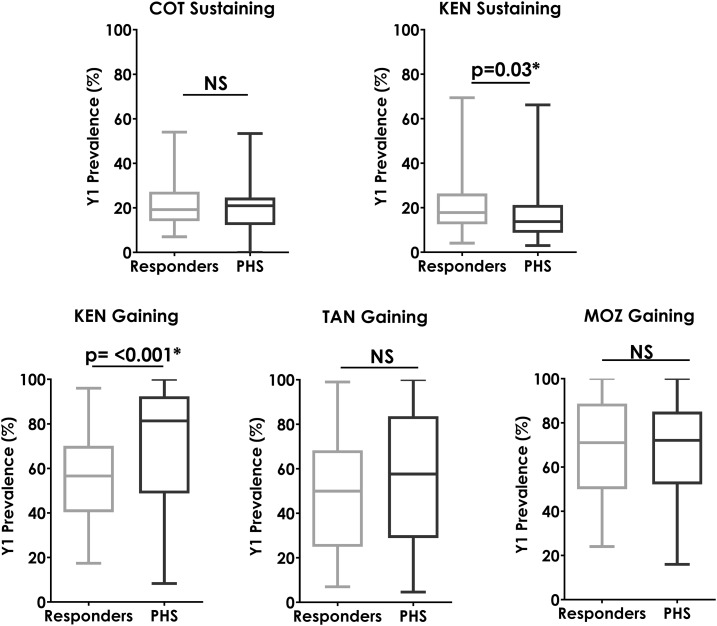
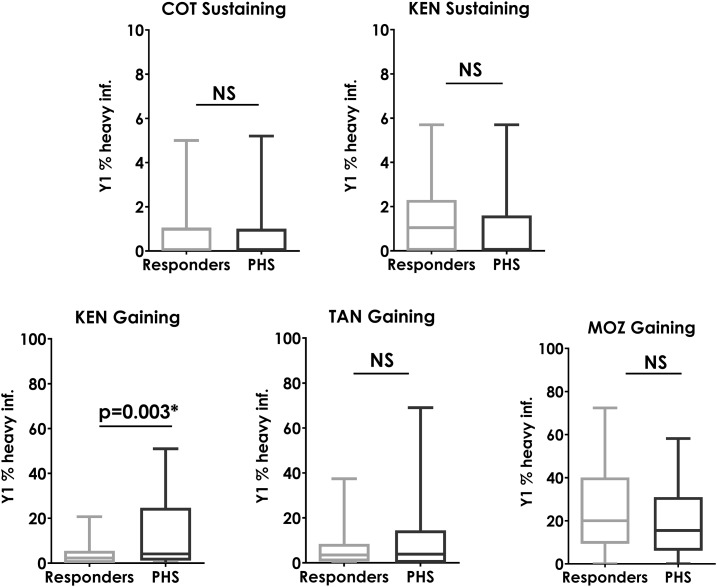
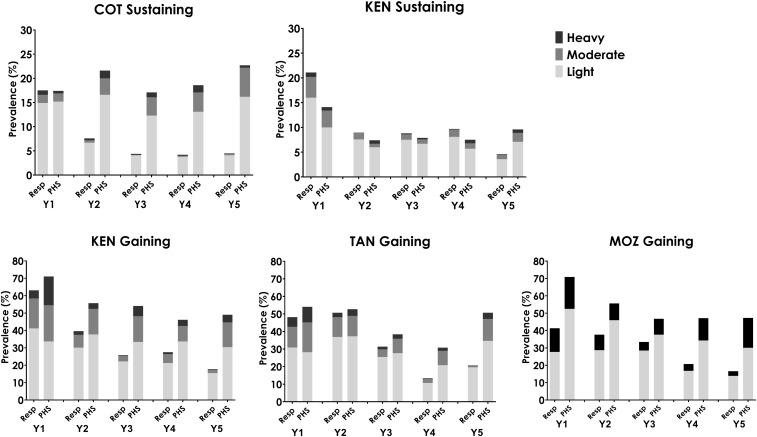
Control of schistosomiasis presently relies largely on preventive chemotherapy with praziquantel through mass drug administration (MDA) programs. The Schistosomiasis Consortium for Operational Research and Evaluation has concluded five studies in four countries (Côte d'Ivoire, Kenya, Mozambique, and Tanzania) to evaluate alternative approaches to MDA. Studies involved four intervention years, with final evaluation in the fifth year. Mass drug administration given annually or twice over 4 years reduced average prevalence and intensity of schistosome infections, but not all villages that were treated in the same way responded similarly. There are multiple ways by which responsiveness to MDA, or the lack thereof, could be measured. In the analyses presented here, we defined persistent hotspots (PHS) as villages that achieved less than 35% reduction in prevalence and/or less than 50% reduction in infection intensity after 4 years of either school-based or community-wide MDA, either annually or twice in 4 years. By this definition, at least 30% of villages in each of the five studies were PHSs. We found no consistent relationship between PHSs and the type or frequency of intervention, adequacy of reported MDA coverage, and prevalence or intensity of infection at baseline. New research is warranted to identify PHSs after just one or a few rounds of MDA, and new adaptive strategies need to be advanced and validated for turning PHSs into responder villages.


Figures

Figure 1.
Figure 1.
Prevalence by infection intensity category in five Schistosomiasis Consortium for Operational Research and Evaluation studies, by study arm. Data from baseline year (Y1) and final survey (Y5) are shown. In study arm notations, c refers to community-wide treatment, s refers to school-based treatment, and h refers to drug holiday year. χ2 P-value is < 0.05 for comparisons of Y1 and Y5 in all arms of all studies. COT = Côte d’Ivoire; KEN = Kenya; MOZ = Mozambique; TAN = Tanzania.
Figure 2.
Figure 2.
(Top) Mean prevalence at baseline (Y1) and final survey (Y5) in study arms that received 4 years of annual school-based treatment and (bottom) line graphs showing changes in prevalence in individual villages in the same respective study arms. Gray lines depict villages that showed ≥ 35% reduction in prevalence (responders), whereas black lines depict villages with < 35% reduction in prevalence from baseline to year 5 (persistent hotspots based on change in prevalence). COT = Côte d’Ivoire; KEN = Kenya; MOZ = Mozambique; TAN = Tanzania.
Figure 3.
Figure 3.
Percent change in prevalence and intensity from baseline (Y1) to final (Y5) survey in individual villages in Schistosomiasis Consortium for Operational Research and Evaluation studies. Each point depicts a study village. The x axis shows percent change in prevalence and the y axis shows percent change in intensity. Dotted lines are set at x = 0 and y = 0. The solid lines show the cutoffs for our definition of persistent hotspots (PHSs): Thirty-five percentage reduction in prevalence and 50% reduction in intensity. Dots in the box indicate responding villages, whereas all others are classified as PHSs on the basis of prevalence, intensity, or both. COT = Côte d’Ivoire; KEN = Kenya; MOZ = Mozambique; TAN = Tanzania.
Figure 4.
Figure 4.
Geographical distribution of persistent hotspots (red circles) and responding villages (yellow triangles) in study areas. Major cities and water bodies are indicated. COT = Côte d’Ivoire; KEN = Kenya; MOZ = Mozambique; TAN = Tanzania. This figure appears in color at www.ajtmh.org.
Figure 5.
Figure 5.
Percent of study villages in each study arm that met the prevalence and intensity definition for persistent hotspots (PHSs) in year 5. COT = Côte d’Ivoire; KEN = Kenya; MOZ = Mozambique; TAN = Tanzania.
Figure 6.
Figure 6.
Comparison of proportion of persistent hotspots (PHSs) in villages that had adequate mass drug administration (MDA) coverage throughout the study versus villages that failed to have adequate coverage during one or more MDA. χ2 P-value is indicated. The Kenya sustaining control study is not included because all villages achieved adequate coverage. COT = Côte d’Ivoire; KEN = Kenya; MOZ = Mozambique; TAN = Tanzania.
Figure 7.
Figure 7.
Box plots showing baseline (Y1) prevalence in villages that were responders and those that were persistent hotspots (PHSs) at the end of the study (Y5). Mann–Whitney U-test P-values are indicated. COT = Côte d’Ivoire; KEN = Kenya; MOZ = Mozambique; TAN = Tanzania.
Figure 8.
Figure 8.
Box plots showing baseline (Y1) prevalence of heavy infections in villages that were responders and those that were persistent hotspots (PHSs) at Y5. Mann–Whitney U-test P-values are indicated. COT = Côte d’Ivoire; KEN = Kenya; MOZ = Mozambique; NS = not significant; TAN = Tanzania (P > 0.05).
Figure 9.
Figure 9.
Prevalence and intensity categories for every study year among villages in study arms that received four annual school-based treatments across the 5 years for Schistosomiasis Consortium for Operational Research and Evaluation studies of sustaining and gaining control, stratified into responding villages (Resp) and persistent hotspots (PHSs). COT = Côte d’Ivoire; KEN = Kenya; MOZ = Mozambique; TAN = Tanzania.

References

    1. World Health Organization , 2001. Fifty-Fourth World Health Assembly Resolution WHA54.19 Schistosomiasis and Soil-Transmitted Helminth Infections. Geneva, Switzerland: World Health Organization Fifty-Fourth World Health Assembly.
    1. World Health Organization , 2012. Sixty-Fifth World Health Assembly Resolution WHA65.21 Elimination of Schistosomiasis. Geneva, Switzerland: World Health Organization Sixty-Fifth World Health Assembly.
    1. World Health Organization , 2013. Sixty-Sixth World Health Assembly Resolution WHA66.12 Neglected Tropical Diseases. Geneva, Switzerland: World Health Organization Sixty-Sixth World Health Assembly.
    1. Colley DG, Bustinduy AL, Secor WE, King CH, 2014. Human schistosomiasis. Lancet 383: 2253–2264. - PMC - PubMed
    1. French MD, et al. 2018. Schistosomiasis in Africa: improving strategies for long-term and sustainable morbidity control. PLoS Negl Trop Dis 12: e0006484. - PMC - PubMed

Publication types

LinkOut - more resources