. 2019 Jul 9:8:e44452.
doi: 10.7554/eLife.44452.

Autophagy regulates inflammatory programmed cell death via turnover of RHIM-domain proteins

Affiliations

Autophagy regulates inflammatory programmed cell death via turnover of RHIM-domain proteins

Junghyun Lim et al. Elife. .

Abstract

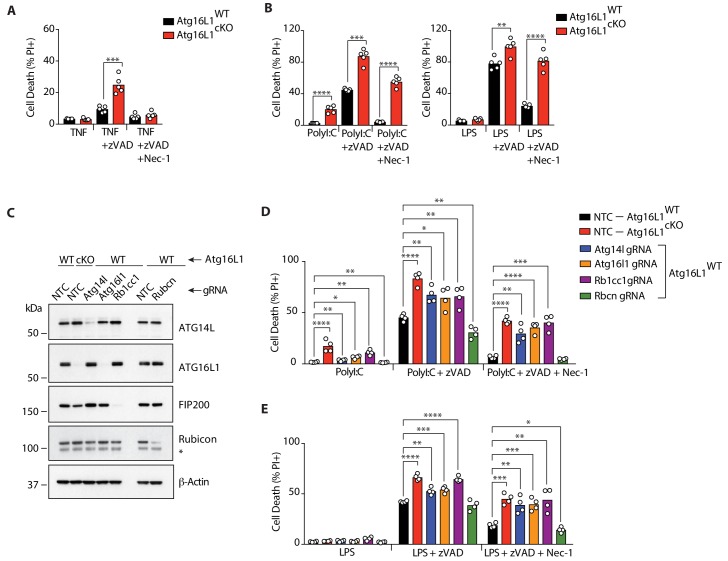
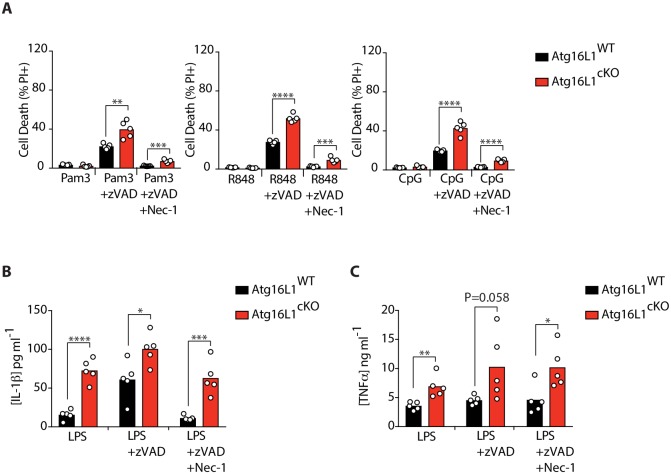
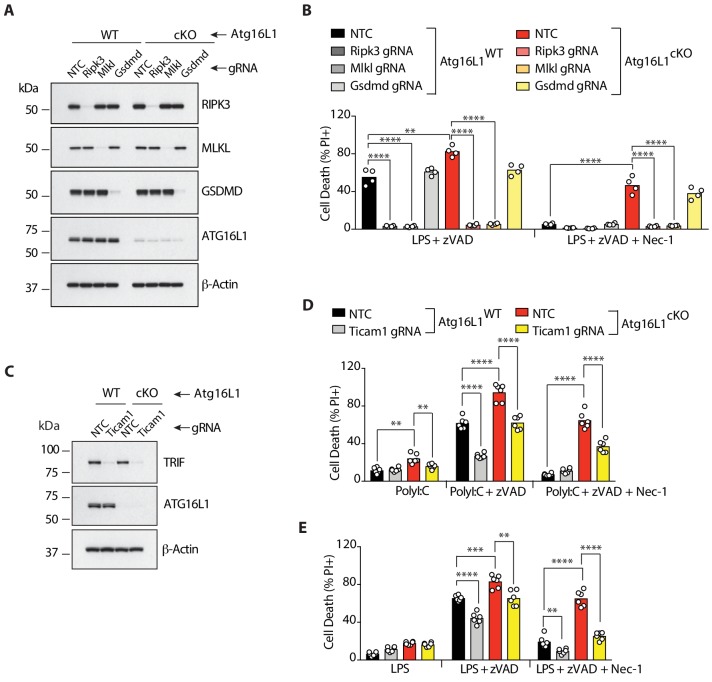
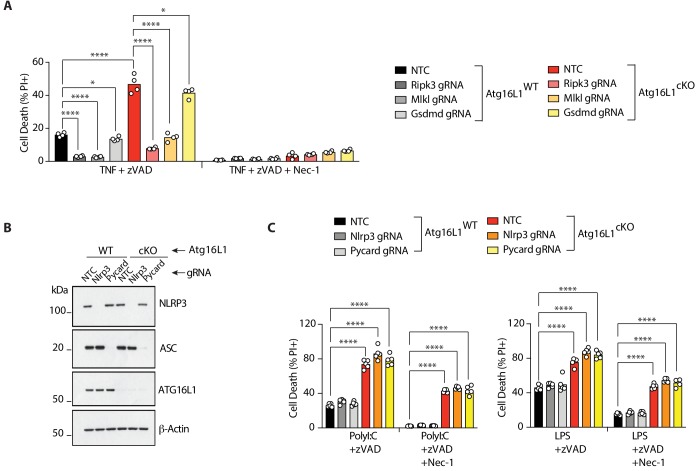
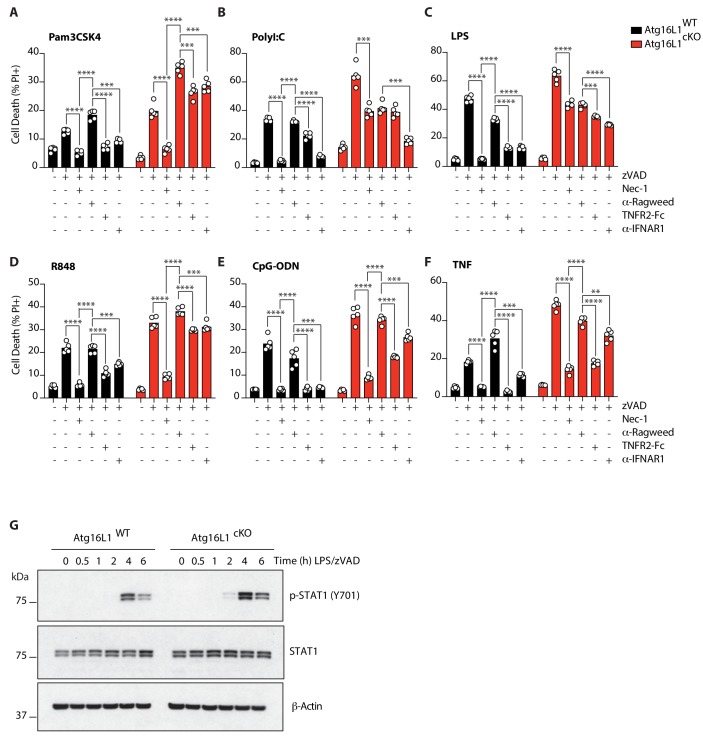
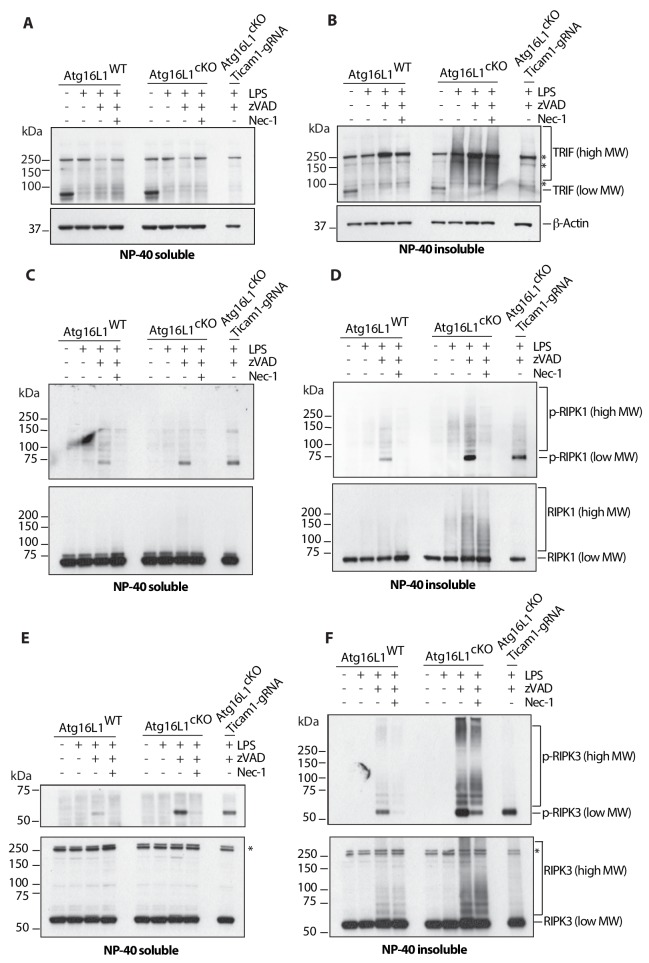
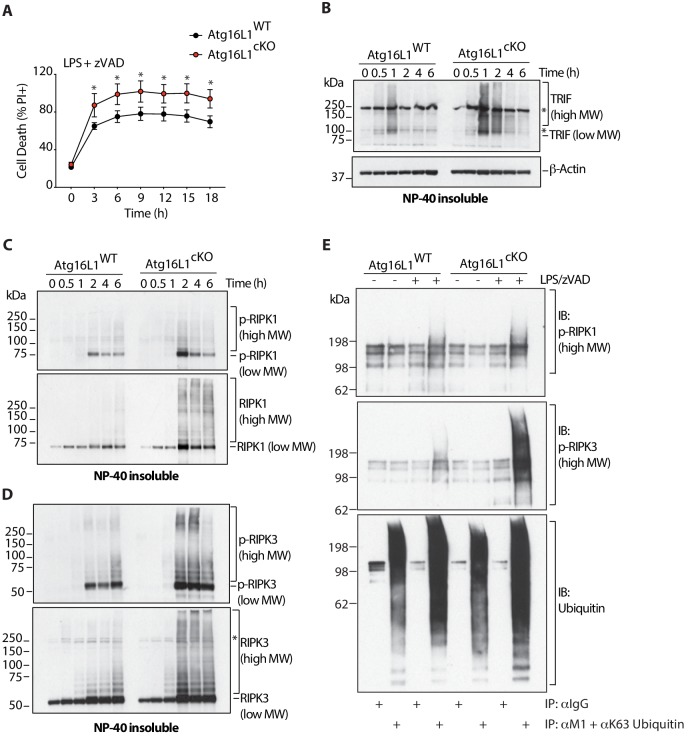
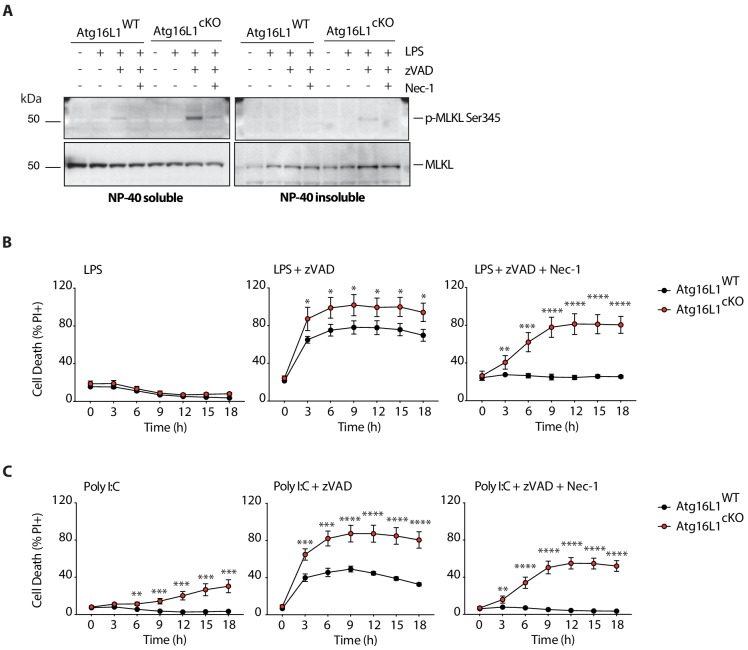
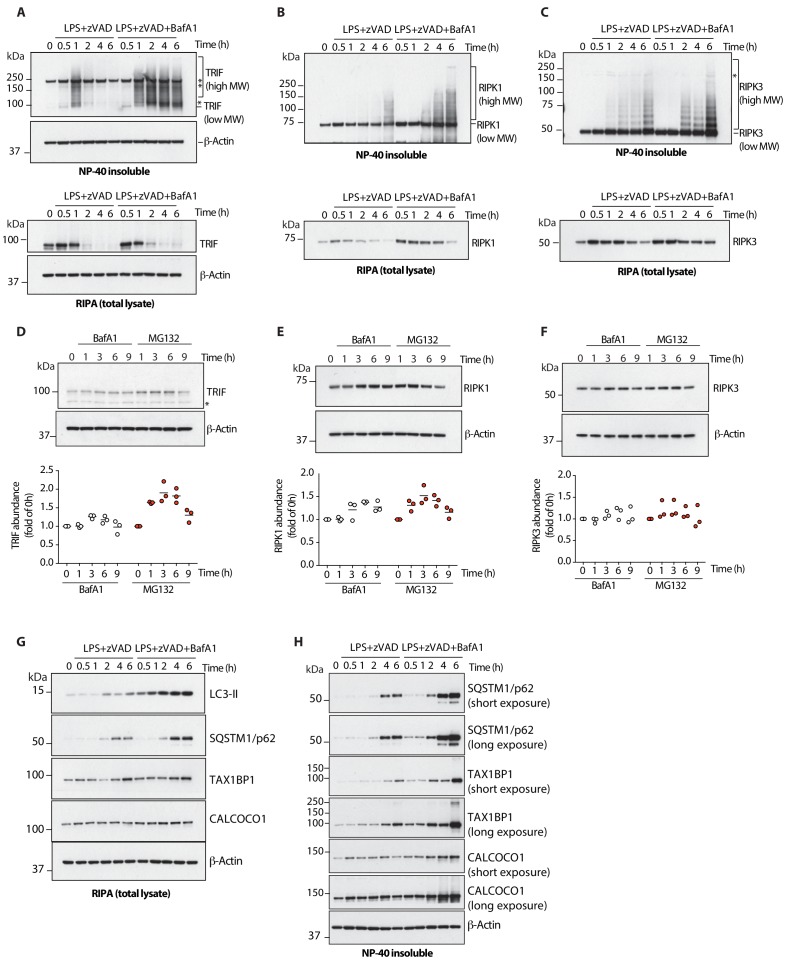
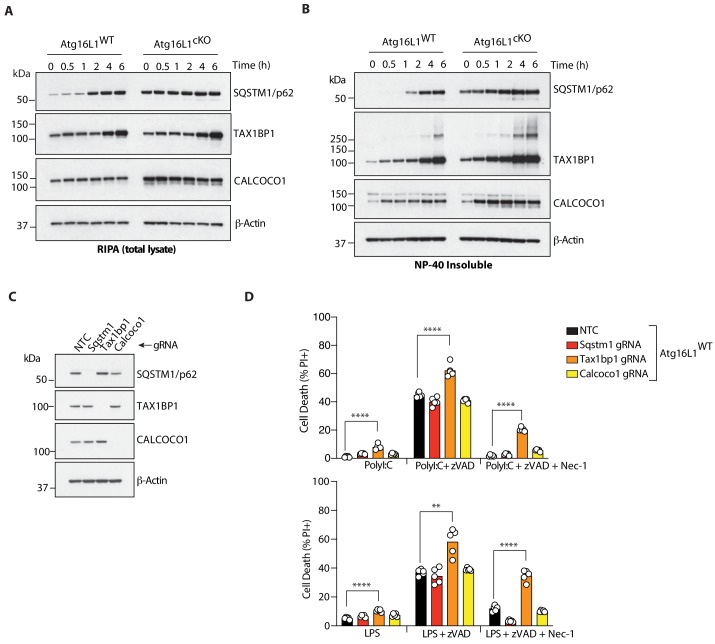
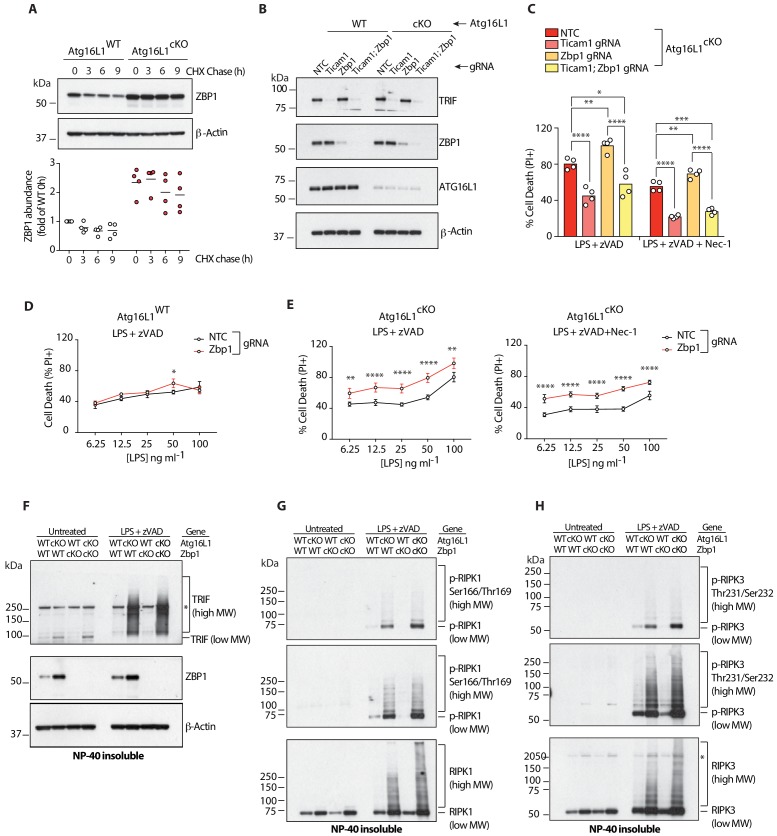
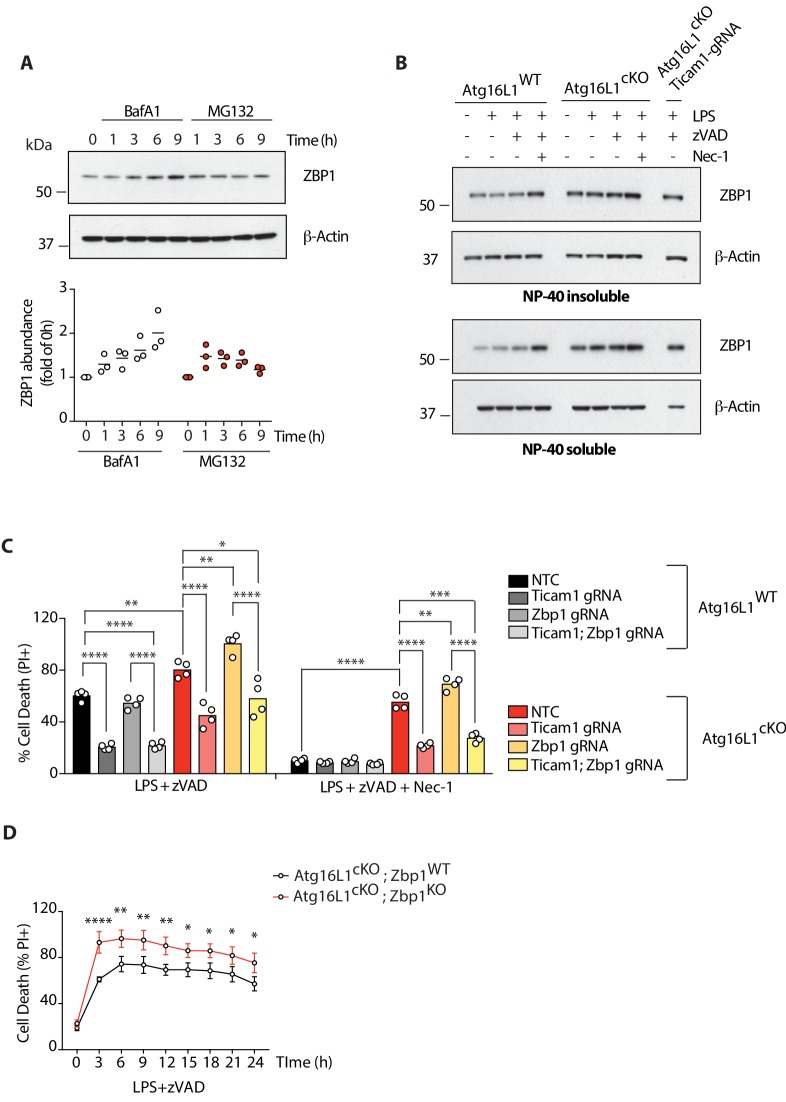
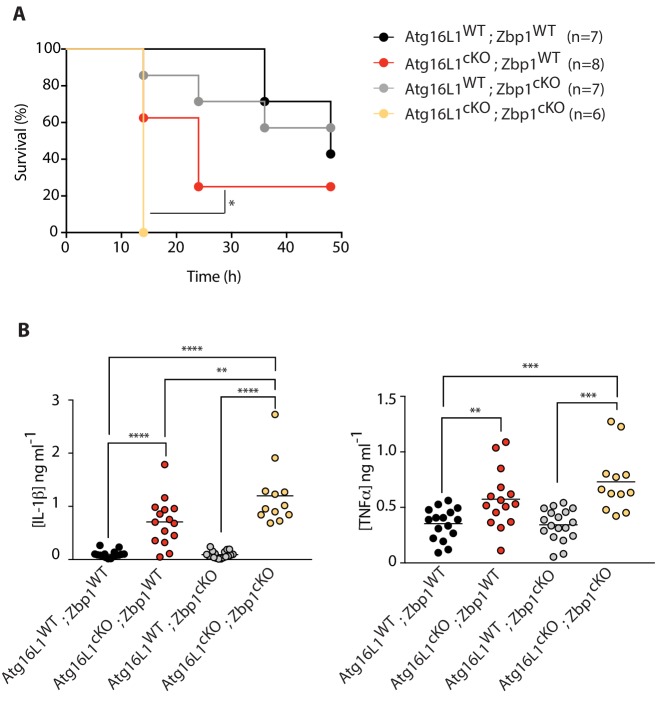
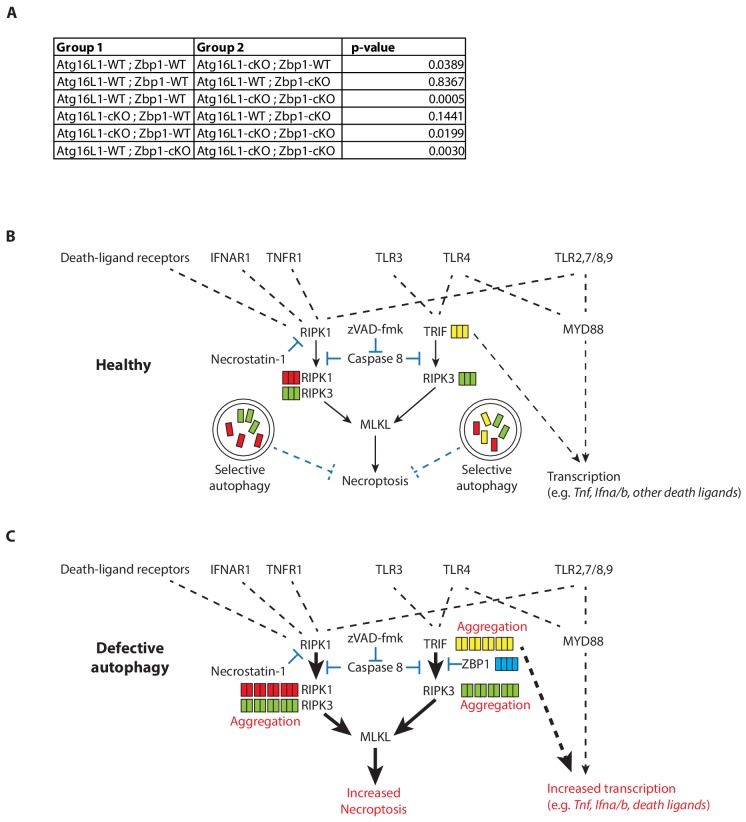
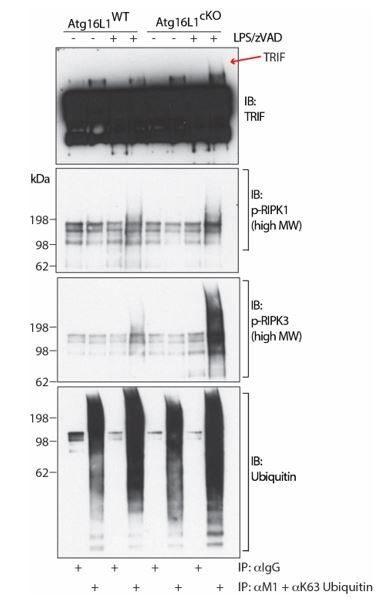
RIPK1, RIPK3, ZBP1 and TRIF, the four mammalian proteins harboring RIP homotypic interaction motif (RHIM) domains, are key components of inflammatory signaling and programmed cell death. RHIM-domain protein activation is mediated by their oligomerization; however, mechanisms that promote a return to homeostasis remain unknown. Here we show that autophagy is critical for the turnover of all RHIM-domain proteins. Macrophages lacking the autophagy gene Atg16l1accumulated highly insoluble forms of RIPK1, RIPK3, TRIF and ZBP1. Defective autophagy enhanced necroptosis by Tumor necrosis factor (TNF) and Toll-like receptor (TLR) ligands. TNF-mediated necroptosis was mediated by RIPK1 kinase activity, whereas TLR3- or TLR4-mediated death was dependent on TRIF and RIPK3. Unexpectedly, combined deletion of Atg16l1 and Zbp1 accelerated LPS-mediated necroptosis and sepsis in mice. Thus, ZBP1 drives necroptosis in the absence of the RIPK1-RHIM, but suppresses this process when multiple RHIM-domain containing proteins accumulate. These findings identify autophagy as a central regulator of innate inflammation governed by RHIM-domain proteins.

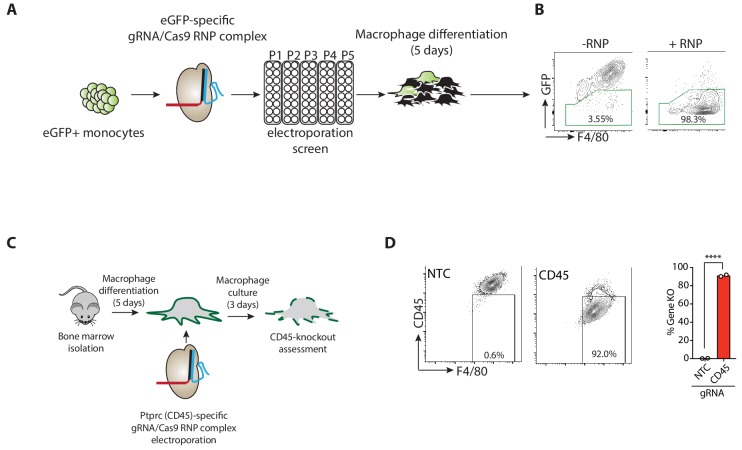
Keywords: CRISPR; autophagy; cell biology; immunology; inflammation; macrophage; mouse; necroptosis; signaling.


Conflict of interest statement

JL, HP, JH, TM, MR, MX, BM, Mv, KN, AM Affiliated with Genentech. No other competing interests to declare

Figures

Figure 1.
Figure 1.. Defective autophagy enhances RIPK1-dependent and independent necroptosis.
(A, B) Cell death assayed by Propidium Iodide (PI) staining and live-cell imaging for 12–16 hr (n = 5). BMDMs from mice of the indicated genotypes were treated with combinations of TNF/zVAD/Nec-1 (A) or PolyI:C/zVAD/Nec-1 and LPS/zVAD/Nec-1 (B). (C) Immunoblots confirming deletion of autophagy genes in BMDMs of indicated genotypes using RNP electroporation. NTC = non targeting control gRNA. (D, E) Cell death assayed under combinations of PolyI:C/zVAD/Nec-1 (D) or LPS/zVAD/Nec-1 (E) treatment (n = 4). Data in (A, B) are representative of four independent experiments; (C–E) are representative of two independent experiments. *p<0.05, **p<0.01, ***p<0.001, ****p<0.0001. Bar graphs depict mean.
Figure 1—figure supplement 1.
Figure 1—figure supplement 1.. Elevated cell death and cytokine production by Atg16l1-cKO BMDMs.
(A) Cell death assayed by PI staining and live-cell imaging for 12–16 hr following with combinations of Pam3CSK4/zVAD/Nec-1, R848/zVAD/Nec-1 or CpG-ODN 1826/zVAD/Nec-1 (n = 5). (B, C) ELISA measurements of IL-1β (B) and TNFα (C) in cell culture supernatants following treatment with combinations of LPS/zVAD/Nec-1 for 18 hr (n = 5). Data in (A) are representative of four independent experiments; (B, C) are representative of two independent experiments. *p<0.05, **p<0.01, ***p<0.001, ****p<0.0001. Bar graphs depict mean.
Figure 1—figure supplement 2.
Figure 1—figure supplement 2.. CRISPR-mediated deletion of genes in primary BMDMs.
(A) Schematic of screening protocol to identify conditions for high efficiency eGFP deletion in monocytes and BMDMs using electroporation of CRISPR/Cas9-guide RNA(gRNA) ribonucleoprotein (RNP) complexes. (B) Flow cytometry plot demonstrating condition resulting in highly efficient eGFP loss. (C) Schematic illustrating CRISPR-mediated deletion of Ptprc/CD45. (D) Flow cytometry plots depicting Ptprc deletion and associated quantification of CD45 knockdown pooled from two independent experiments. Selected electroporation conditions were repeated at least three times with consistent results. Bar graphs depict mean. NTC = non targeting control gRNA.
Figure 2.
Figure 2.. RIPK3, MLKL and TRIF are required for RIPK1-independent necroptosis in Atg16l1-deficient BMDMs.
(A-E) Immunoblot (A, C) and cell death assays (B, D, E) of BMDMs from mice of indicated genotypes treated with combinations of LPS/zVAD/Nec-1 following CRISPR-mediated deletion of RIPK3, MLKL or GSDMD (A, B) (n = 4) or TRIF (C–E) (n = 6). Cell death assayed by PI staining and live-cell imaging for 12–16 hr. Data in (A, B) are representative of three independent experiments; (C, D, E) are representative of four independent experiments. **p<0.01, ***p<0.001, ****p<0.0001. Bar graphs depict mean. NTC = non targeting gRNA.
Figure 2—figure supplement 1.
Figure 2—figure supplement 1.. RIPK3 and MLKL drive RIPK1-dependent, TNF-mediated necroptosis; TRIF drives RIPK1-independent, PolyI:C-mediated necroptosis in Atg16l1-cKO BMDMs.
(A) Cell death assayed by PI staining and live-cell imaging for 12–16 hr of BMDMs treated with combinations of TNFα/zVAD/Nec-1 following CRISPR-mediated deletion of Ripk3, Mlkl or Gsdmd (n = 4). Gene deletion confirmed by immunoblots in Figure 2A. (B) Immunoblots confirming CRISPR-mediated deletion of Nlrp3 or Pycard in wild-type or Atg16l1-cKO BMDMs. (C) Cell death assayed by PI staining and live-cell imaging for 12–16 hr following CRISPR-mediated deletion of Nlrp3 or Pycard and treatment with PolyI:C/zVAD/Nec-1 or LPS/zVAD/Nec-1 (n = 5). Data in(A) are representative of three independent experiments; (B, C) are representative of two independent experiments. Bar graphs depict mean. *p<0.05, **p<0.01, ****p<0.0001. NTC = non targeting gRNA.
Figure 2—figure supplement 2.
Figure 2—figure supplement 2.. TNF and Type I interferon license necroptosis in BMDMs.
(A-F) Cell death assayed by PI staining and live-cell imaging for 12–16 hr of Atg16l1-WT and Atg16l1-cKO BMDMs pre-treated with TNFR2-Fc or α-IFNAR1 followed by TLR ligand or TNF mediated necroptosis (n = 5). Cells were pre-treated for 36 hr with 20 μg/mL α-Ragweed, TNFR2-Fc or α-IFNAR1 prior to addition of TLR ligands or TNF. (G) Immunoblots for phosphorylated STAT1 in BMDMs following LPS/zVAD treatment over 6 hr. Data in (A–F) are representative of four independent experiments; (G) are representative of two independent experiments. **p<0.01, ****p<0.0001. Bar graphs depict mean.
Figure 3.
Figure 3.. Loss of Atg16l1 drives accumulation of detergent insoluble, high molecular weight TRIF, RIPK1, RIPK3 and enhances RIPK1/RIPK3 phosphorylation.
(A, B) Immunoblots of TRIF in Atg16l1-WT and Atg16l1-cKO BMDM lysates following 4 hr of treatment with indicated combinations of LPS/zVAD/Nec-1 and enrichment of NP-40 soluble (A) or insoluble (B) fractions. (C, D) immunoblots for autophosphorylated RIPK1 (Ser166/Thr169, p-RIPK1) and total RIPK1 in Atg16l1-WT and Atg16l1-cKO BMDM lysates following 4 hr of treatment with indicated combinations LPS/zVAD/Nec-1 and enrichment of NP-40 soluble (C) or insoluble (D) fractions. (E, F) immunoblot assay for autophosphorylated RIPK3 (Thr231/Ser232, p-RIPK3) and total RIPK3 in Atg16l1-WT and Atg16l1-cKO BMDM lysates following 4 hr of treatment with indicated combinations of LPS/zVAD/Nec-1 and enrichment of NP-40 soluble (E) or insoluble (F) fractions. Representative data shown from three independent experiments. In all immunoblots, CRISPR-mediated TRIF deletion was performed in Atg16l1-cKO BMDMs followed by LPS/zVAD treatment as a negative control. *=non specific bands (n.s.).
Figure 4.
Figure 4.. Overabundance of TRIF, phosphorylated and ubiquitinated RIPK1 and RIPK3 coincides with accelerated necroptosis of Atg16l1 deficient BMDMs.
(A) Kinetic measurement of cell death over 18 hr of LPS/zVAD treatment (n = 5). (B) Immunoblot of TRIF in NP-40 insoluble fractions of BMDM lysates over 6 hr of LPS/zVAD treatment. (C, D) Immunoblots of autophosphorylated and total RIPK1 (C), RIPK3 (D) in NP-40 insoluble fractions of BMDM lysates treated as in (B). (E) Immunoblots of autophosphorylated RIPK1, RIPK3 and ubiquitin in BMDM lysates following immunoprecipitation of M1 or K63-ubiquitinated proteins after 4 hr of LPS/zVAD treatment. Data in (A) are representative of four independent experiments; (B–D) are representative of three independent experiments; (E) are representative of three independent experiments. *=P < 0.05.
Figure 4—figure supplement 1.
Figure 4—figure supplement 1.. Enhanced MLKL activation and accelerated cell death in Atg16l1 deficient BMDMs following LPS- or PolyI:C-mediated necroptosis.
(A) Immunoblots depicting p-MLKL Ser345 in NP-40 soluble and insoluble fractions of BMDM lysates 4 hr after indicated treatments. (B, C) Death of wild-type and Atg16l1-cKO BMDMs assayed by PI staining and live-cell imaging over 18 hr of LPS- (B) or PolyI:C- (C) mediated necroptosis. LPS +zVAD time-course is same as in Figure 4A. Data in (A) are representative of three independent experiments; (B, C) are representative of four independent experiments. Dots represent mean (n = 5)±S.D. *p<0.05, **p<0.01, ****p<0.0001.
Figure 4—figure supplement 2.
Figure 4—figure supplement 2.. Lysosomal function and autophagic flux drive turnover of active TRIF, RIPK1 and RIPK3 during necroptosis.
(A-C) Immunoblots assaying levels of TRIF (A), RIPK1 (B) or RIPK3 (C) in total lysatse (bottom) and detergent- insoluble fractions (top) of BMDM lysates over 6 hr of LPS/zVAD treatment in the presence of Bafilomycin A1. (D–F) Immunoblots assaying basal turnover of TRIF (D), RIPK1 (E) or RIPK3 (F) by perturbation of proteasomal (MG132, 2 μM) or lysosomal (Bafilomycin A1, BafA1 100 nM) activity. Dot plots in (D–F) summarize protein abundance measured by immunoblot intensity normalized to 0 hr time point. Lines depict mean (n = 4). (G, H) Autophagic flux during LPS/zVAD-mediated necroptosis assayed by immunoblots of LC3-II and indicated autophagy receptors. Protein levels were assayed over 6 hr of necroptosis in presence of Bafilomycin A1 to halt autophagic flux. (G) total lysate; (H) detergent-insoluble fraction. Data in (A–F) are representative of three independent experiments; (G, H) are representative of two independent experiments.
Figure 5.
Figure 5.. The autophagy receptor TAX1BP1 protects against necroptosis by TLR3 or TLR4 ligands.
(A, B) Immunoblots of indicated autophagy receptors in total (A) or NP-40 insoluble fractions (B) of BMDM lysates over 6 hr of LPS/zVAD treatment. (C) Immunoblots confirming CRISPR-mediated deletion of indicated autophagy receptor genes in wild-type BMDMs. (D) Cell death assayed by PI staining and live-cell imaging for 12–16 hr following treatment with indicated ligands. Data in (A, B) are representative of three independent experiment; (C, D) are representative of four independent experiments. **p<0.01, ****p<0.0001. Bar graphs depict mean. NTC = non targeting control gRNA.
Figure 6.
Figure 6.. Elevated ZBP1 in Atg16l1-deficient BMDMs suppresses TRIF-mediated necroptosis.
(A) ZBP1 turnover in Atg16l1-WT and Atg16l1-cKO BMDMs following cycloheximide (CHX) treatment for indicated time points. Representative immunoblot (top), ZBP1 quantification by densitometry (bottom) normalized to ZBP1 band intensity in WT samples at 0 hr. (B, C) immunoblot (B) and cell death (C) assays of BMDMs from mice of indicated genotypes treated with combinations of LPS/zVAD/Nec-1 following CRISPR-mediated deletion of Zbp1, Ticam1 or both (n = 4). (D, E) cell death assayed in Atg16l1-WT or Atg16l1-cKO BMDMs following CRISPR-mediated Zbp1 deletion and a dose titration of LPS in the presence of 20 μM zVAD and/or 30 μM Nec-1 (n = 4). Dot-plots depict mean ±S.D. (F–H) immunoblots depicting accumulation of TRIF (F), autophosphorylated and total RIPK1 (G), autophosphorylated and total RIPK3 (H) in NP-40 insoluble lysates of BMDMs lacking both Atg16l1 and Zbp1 following induction of necroptosis via LPS/zVAD for 3 hr. Top panels represent short exposures; middle panels represent long exposures. *=non specific band. Data (A) are representative of four independent experiments, densitometry is pooled from four independent experiments. Data in (B, C) are representative of three independent experiments; (D–H) are representative of two independent experiments. *p<0.05, **p<0.01, ***p<0.001, ****p<0.0001. Bar graphs depict mean. NTC = non targeting control gRNA.
Figure 6—figure supplement 1.
Figure 6—figure supplement 1.. Loss of Atg16l1 leads to ZBP1 accumulation; deletion of Zbp1 in Atg16l1-cKO BMDMs enhances TRIF-mediated necroptosis and RIPK3 activation.
(A) ZBP1 turnover in wild-type BMDMs measured by inhibition of lysosomal (Bafilomycin A1, BafA1 100 nM) or proteasomal (MG132 2 μM) function for indicated time points. Immunoblot is representative of three independent experiments, summarized in dot plot below as ZBP1 band intensity normalized to WT 0 hr time point. Lines depict mean (n = 3). (B) ZBP1 accumulation assayed by immunoblot in NP-40 insoluble and soluble fractions of Atg16l1-WT and Atg16l1-cKO BMDM lysates following treatment with indicated combinations of LPS/zVAD/Nec-1 for 4 hr. CRISPR-mediated deletion of Ticam1 in Atg16l1-cKO BMDMs followed by LPS/zVAD treatment is used as a negative control. (C) Cell death assayed by PI staining and live-cell imaging for 12–16 hr. BMDMs from mice of indicated genotypes treated with combinations of LPS/zVAD/Nec-1 following CRISPR-mediated deletion of Zbp1, Ticam1 or both (n = 4). (D) Cell death time-course of BMDMs of indicated genotypes following LPS/zVAD mediated necroptosis. Dots represent mean (n = 4)±S.D. All data are representative of three independent experiments. *p<0.05, **p<0.01, ***p<0.001, ****p<0.0001. NTC = non targeting gRNA.
Figure 7.
Figure 7.. Combined loss of myeloid-specific Atg16l1 and Zbp1 accelerates LPS-mediated sepsis in mice.
(A) Kaplan-Meier survival plots for mice following challenge with 10 mg/kg LPS administered intraperitoneally. Statistical analysis Figure 7—figure supplement 1A was performed using log-rank test (Figure 7—figure supplement 1; Figure 7—figure supplement 1A). (B) Serum cytokine measurements of IL-1β and TNFα performed by ELISA following 4 hr of intraperitoneal LPS administration at 10 mg/kg. Data in A are representative of two independent experiments. Data in B are pooled from two independent experiments. *p<0.05, **p<0.01, ***p<0.001, ****p<0.0001.
Figure 7—figure supplement 1.
Figure 7—figure supplement 1.. Accelerated morbidity conferred by double deficiency of ATG16L1 and ZBP1 in myeloid cells following LPS-mediated sepsis in mice.
(A) Statistical analysis of Kaplan-Meier curve depicted in Figure 7. P-values are generated using log-rank test. (B) Inflammatory cytokines, death ligands and TLR ligands induce necroptotic signaling upon caspase-inhibition. Autophagy promotes turnover of TRIF, RIPK1 and RIPK3 to control necroptosis in healthy macrophages. (C) In the absence of autophagy, accumulation of active TRIF, RIPK1 and RIPK3 enhances necroptosis as well as inflammatory cytokine production. Accumulation of ZBP1 attenuates TRIF-mediated necroptosis during autophagy deficiency. During TLR3- or TLR4- activation, overabundance of TRIF drives RIPK3-dependent necroptosis that is resistant to RIPK1 inhibition. Autocrine signaling via non-TRIF TLRs may contribute to enhanced necroptosis. Dotted lines depict indirect signaling events; solid lines depict direct signaling events.
Author response image 1.
Author response image 1.. TRIF, autophosphorylated RIPK1 and autophosphorylated RIPK3 are ubiquitinated during necroptosis.
Immunoblots of TRIF, autophosphorylated RIPK1, autophosphorylated RIPK3 and ubiquitin in BMDM lysates following immunoprecipitation of M1 or K63-ubiquitinated proteins after 4 hours of LPS/zVAD treatment. Red arrow depicts specific high MW TRIF signal.

Similar articles

Cited by

References

    1. Anding AL, Baehrecke EH. Cleaning house: selective autophagy of organelles. Developmental Cell. 2017;41:10–22. doi: 10.1016/j.devcel.2017.02.016. - DOI - PMC - PubMed
    1. Cai Z, Jitkaew S, Zhao J, Chiang HC, Choksi S, Liu J, Ward Y, Wu LG, Liu ZG. Plasma membrane translocation of trimerized MLKL protein is required for TNF-induced necroptosis. Nature Cell Biology. 2014;16:55–65. doi: 10.1038/ncb2883. - DOI - PMC - PubMed
    1. Chen X, Li W, Ren J, Huang D, He WT, Song Y, Yang C, Li W, Zheng X, Chen P, Han J. Translocation of mixed lineage kinase domain-like protein to plasma membrane leads to necrotic cell death. Cell Research. 2014;24:105–121. doi: 10.1038/cr.2013.171. - DOI - PMC - PubMed
    1. Cho YS, Challa S, Moquin D, Genga R, Ray TD, Guildford M, Chan FK. Phosphorylation-driven assembly of the RIP1-RIP3 complex regulates programmed necrosis and virus-induced inflammation. Cell. 2009;137:1112–1123. doi: 10.1016/j.cell.2009.05.037. - DOI - PMC - PubMed
    1. Choi S-W, Park H-H, Kim S, Chung JM, Noh H-J, Kim SK, Song HK, Lee C-W, Morgan MJ, Kang HC, Kim Y-S. PELI1 selectively targets Kinase-Active RIP3 for Ubiquitylation-Dependent proteasomal degradation. Molecular Cell. 2018;70:920–935. doi: 10.1016/j.molcel.2018.05.016. - DOI - PubMed

Publication types

Substances