. 2019 Jul 9:8:e46793.
doi: 10.7554/eLife.46793.

Genetic interactions of G-quadruplexes in humans

Affiliations

Genetic interactions of G-quadruplexes in humans

Katherine G Zyner et al. Elife. .

Abstract

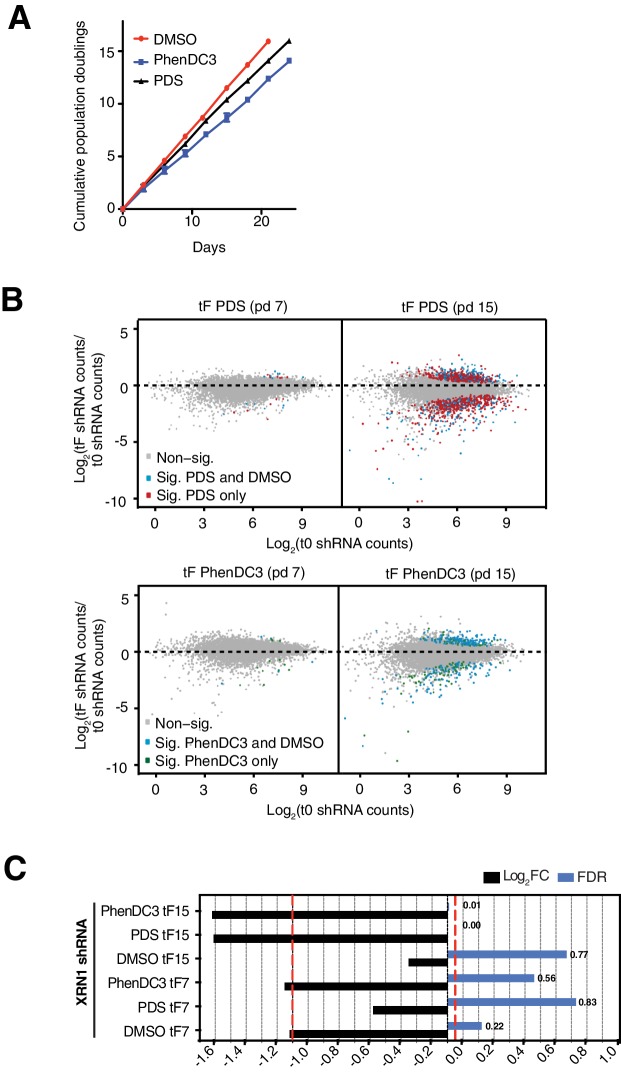
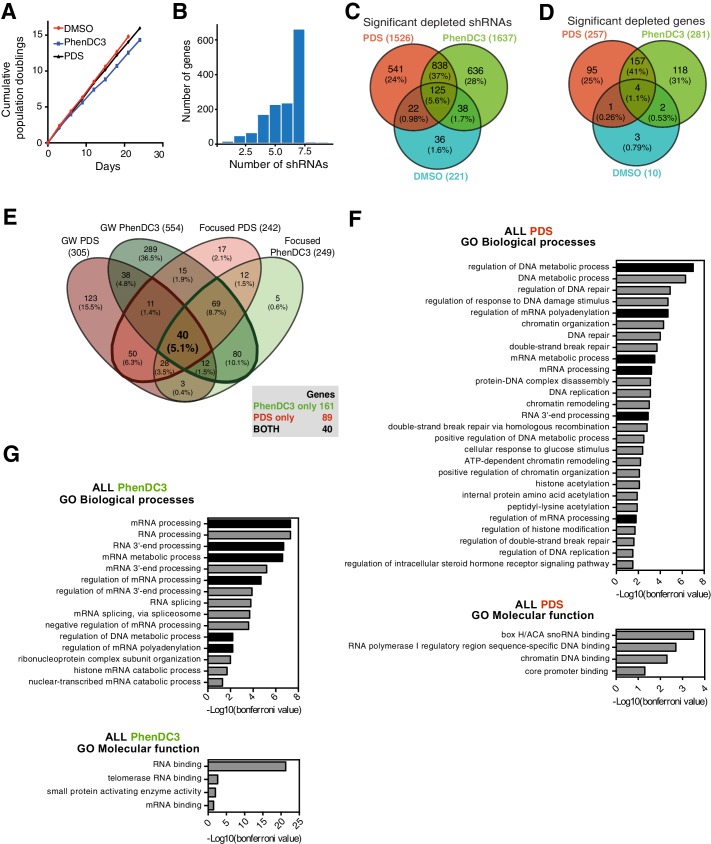
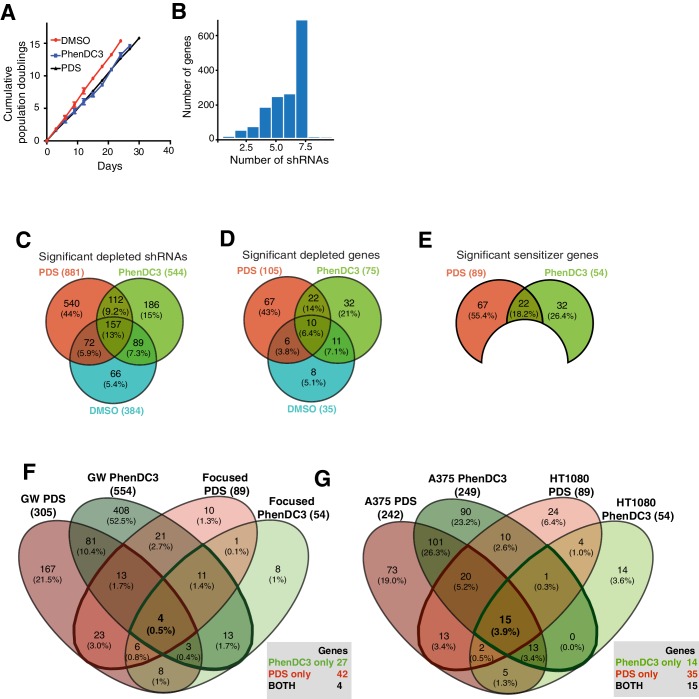
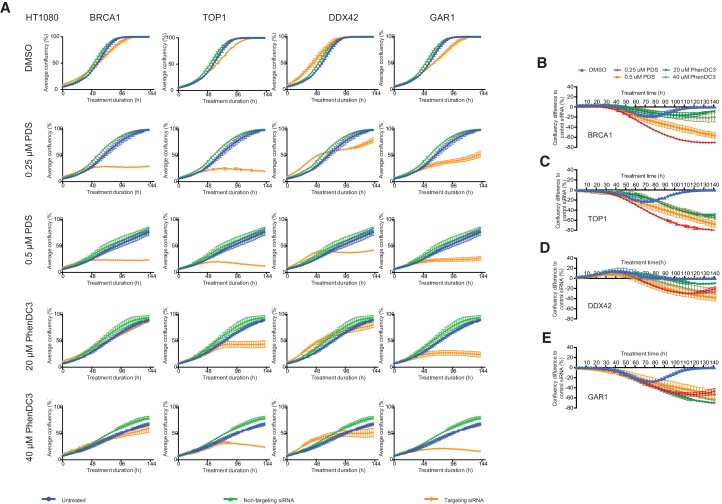
G-quadruplexes (G4) are alternative nucleic acid structures involved in transcription, translation and replication. Aberrant G4 formation and stabilisation is linked to genome instability and cancer. G4 ligand treatment disrupts key biological processes leading to cell death. To discover genes and pathways involved with G4s and gain mechanistic insights into G4 biology, we present the first unbiased genome-wide study to systematically identify human genes that promote cell death when silenced by shRNA in the presence of G4-stabilising small molecules. Many novel genetic vulnerabilities were revealed opening up new therapeutic possibilities in cancer, which we exemplified by an orthogonal pharmacological inhibition approach that phenocopies gene silencing. We find that targeting the WEE1 cell cycle kinase or USP1 deubiquitinase in combination with G4 ligand treatment enhances cell killing. We also identify new genes and pathways regulating or interacting with G4s and demonstrate that the DDX42 DEAD-box helicase is a newly discovered G4-binding protein.

Keywords: G-quadruplex; G-quadruplex ligands; G4; biochemistry; cancer; chemical biology; chromosomes; gene expression; genetic vulnerability; human; nucleic acid structure.


Conflict of interest statement

KZ, DM, SA, SM, MD, NE, DT No competing interests declared, GH Is associated with transOMIC Technologies, who have commercialised libraries constructed using the shERWOOD and ultramiR design strategies. SB Is founder, adviser and shareholder of Cambridge Epigenetix Ltd.

Figures

Figure 1.
Figure 1.. Strategy identifying genetic vulnerabilities involved with G4 biology.
Genome-wide shRNA silencing combined with G4 structure stabilisation by small molecules identifies genes that when depleted compromise cell viability. Cells are infected with a genome-wide pool of shRNA lentiviruses targeting the protein coding genome followed by G4 ligand treatment to stabilise genomic and/or RNA G4 structures. Two general outcomes are possible: a gene is not required in a G4-dependent process so there is no effect on cell viability (left); or gene silencing results in cell death either due to loss of a direct G4 interaction (e.g. binding/unwinding) or indirectly through gene loss in a G4-dependent pathway (right). In absence of ligand, cells are viable in presence of the shRNA. Dotted boxes highlight genotypes of disease significance for possible G4-based therapies (blue) and genes and biological pathways that involve and/or interact with G4 structures (orange).
Figure 2.
Figure 2.. shRNA screening pipeline to uncover genetic vulnerabilities to G4 stabilisation.
(A) A G-tetrad with four interacting guanines (left), which stack to form G4 structures (right). (B) Structures of the G4-stabilising small molecule ligands PDS and PhenDC3. (C) Distribution of the numbers of shRNAs targeting each gene, with the average indicated by a red dotted line. (D) Overall screening approach illustrated for one library pool. Plasmids are retrovirally packaged and A375 cells are infected at multiplicity of infection (MOI) of 0.3 (30%). Following antibiotic selection, an initial time point (t0) is harvested and then cells are cultured for ‘n’ population doublings in DMSO, PDS or PhenDC3 before the final time point was harvested (tF).
Figure 2—figure supplement 1.
Figure 2—figure supplement 1.. Genome-wide shRNA screen parameter optimisation.
(A) Representative growth curves from shRNA pool eight showing cumulative population doublings for DMSO, PhenDC3 and PDS (mean and standard deviation from three cell counts per condition). (B) Comparison of significant hairpin hits (colours indicate significance at FDR ≤ 0.05) for two end points: population doubling 7 (left) and 15 (right) for PDS (top) and PhenDC3 (bottom). (C) Comparison of FDR and log2FC values for a hairpin targeting XRN1 following DMSO, PDS or PhenDC3 treatment after 7 and 15 population doublings.
Figure 3.
Figure 3.. Genome-wide screening in A375 cells reveals deficiencies in known G4-associated genes as sensitive to G4-stabilising small molecules.
(A–C) Venn diagrams for: (A) significantly differentially expressed individual shRNAs (FDR ≤ 0.05); (B) significantly depleted genes (50% or three hairpins, FDR ≤ 0.05, median log2FC < 0) following DMSO, PDS and PhenDC3 treatment and (C) Significant PDS and PhenDC3 sensitiser genes not in DMSO and after applying a median log2FC ≤ −1 cut off. (D–F) Tables showing the number of depleted hairpins and median log2FC values for: (D) known G4 ligand sensitisers, ATRX, HERC2, BRCA1 and BRCA2, that are independently validated in our screen; (E) sensitisers annotated with a G4-associated term in GO, UniprotKB or G4IPBD databases and (F) sensitisers identified as G4-related by text-mining showing the associated PolySearch2 algorithm score and summary of the G4 association. Sensitisers are defined as a gene where 50% or three hairpins were significantly differentially expressed (FDR ≤ 0.05) with median log2FC ≤ −1. See also Supplementary file 1.
Figure 4.
Figure 4.. Pathways and processes showing sensitivity to G4-stabilising ligands.
(A) Enriched KEGG pathways and (B) Gene Ontology terms, GO Biological Processes (BP) and Molecular Functions (MF), for the 758 genome-wide G4-sensitiser genes. Blue- genes common to both ligands; black- genes unique to either PDS or PhenDC3. A right-sided enrichment test with Bonferroni correction used (see Materials and methods). (C) Enriched protein domains (p≤0.05) within GENE3D (black) and PFAM databases (grey) ordered by -Log10 (EASE p-value). See also Supplementary file 1.
Figure 5.
Figure 5.. Identification of cancer-associated genes whose loss promotes sensitivity to G4 ligands.
(A, B) Median log2FC and number of significantly depleted hairpins for G4 sensitisers overlapping the COSMIC database for PDS (A) and PhenDC3 (B). Genes common to both are indicated in blue. See also Supplementary file 1. (C) Functional interaction network analysis using STRING for the 50 COSMIC proteins indicated in A and B. Clusters are shown using confidence interactions > 0.4 from co-expression and experimental data. Box indicates the DDR cluster.
Figure 6.
Figure 6.. A custom G4 sensitiser shRNA panel reveals unique and common G4 ligand sensitivities.
(A) A shRNAs custom retroviral pool (~8000 hairpins) was used to infect A375 cells. Following antibiotic selection, the reference time point (t0) was taken and then cells were cultured for 15 population doublings in DMSO, PDS or PhenDC3 before (tF). Three biological replicates were performed. (B) Significant sensitiser genes for the A375 focused screen (50% or three significantly depleted with median log2 FC≤ −1). (C) Overlap of the genome-wide (GW) with A375 focused screen for PDS and PhenDC3 G4-sensitisers combined (see also Figure 6—figure supplement 1). (D–E) Enriched KEGG pathways for (D) PhenDC3 and (E) PDS sensitiser genes common to the genome-wide and A375 focused screens. A right-sided enrichment test with Bonferroni correction used (see Materials and methods). (F) DAVID, STRING (experimental data, co-expression, medium confidence ≥0.4) interaction and UniprotKB data were used to categorise biochemical roles for the 40 high-confidence G4 sensitisers common to both ligands. Genes in red indicate those found in the (DGIdb 2.0). *=genes in multiple categories. (G, H) Overlap of the all 290 robust G4 sensitisers (G) and the 40 G4 sensitisers common to both ligands (H) with the Drug Genome Interaction database. The druggable genome denotes genes with known or predicted drug interactions. Clinically actionable denotes genes used in targeted cancer clinical sequencing panels. See also Figure 6—figure supplement 1, Supplementary file 1.
Figure 6—figure supplement 1.
Figure 6—figure supplement 1.. Focused A375 cell screening parallels findings from the genome-wide screen and highlights differences in individual G4 ligand sensitivities.
(A) Cumulative population doublings for A375 cells for DMSO, PDS and PhenDC3 (mean and standard deviation from three cell counts per condition). (B) Number of shRNAs targeting each gene, with the maximum capped at seven per gene (C–E) Venn diagrams showing (C) significantly depleted shRNAs at t15 v t0 (FDR ≤ 0.05) for DMSO, PDS and PhenDC3 treatment, (D) significantly depleted genes (minimum 50% or three significant shRNAs) and (E) overlap of focused and genome-wide screens. For PDS and PhenDC3, there are 89 and 201 unique genes, respectively, that overlap between the two screens and 40 genes shared for PDS and PhenDC3. (F–G) Enriched Gene Ontology terms (GO Biological Processes and Molecular Functions) as determined by Bonferroni multiple hypothesis correction (p≤0.05) for (E) all 201 PhenDC3 and (F) all 129 PDS G4-hits validated by the A375 focused screen. Black bars reflect terms enriched in both PDS and PhenDC3. See also Supplementary file 2.
Figure 7.
Figure 7.. G4 sensitivities in two different cell lines.
(A) Enriched KEGG and GO pathways for all G4 ligand-specific sensitisers (73 genes) shared between the genome-wide A375 and HT1080 screens. A right-sided enrichment test with Bonferroni correction used (see Materials and methods). (B–C) Comparison of G4 sensitisers across A375 focused, A375 genome-wide and HT1080 focused screens for (B) PhenDC3 and (C) PDS. (D–E) DAVID, STRING (experimental data, co-expression, medium confidence (≥0.4) interaction) and UniProtKB data analysis showing biochemical functions for common PhenDC3 (D) and PDS (E) sensitisers across all three screens. *=genes in multiple categories. Blue, four sensitisers common to both ligands. (F) Left, common sensitiser genes across all three screens. Right, number of depleted hairpins and median log2FC values for four key genes found as both PDS and PhenDC3 sensitisers across all the three screens. See also Figure 7—figure supplement 1, Supplementary file 1.
Figure 7—figure supplement 1.
Figure 7—figure supplement 1.. Focused HT1080 and A375 cell screening reveals shared PDS and PhenDC3 sensitivities.
(A) Cumulative population doublings for HT1080 cells for DMSO, PDS and PhenDC3 (mean and standard deviation from three cell counts per condition). (B) Comparison between the numbers of shRNAs targeting each gene, with the maximum capped at seven per gene. (C–E) Venn diagrams from the HT1080 focused screen showing (C) significantly depleted shRNAs at t15 v t0 (FDR ≤ 0.05) for DMSO, PDS and PhenDC3 treatment, (D) significantly depleted genes (minimum 50% or three significant shRNAs; FDR ≤ 0.05) and (E) sensitiser genes (significantly depleted in PDS or PhenDC3 but not DMSO and median log2FC ≤ −1). (F–G) Venn diagrams showing G4-ligand-specific sensitisers overlapping between (F) the genome-wide (GW) A375 and HT1080 focused screens and (G) the HT1080 and A375 focused screens (50% or three significantly depleted with a median log2FC ≤ −1). See also Supplementary file 2.
Figure 8.
Figure 8.. siRNA knockdowns validate BRCA1, TOP1, DDX42 and GAR1 as key G4 ligand sensitiser genes.
(A) HT1080 cells were treated with non-targeting (NT) or targeting (T) siRNAs for BRCA1, TOP1, DDX42 and GAR1. 48 hr and 144 hr after transfection, cell lysates and a non-transfected cell lysate (U) were probed with appropriate antibodies and actin control by western blotting. (B) Protein levels for targeting (T) and non-targeting (NT) 48 hr lysates were normalised to the internal actin control and then normalised to NT levels for three biological replicates (mean ± standard deviation). (C–F) HT1080 cells were transfected with targeting siRNAs for 24 hr before PDS, PhenDC3 or DMSO treatment. Comparative box plots of confluency differences and significance (unpaired parametric t-test) at selected timepoints for (C) BRCA1, (D) TOP1, (E) DDX42, (F) GAR (ns = not significant) for three separate siRNA transfections. See also Figure 8—figure supplements 1, 2 and 3.
Figure 8—figure supplement 1.
Figure 8—figure supplement 1.. Short-term siRNA knockdowns of four key sensitisers in HT1080 cells show dose-dependent growth inhibition with G4-ligands.
(A) HT1080 cells were transfected with targeting siRNAs (orange) against BRCA1, TOP1, DDX42 or GAR1 for 24 hr before treatment with PDS (0.25 μM and 0.5 μM), PhenDC3 (20 μM and 40 μM) or vehicle control (DMSO). For each knockdown, confluency over 144 hr was monitored and plotted against confluency of non-transfected cells (blue) and cells transfected with a non-targeting control siRNA (green). Experiments were performed in triplicate and average confluency accumulation shown (mean ± standard deviation). (B–D) Confluency differences (mean ± standard deviation) compared to NT siRNA were plotted across three replicates for (B) BRCA1, (C) TOP1, (D) DDX42, (E) GAR1.
Figure 8—figure supplement 2.
Figure 8—figure supplement 2.. Short-term siRNA knockdowns of four key G4-sensitisers in A375 cells show dose-dependent growth inhibition with G4-ligands.
A375 cells were transfected with targeting siRNAs (orange) against BRCA1, TOP1, DDX42 or GAR1 for 24 hr before treatment with PDS (5 μM and 10 μM), PhenDC3 (20 μM and 40 μM) or vehicle control (DMSO). For each knockdown, confluency over 144 hr was monitored and plotted against confluency of non-transfected cells (blue) and cells transfected with a non-targeting control siRNA (green). Experiments were performed in triplicate and average confluency accumulation shown (mean ± standard deviation).
Figure 8—figure supplement 3.
Figure 8—figure supplement 3.. Short-term siRNA knockdowns validate four key sensitivities from the shRNA screening in A375 cells.
(A) For BRCA1, TOP1, DDX42 and GAR1, A375 cells were transfected with non-targeting (NT) or targeting (T) siRNAs. 48 hr and 144 hr after transfection, lysates were probed appropriate antibodies alongside a non-transfected lysate (U). (B) BRCA1, TOP1, DDX42 and GAR1 protein levels for targeting (T) and non-targeting (NT) lysates were normalised to the internal actin control and then normalised to NT levels for three independent blots 48 hr (top) and two independent blots 144 hr (bottom) after transfection (mean ± standard deviation). (C–F) A375 cells were transfected with the targeting siRNAs for 24 hr before PDS, PhenDC3 or DMSO treatment. Average confluency difference (mean ± standard deviation) compared to NT siRNA plotted across three replicates for (C) BRCA1, (D) TOP1, (E) DDX42, (F) GAR1. Confluency differences at 72, 96 and 120 hr plotted for comparison for (G) BRCA1, (H) TOP1, (I) DDX42, (J) GAR1.
Figure 9.
Figure 9.. Cell death potentiation mediated by pharmacological inhibition of WEE1 or USP1 with the G4-stabilising ligand PDS.
(A) Cell death potentiation with G4-stabilising ligands in combination with either gene deficiencies, such as shRNA-mediated knockdown (top), or pharmacological inhibition of a protein (bottom). (B) Numbers of depleted shRNA hairpins and median log2FC values for WEE1 and USP1 in the genome-wide and focused screens. (C–F) Synergy plots for HT1080 (C, D) and A375 (E, F) cells treated with PDS in combination with MK1775 (C, E) or pimozide (D, F). To determine any synergy in cell killing, 3D response surface plots were calculated using Combenefit software with the BLISS model for an average of three biological replicas. Heat bar- blue shading indicates synergy combinations, red indicates antagonism (see also Figure 9—figure supplements 1 and 2).
Figure 9—figure supplement 1.
Figure 9—figure supplement 1.. Synergy calculations for PDS with MK1775 and pimozide.
(A–D) Cell viability Cell-Titer Glo 96 hr luminescent values for HT1080 and A375 treated with PDS and MK1775 or PDS and pimozide, were normalised to the untreated controls (denoted 100% viability) and the viability of each condition expressed as a percentage of the untreated cells. These input values are then analysed using the BLISS model within the Combenefit software package to create a matrix of how the treatment ‘controls’ cell viability. Brown denotes high control, thus low viability. (E–H) 2D BLISS synergy matrix derived from ‘control’ input. Each dose combination is given a synergy score. Blue and a high percentage indicates synergy.
Figure 9—figure supplement 2.
Figure 9—figure supplement 2.. Clonogenic cell survival assay demonstrates enhanced cell death upon treatment with PDS in combination MK1775 or pimozide.
Clonogenic survival of HT1080 and A375 cells after 8-day exposure to the indicated drug combinations. (A–D) Colony intensity values, determined by ColonyArea Image J plugin, were expressed as a percentage of untreated (DMSO only) controls. (E–H) BLISS synergy matrix derived using Combenefit software package from normalised colony intensity values. Mean ± standard deviation shown (I–L) Representative SRB-stained colonies for A375 (K and L) and HT1080 (I and J) cells. Three biological replicates were performed.
Figure 10.
Figure 10.. DDX42 is a predominantly nuclear G4-binding protein.
(A) Number of depleted hairpins and median log2FC values for DEAH/DEAD-box helicase genes within the 758 genes identified in the genome-wide screen. Those highlighted in blue caused sensitivity to both PDS and PhenDC3. (B) Representative immunoblots showing cytoplasmic (C) and nuclear (N) lysates for HT1080, human embryonic kidney (HEK) and HeLa cells probed for DDX42, laminB1 and GAPDH2. (C, D) GAPDH and laminB1 protein levels for (C) cytoplasmic and (D) nuclear lysates (mean for two biological replicates ± standard deviation). (E) DDX42 nuclear protein levels (normalised to cytoplasmic levels, mean for two biological replicates ± standard deviation). (F, G) DDX42 binding curves G4s by ELISA. (F) NRAS 5’ UTR RNA G4 (rG4), mutated G4 sequence (rG4 mut) and RNA hairpin. (G) MYC DNA G4 (dG4) and mutated control (dG4 mut). Apparent Kd is calculated from five replicates (values are indicative as the model assumes saturation kinetics).
Figure 10—figure supplement 1.
Figure 10—figure supplement 1.. Circular dichroism spectroscopy for G4 oligonucleotides.
Circular dichroism spectra for G4-forming oligonucleotides (red) and mutated controls (blue) annealed in 100 mM KCl. G4 structures show a characteristic signature with a positive peak at 264 nm and negative peak at 241 nm. (A) NRAS 5’UTR RNA G4 and (B) MYC promoter DNA G4.

References

    1. Abed DA, Goldstein M, Albanyan H, Jin H, Hu L. Discovery of direct inhibitors of Keap1-Nrf2 protein-protein interaction as potential therapeutic and preventive agents. Acta Pharmaceutica Sinica B. 2015;5:285–299. doi: 10.1016/j.apsb.2015.05.008. - DOI - PMC - PubMed
    1. Andrews S. Bioinformatics; 2010. http://www.bioinformatics.babraham.ac.uk/projects/fastqc/
    1. Ashburner M, Ball CA, Blake JA, Botstein D, Butler H, Cherry JM, Davis AP, Dolinski K, Dwight SS, Eppig JT, Harris MA, Hill DP, Issel-Tarver L, Kasarskis A, Lewis S, Matese JC, Richardson JE, Ringwald M, Rubin GM, Sherlock G. Gene ontology: tool for the unification of biology. The Gene Ontology Consortium. Nature Genetics. 2000;25:25–34. doi: 10.1038/75556. - DOI - PMC - PubMed
    1. Azorsa DO, Gonzales IM, Basu GD, Choudhary A, Arora S, Bisanz KM, Kiefer JA, Henderson MC, Trent JM, Von Hoff DD, Mousses S. Synthetic lethal RNAi screening identifies sensitizing targets for gemcitabine therapy in pancreatic cancer. Journal of Translational Medicine. 2009;7:43. doi: 10.1186/1479-5876-7-43. - DOI - PMC - PubMed
    1. Backert S, Gelos M, Kobalz U, Hanski ML, Böhm C, Mann B, Lövin N, Gratchev A, Mansmann U, Moyer MP, Riecken EO, Hanski C. Differential gene expression in colon carcinoma cells and tissues detected with a cDNA array. International Journal of Cancer. 1999;82:868–874. doi: 10.1002/(SICI)1097-0215(19990909)82:6<868::AID-IJC16>3.0.CO;2-W. - DOI - PubMed

Publication types