. 2019 Jul 9;14(7):e0219545.
doi: 10.1371/journal.pone.0219545. eCollection 2019.

Metabolic requirements of human pro-inflammatory B cells in aging and obesity

Affiliations

Metabolic requirements of human pro-inflammatory B cells in aging and obesity

Daniela Frasca et al. PLoS One. .

Abstract

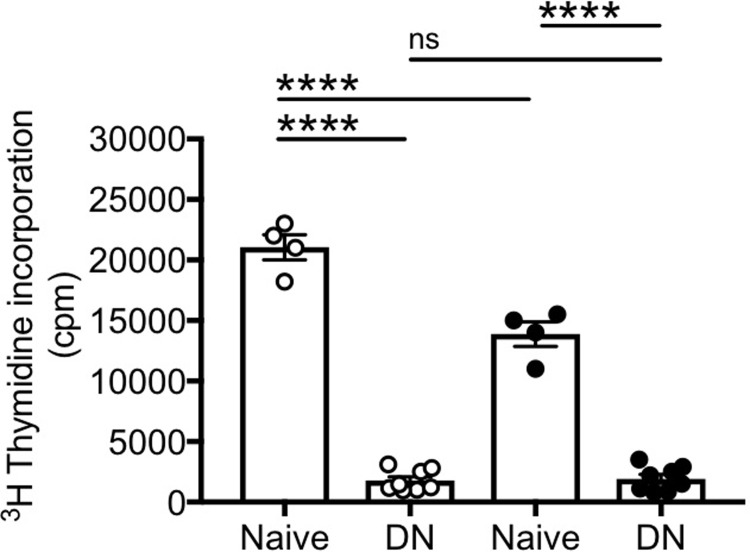
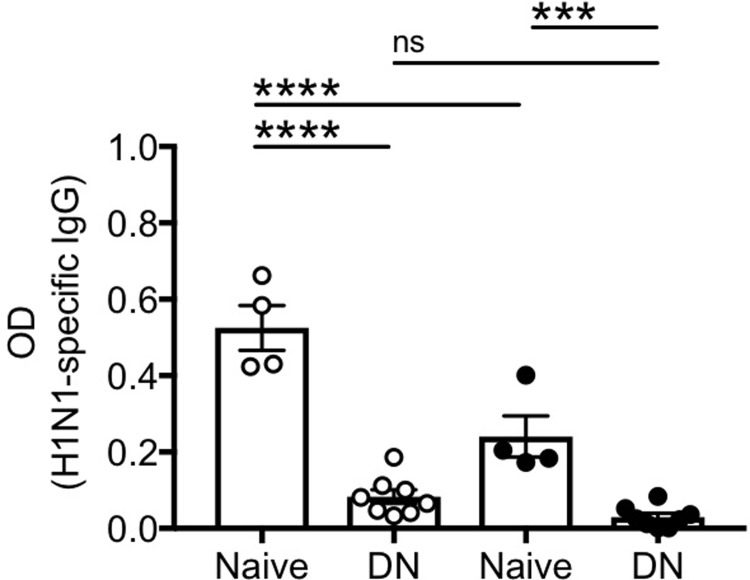
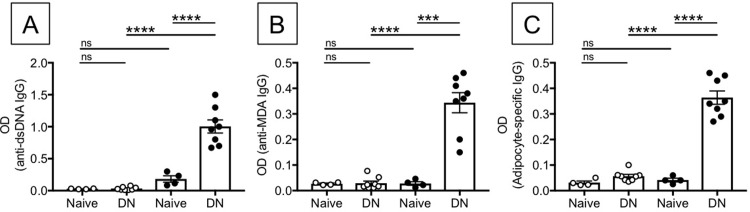
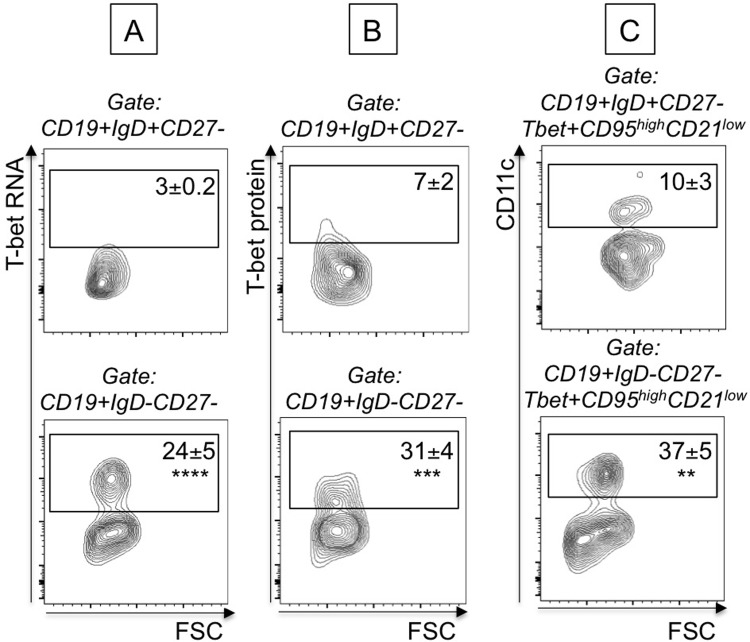
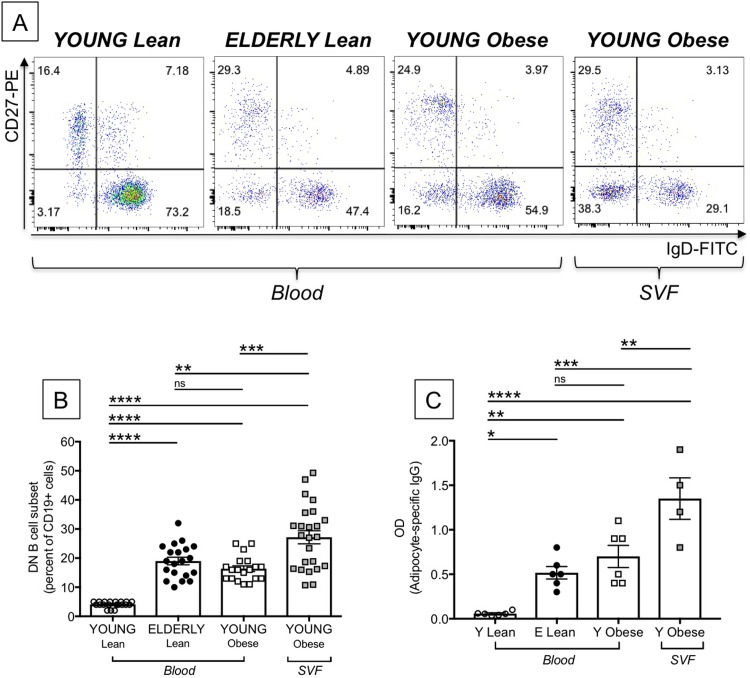
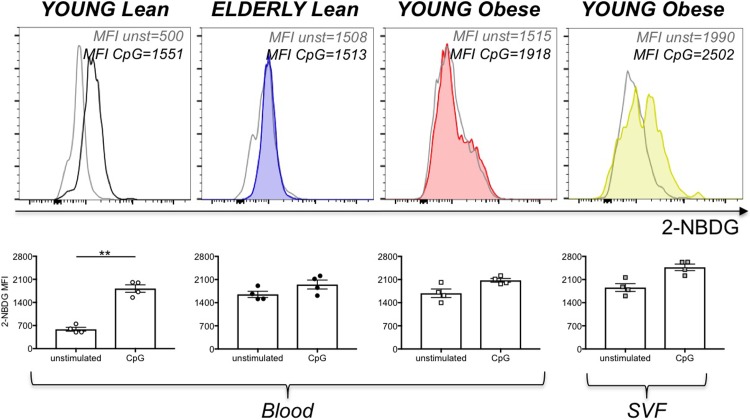
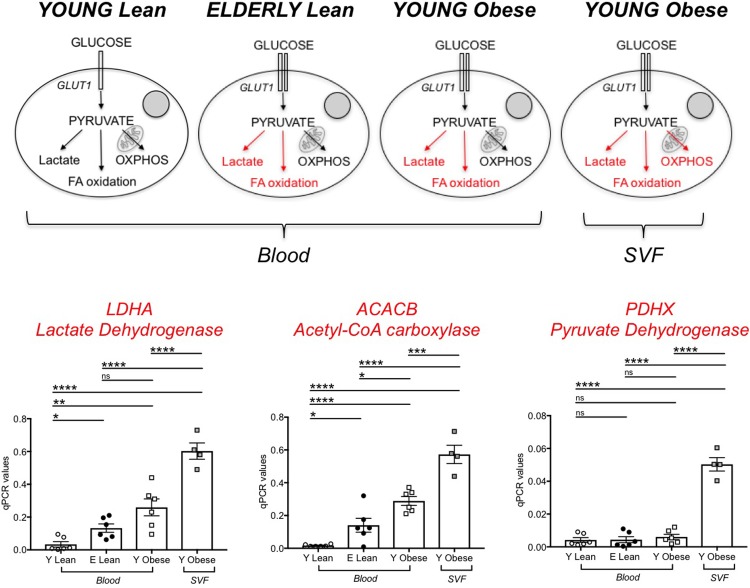
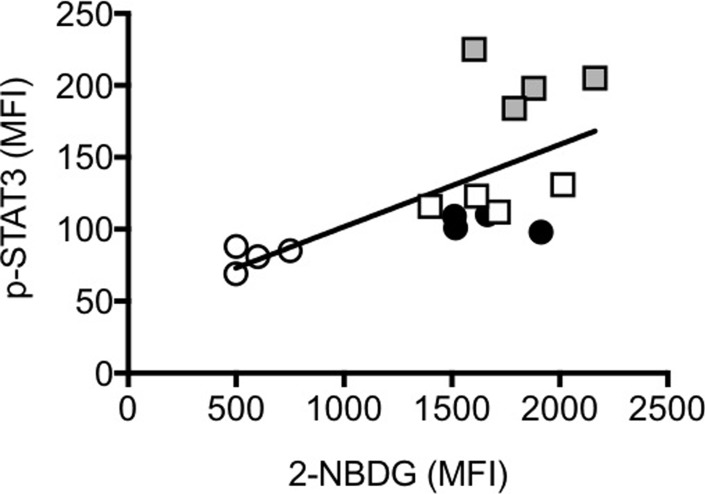
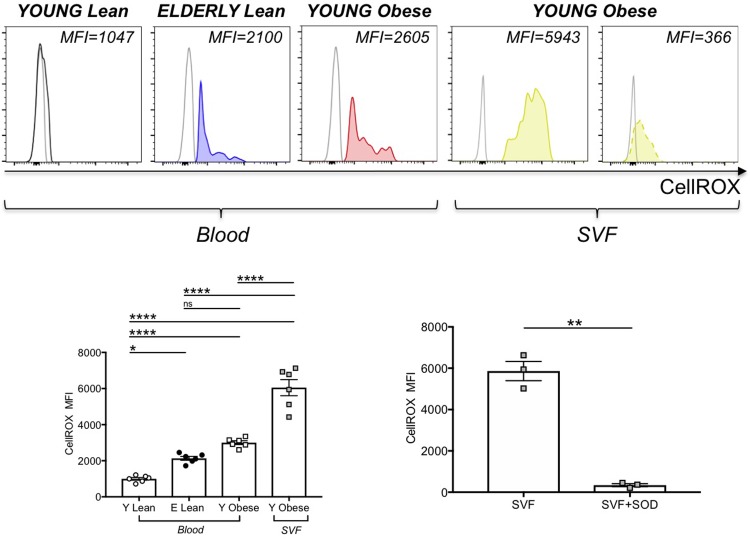
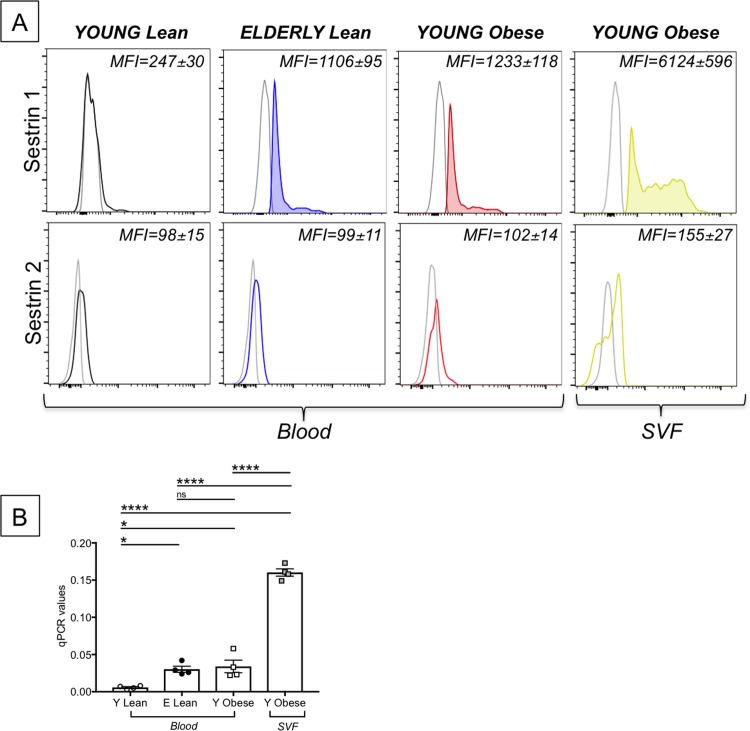
The subset of pro-inflammatory B cells, called late memory, tissue-like or double negative (DN), accumulates in the blood of elderly individuals. Here we show that DN B cells do not proliferate and do not make antibodies to influenza antigens, but they secrete antibodies with autoimmune reactivity, in agreement with their membrane phenotype (CD95+CD21-CD11c+) and their spontaneous expression of the transcription factor T-bet. These cells also increase in the blood of individuals with obesity and autoimmune diseases, but causative mechanisms and signaling pathways involved are known only in part. In the present paper we compare frequencies and metabolic requirements of these cells in the blood of healthy individuals of different ages and in the blood and the subcutaneous adipose tissue (SAT) of individuals with obesity. Results show that DN B cells from young individuals have minimal metabolic requirements, DN B cells from elderly and obese individuals utilize higher amounts of glucose to perform autoimmune antibody production and enroll in aerobic glycolysis to support their function. DN B cells from the SAT have the highest metabolic requirements as they activate oxidative phosphorylation, aerobic glycolysis and fatty acid oxidation. DN B cells from the SAT also show the highest levels of ROS and the highest levels of phosphorylated AMPK (5'-AMP activated kinase) and Sestrin 1, both able to mitigate stress and cell death. This metabolic advantage drives DN B cell survival and function (secretion of autoimmune antibodies).


Conflict of interest statement

The authors have declared that no competing interests exist.

Figures

Fig 1
Fig 1. DN B cells do not proliferate.
Naïve and DN B cells were sorted from the peripheral blood of 4 young (white symbols) and 8 elderly (black symbols) individuals. Sorted cells were stimulated with CpG and anti-Ig antibodies, together with IL-4. Proliferation of sorted B cell subsets was measured after 2 day stimulation by 3H-Thymidine incorporation. Mean comparisons between groups were performed by one-way ANOVA. ****p<0.0001, ns: not significant.
Fig 2
Fig 2. DN B cells do not make influenza-specific antibodies.
Naïve and DN B cells were sorted from the peripheral blood of 4 young (white symbols) and 8 elderly (black symbols) individuals. Sorted cells were stimulated with CpG, H1N1 and anti-Ig antibodies for 10 days. Antibody secretion in culture supernatants was evaluated by ELISA using H1N1-coated plates. Mean comparisons between groups were performed by one-way ANOVA. ***p<0.001, ****p<0.0001, ns: not significant.
Fig 3
Fig 3. DN B cells make anti-self-specific autoimmune antibodies.
Naïve and DN B cells were sorted from the peripheral blood of 4 young (white symbols) and 8 elderly (black symbols) individuals. Sorted cells were left unstimulated for 10 days to evaluate by ELISA the presence of anti-dsDNA antibodies (A), anti-MDA antibodies (B), and anti-SAT antibodies (C) in culture supernatants. Mean comparisons between groups were performed by one-way ANOVA. ***p<0.001, ****p<0.0001, ns: not significant.
Fig 4
Fig 4. DN B cells from elderly individuals express high levels of T-bet mRNA and protein.
B cells from elderly individuals (n = 6) were membrane stained, ic stained to detect T-bet protein and then hybridized with T-bet probe to detect T-bet mRNA. Results show mRNA (A) and protein (B) expression of T-bet in naïve B cells (CD19+IgD+CD27-, top) versus DN B cells (CD19+IgD-CD27-, bottom). C. Results show expression of membrane CD95, CD21 and CD11c markers in naïve B cells (CD19+IgD+CD27-, top) versus DN B cells (CD19+IgD-CD27-, bottom). Events are first gated on naïve/DN B cells, positive for T-bet (mRNA and protein) and then gated on CD95highCD21low. Mean comparisons between groups were performed by paired Student’s t test (two-tailed). **p<0.01, ***p<0.001, ****p<0.0001.
Fig 5
Fig 5. Effects of aging and obesity on the frequency and function of DN B cells.
PBMC from the blood from young and elderly lean individuals and from the blood of young obese individuals were stained to evaluate the frequencies of DN B cells. The SVF from the SAT of young obese individuals was also stained. Young individuals giving PBMC and the SAT were age-, gender- and BMI-matched. A. Representative dot plots are shown. B. Results are expressed as percentages of CD19+ B cells. C. Sorted B cell subsets were left unstimulated in culture for 10 days, then supernatants were collected and tested in ELISA for the presence of IgG specific for protein lysates from the SAT. Mean comparisons between groups were performed by one-way ANOVA. **p<0.01, ***p<0.001, ****p<0.0001, ns: not significant.
Fig 6
Fig 6. Effects of aging and obesity on glucose uptake in DN B cells.
PBMC from the blood from young and elderly lean individuals and from the blood of young obese individuals were stained to evaluate the frequencies of DN B cells. The SVF from the SAT of young obese individuals was also stained. Young individuals giving PBMC and the SAT were age-, gender- and BMI-matched. Cells were incubated in the presence of 2-NBDG. Top. Representative histograms of 2-NBDG uptake are shown for each group of individuals. Bottom. Mean Fluorescence Intensity (MFI)±SE of 2-NBDG uptake before and after CpG stimulation. Mean comparisons between groups were performed by Student’s t test (two-tailed). **p<0.01.
Fig 7
Fig 7. Effects of aging and obesity on glycolytic measures in DN B cells.
PBMC and SVF were obtained as indicated previously. Top. A model to explain the different glycolytic pathways in the different groups is shown. In red are indicated activated pathways. Bottom. Results show qPCR values (2-ΔΔCt) of LDHA, ACACB and PDHX. Mean comparisons between groups were performed by one-way ANOVA. *p<0.05, **p<0.01, ***p<0.001, ****p<0.0001, ns: not significant.
Fig 8
Fig 8. Glucose uptake is positively associated with ic phospho-STAT3 in DN B cells.
PBMC and SVF were obtained as indicated previously. Glucose uptake and ic phosphor-STAT3 were measured in DN B cells from the same individuals. Pearson’s correlation r = -0.65, p = 0.007. Symbols are as follows: young lean, white circles; elderly lean: black circles; young obese: white squares; young obese SVF: grey squares.
Fig 9
Fig 9. Effects of aging and obesity on ROS in DN B cells.
PBMC and SVF were obtained as indicated previously. Top. Representative histograms of CellROX are shown for each group of individuals (solid lines). The dotted line in the last histogram indicates CellROX staining in SVF samples pre-incubated with Vitamin E (100 μg/106 SVF). Bottom, left. Mean Fluorescence Intensity (MFI)±SE of CellROX. In each histogram, unstained cells are used as negative controls. Mean comparisons between groups were performed by one-way ANOVA. *p<0.05, ****p<0.0001, ns: not significant. Bottom, right. The SVFs from 3 young obese individuals (among those in the left graph) were pre-incubated for 30 min with Vitamin E before adding CellROX. Results show MFI±SE of CellROX. Mean comparisons between groups were performed by Student’s t test (two-tailed). **p<0.01.
Fig 10
Fig 10. Effects of aging and obesity on Sestrin 1 and Sestrin 2.
PBMC and SVF were obtained as indicated previously (n = 4). A. Results show mRNA expression of Sestrin 1 (top) and Sestrin 2 (bottom), both measured by PrimeFlow. B. qPCR values (2-ΔΔCt) of Sestrin 1. Mean comparisons between groups were performed by two-way ANOVA. *p<0.05, ****p<0.0001, ns: not significant.
Fig 11
Fig 11. Effects of aging and obesity on AMPK.
PBMC and SVF were from the same 4 individuals in Fig 10. Results show phospho-AMPK (top) and total AMPK (bottom), both measured by ic staining. Mean Fluorescence Intensity (MFI)±SE is shown in each quadrant.

References

    1. Frasca D. Senescent B cells in aging and age-related diseases: Their role in the regulation of antibody responses. Exp Gerontol. 2018;107:55–8. 10.1016/j.exger.2017.07.002 - DOI - PMC - PubMed
    1. Frasca D, Blomberg BB. B Cell-Specific Biomarkers for Optimal Antibody Responses to Influenza Vaccination and Molecular Pathways That Reduce B Cell Function with Aging. Crit Rev Immunol. 2016;36(6):523–37. 10.1615/CritRevImmunol.2017020113 - DOI - PMC - PubMed
    1. Frasca D, Diaz A, Romero M, Landin AM, Blomberg BB. High TNF-alpha levels in resting B cells negatively correlate with their response. Exp Gerontol. 2014;54:116–22. 10.1016/j.exger.2014.01.004 - DOI - PMC - PubMed
    1. Lindholm E, Bakhtadze E, Cilio C, Agardh E, Groop L, Agardh CD. Association between LTA, TNF and AGER polymorphisms and late diabetic complications. PLoS One. 2008;3(6):e2546 10.1371/journal.pone.0002546 - DOI - PMC - PubMed
    1. Mundy GR. Osteoporosis and inflammation. Nutr Rev. 2007;65(12 Pt 2):S147–51. 10.1111/j.1753-4887.2007.tb00353.x . - DOI - PubMed

Publication types

MeSH terms