. 2019 Sep 19;47(16):8470-8484.
doi: 10.1093/nar/gkz593.

Super-resolution microscopy reveals how histone tail acetylation affects DNA compaction within nucleosomes in vivo

Affiliations

Super-resolution microscopy reveals how histone tail acetylation affects DNA compaction within nucleosomes in vivo

Jason Otterstrom et al. Nucleic Acids Res. .

Abstract

Chromatin organization is crucial for regulating gene expression. Previously, we showed that nucleosomes form groups, termed clutches. Clutch size correlated with the pluripotency grade of mouse embryonic stem cells and human induced pluripotent stem cells. Recently, it was also shown that regions of the chromatin containing activating epigenetic marks were composed of small and dispersed chromatin nanodomains with lower DNA density compared to the larger silenced domains. Overall, these results suggest that clutch size may regulate DNA packing density and gene activity. To directly test this model, we carried out 3D, two-color super-resolution microscopy of histones and DNA with and without increased histone tail acetylation. Our results showed that lower percentage of DNA was associated with nucleosome clutches in hyperacetylated cells. We further showed that the radius and compaction level of clutch-associated DNA decreased in hyperacetylated cells, especially in regions containing several neighboring clutches. Importantly, this change was independent of clutch size but dependent on the acetylation state of the clutch. Our results directly link the epigenetic state of nucleosome clutches to their DNA packing density. Our results further provide in vivo support to previous in vitro models that showed a disruption of nucleosome-DNA interactions upon hyperacetylation.


Figures

Figure 1.
Figure 1.
EdC labeling enables super-resolution imaging of DNA structure. (A) Cropped nuclear super-resolution images of EdC labeled DNA in control (upper) and TSA-treated (lower) human BJ fibroblast cells rendered using the conventional rendering in which localizations are represented as Gaussians with a fixed width (9 nm). Overlapping Gaussians add up to give rise to higher intensity. (B) Super-resolution Voronoi tessellation image of DNA in control (upper) and TSA-treated (lower) fibroblasts quantitatively showing the local variations in DNA density with increased dynamic range. Voronoi polygons are color-coded according to the density (inverse of the polygon area) following the color scale bar (from 0.02 nm−2 in yellow to 0.001 nm−2 in blue; the largest 0.5% of the polygons are colored black). (C) A zoom up of the region within the squares in (B). (D) Cumulative distribution of the Voronoi Polygon densities in control (green) (N = 6 cells) and TSA-treated (magenta) (N = 9 cells) fibroblasts. The light colors show the interquartile range (25–75 percentiles) and the thick, dark lines show the median values; stars indicate statistical significance of the separation between the median of the medians according to Kolmogorov–Smirnoff test with P = 0.0022.
Figure 2.
Figure 2.
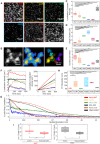
2D super-resolution imaging of H2B with alternative super-resolution compatible dyes. (A) Representative 2D super-resolution images of the histone H2B obtained using fluorophores AlexaFluor647, Cy3B, AlexaFluor568, Atto488, AlexaFluor750 or DNA-PAINT super-resolution imaging. PAINT was performed exclusively using a dye excited by 560 nm laser light. (B) (left) Zoom up of the region inside the purple square; (middle) Gaussian-based rendering of the same region as a density image from low (cyan) to high (yellow) density and the super-resolution localizations (red); (right) Result of the cluster analysis, each cluster identified using the cluster analysis is color-coded with a different color. In some cases, colors repeat such that distinct clusters may by chance have the same color. We refer to the group of clusters that are in close proximity as ‘islands’ of clusters. (C) Percentage of nuclear area occupied by localizations in super-resolution images of H2B recorded using different fluorophores or PAINT super-resolution imaging. The occupancy was calculated by first binning localizations into grids having either a 20 nm super-resolved or a 160 nm diffraction-resolved pixel size. Then the ratio of the summed area occupied with the 20 nm size to the summed area occupied with 160 nm size was calculated and converted to percentage. (D) The percentage of isolated, single H2B clusters (i.e. clusters identified to be the only cluster within an ‘island’, see panel B) relative to the total number of H2B clusters identified following cluster analysis of SMLM image data using different fluorophores or PAINT. (E) Number of clusters per ‘island’ (panel B) in super-resolution images of H2B recorded using different fluorophores or PAINT. (F) (left) Number of localizations per unit area in each frame or (right) cumulative number of localizations per unit area over time during acquisition of raw SMLM image data. H2B was imaged with different fluorophores in STORM or PAINT techniques and the aforementioned localization densities are plotted for a time duration of 600 s. (G) Fourier correlation ring (FRC) analysis (35) of the spatial correlations computed from the H2B super-resolution images obtained using different fluorophores in STORM or PAINT SMLM imaging techniques. (H) Box plot showing the final image resolution in nm computed from the FRC analysis for each fluorophore or PAINT imaging. The best resolution was obtained for AlexaFluor647, AlexaFluor568 and PAINT. However, AlexaFluor568 gave rise to sparse images (see A, above) in agreement with its FRC plot that shows little long-range structural information in contrast with the AlexaFluro647 and PAINT curves. For box plots in panels C, D, E and H, the box indicates the 25–75th interquartile ranges, the horizontal bar shows the median, the central dot indicates the mean and the whiskers are the min/max values. Note, the P-value comparing FRC resolution of AlexaFluor647 to AlexaFluor568 in panel H was 0.063. (I) Number of localizations per cluster measured from super-resolution images of H2B recorded using AlexaFluor647 (left) and PAINT super-resolution imaging (right).
Figure 3.
Figure 3.
DNA co-localizes with H2B to a lesser extent in TSA-treated cells compared to untreated cells. (A) Cropped nuclear super-resolution image in human Fibroblasts of EdC-labeled DNA (cyan) and PAINT image of H2B labeled with anti-H2B antibodies (orange) and the overlay. A zoom of the region inside the yellow box is shown. (B) (left) A zoom of the region shown inside the yellow square, (right) scheme of the analysis of clutch-bound DNA. The centers of H2B clusters (stars) are the seeds for the Voronoi polygons (blue) inside which the DNA localizations (black dots) are distributed. Overlaid on top are concentric circles whose radii increase by 10 nm steps. (C) Percentage of DNA localizations associated to clutches in wild-type (N = 4, green) and TSA-treated (N = 5, magenta) fibroblasts for a circle of radius 120 nm bounded by Voronoi polygons (P-value 0.0441). (D) Cumulative DNA density inside circles of increasing search radii in untreated (green) and TSA-treated (magenta) cells. The dots correspond to the mean, the bars correspond to the standard deviations: the lines connect sequential points and are guides to the eye.
Figure 4.
Figure 4.
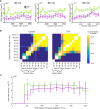
Nucleosome clutch associated DNA undergoes decompaction in TSA-treated cells: (A) DNA density in a bound circle of increasing size (30–100 nm) versus cluster (clutch) size measured as area in nm2. TSA treated clusters (magenta) have lower density than control clusters (green) independent of cluster size. The line corresponds to the mean of clusters; the bars correspond to the standard deviations. (B) Similarity matrix for untreated (left) and TSA-treated (right) cells showing the level of similarity in DNA density within 10 nm discs of increasing radii. The similarity was calculated as a P-value from Kruskalwallis test and is shown as a color coding corresponding to the color scale bar (from P = 0.0001 in blue to P = 0.05 in yellow). The diagonal was set to white and not calculated. Cyan and red lines show the boundary of a switch from low to high similarity in untreated and TSA treated cells, respectively. (C) Mean DNA density ± standard deviation as a function of clutch nearest neighbor distance (NND) for untreated (green) and TSA-treated (magenta) cells calculated for a circle of radius 70 nm. The bars show the standard deviation.
Figure 5.
Figure 5.
Acetylation changes clutch size and the packing density of clutch DNA. Cartoon model of nucleosomal DNA decompaction upon hyperacetylation. Nucleosome clutches become smaller (see Figure 2I, Figure 3A, B and Supplementary Figure S4A, B), likely due to a combination of large clutches opening and splitting and nucleosome loss. Clutches also compact ‘clutch’ DNA to a lesser extend in hyperacetylated cells (see Figure 3D and Figure 4B). These changes are particularly prominent in highly folded regions of the chromatin containing multiple nucleosome clutches in close proximity (see Figure 4C), suggesting that clutches may influence DNA compaction of neighboring clutches.

References

    1. Cremer T., Cremer M.. Chromosome territories. Cold Spring Harbor Perspect. Biol. 2010; 2:a003889. - PMC - PubMed
    1. Cremer T., Cremer M., Cremer C.. The 4D nucleome: genome compartmentalization in an evolutionary context. Biochemistry (Biokhimiia). 2018; 83:313–325. - PubMed
    1. Thoma F., Koller T., Klug A.. Involvement of histone H1 in the organization of the nucleosome and of the salt-dependent superstructures of chromatin. J. Cell Biol. 1979; 83:403–427. - PMC - PubMed
    1. Fussner E., Strauss M., Djuric U., Li R., Ahmed K., Hart M., Ellis J., Bazett-Jones D.P.. Open and closed domains in the mouse genome are configured as 10-nm chromatin fibres. EMBO Rep. 2012; 13:992–996. - PMC - PubMed
    1. Joti Y., Hikima T., Nishino Y., Kamada F., Hihara S., Takata H., Ishikawa T., Maeshima K.. Chromosomes without a 30-nm chromatin fiber. Nucleus (Austin, Tex.). 2012; 3:404–410. - PMC - PubMed

Publication types