. 2019 Jul 8;36(1):17-34.e7.
doi: 10.1016/j.ccell.2019.06.005.

Pan-cancer Convergence to a Small-Cell Neuroendocrine Phenotype that Shares Susceptibilities with Hematological Malignancies

Affiliations

Pan-cancer Convergence to a Small-Cell Neuroendocrine Phenotype that Shares Susceptibilities with Hematological Malignancies

Nikolas G Balanis et al. Cancer Cell. .

Abstract

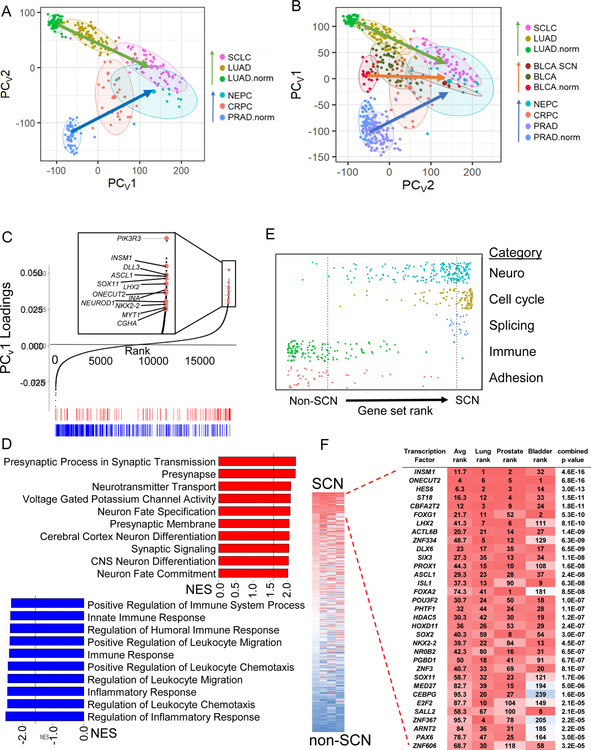
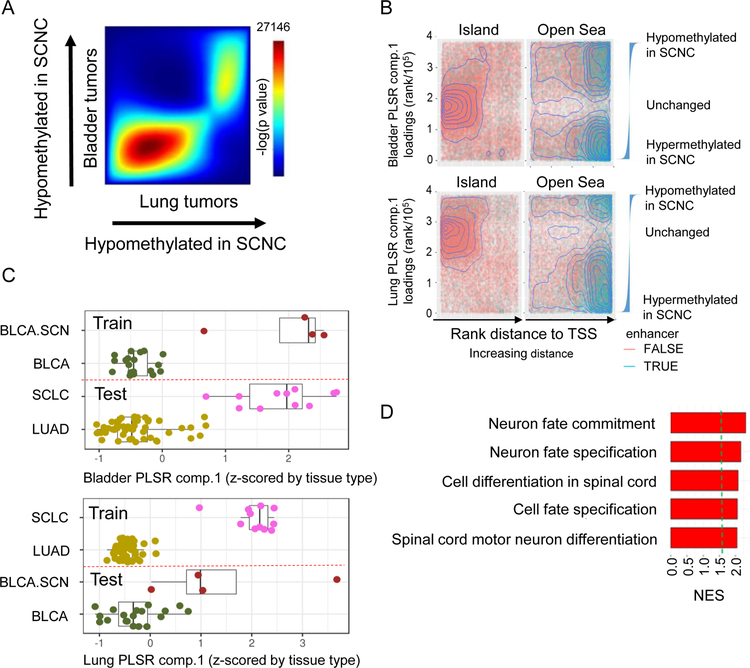
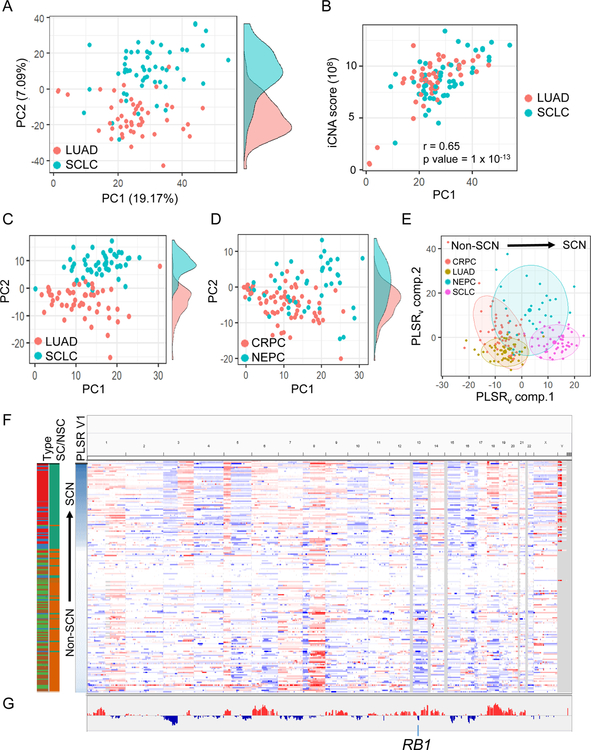
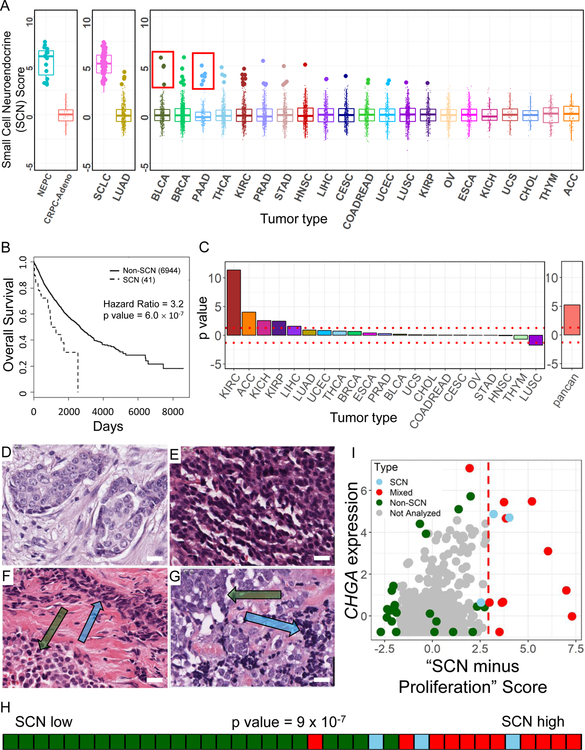
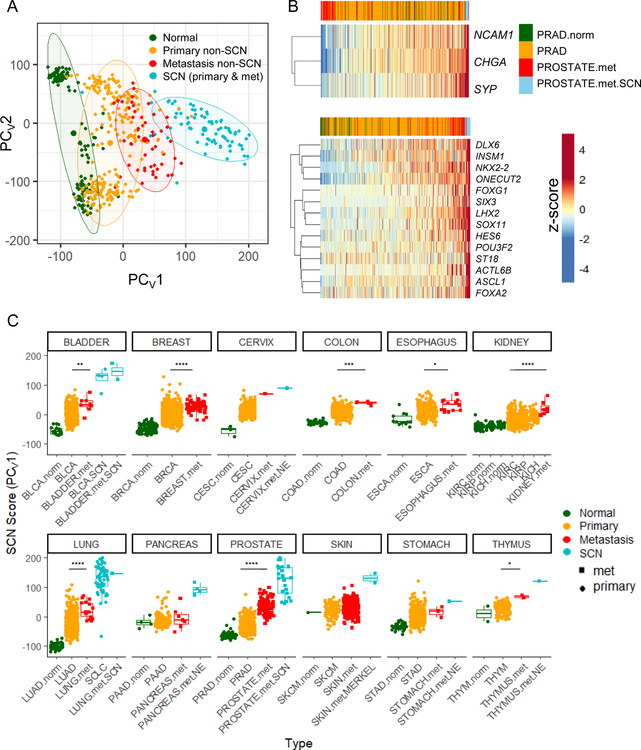
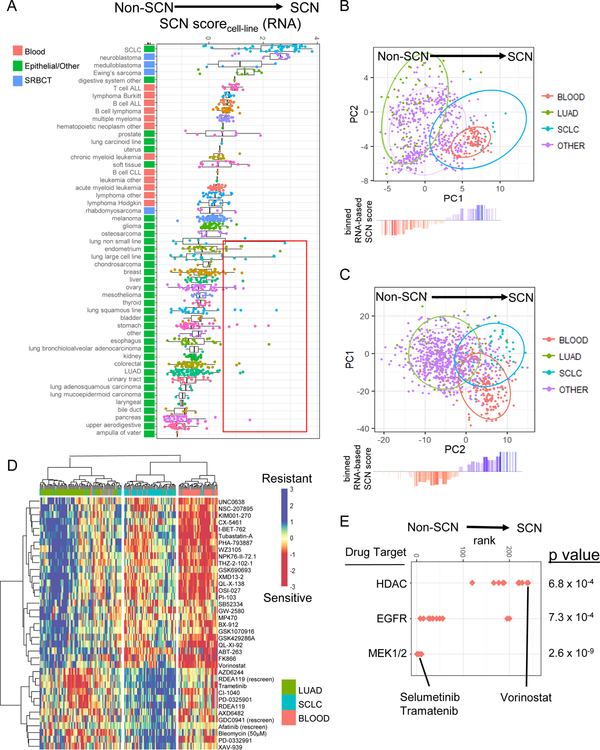
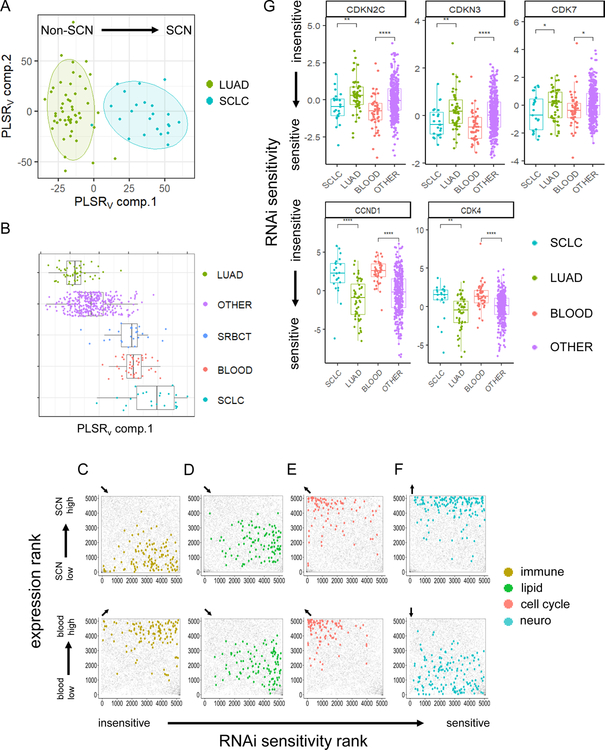
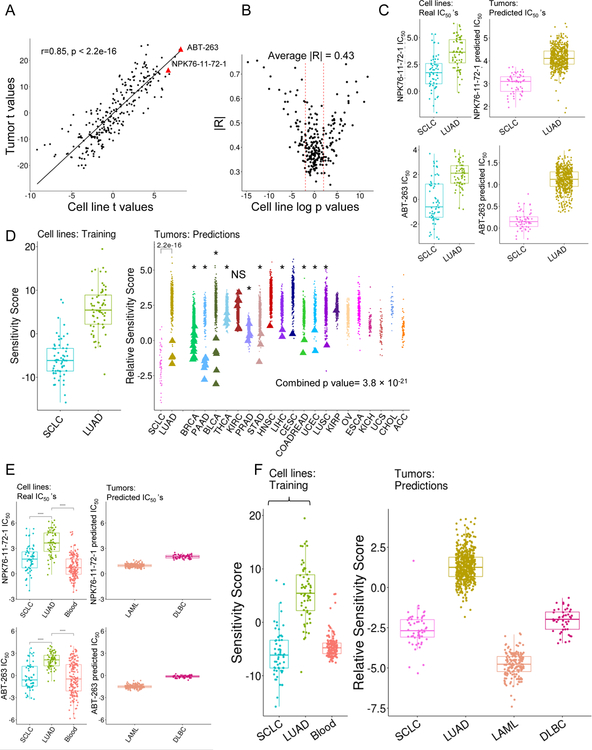
Small-cell neuroendocrine cancers (SCNCs) are an aggressive cancer subtype. Transdifferentiation toward an SCN phenotype has been reported as a resistance route in response to targeted therapies. Here, we identified a convergence to an SCN state that is widespread across epithelial cancers and is associated with poor prognosis. More broadly, non-SCN metastases have higher expression of SCN-associated transcription factors than non-SCN primary tumors. Drug sensitivity and gene dependency screens demonstrate that these convergent SCNCs have shared vulnerabilities. These common vulnerabilities are found across unannotated SCN-like epithelial cases, small-round-blue cell tumors, and unexpectedly in hematological malignancies. The SCN convergent phenotype and common sensitivity profiles with hematological cancers can guide treatment options beyond tissue-specific targeted therapies.

Keywords: Dependency Map (depmap); RNA interference screen; SCLC; TCGA; blood cancer; drug sensitivity screen; pan-cancer signatures; pharmacogenomics; small-cell neuroendocrine; transdifferentiation.


Conflict of interest statement

Declaration of Interests

ONW currently has consulting, equity, and/or board relationships with Trethera Corporation, Kronos Biosciences, Sofie Biosciences, and Allogene Therapeutics. None of these companies contributed to or directed any of the research reported in this article.

Figures

Figure 1.
Figure 1.. Pan-cancer convergence of SCN carcinoma.
(A) Varimax-rotated PCA (PCAv) of adjacent normal (norm), adenocarcinoma, and SCNC for lung and prostate patient tumors. Ellipses represent 80% confidence regions. (B) PCAv of samples in (A) and bladder patient tumor data. TCGA BLCA includes 4 SCN samples that were labeled separately (BLCA.SCN). PC1 and PC2 are reversed to show the SCN signature on the x-axis as in panel A. (C) Gene loadings and selected top SCN-related genes of the varimax-rotated first principal component of the PCA (PCV1) of panel A. Enrichment analysis (GSEA) was run on this ranked gene list. Shown along the bottom are the top gene sets in the ‘neuro’ (red) and ‘immune’ (blue)categories, also shown in panel D. (D) Top 10 gene sets from ‘neuro’ and ‘immune’ gene setcategories. Lines mark false discovery rate (FDR) q value of 0.05. (E) Distribution of gene sets from the C5 MSigDB collection ranked by normalized enrichment score (NES). All listed categories enrichments are nominally significant (p value < 0.001) by Kolmogorov-Smirnov test. Dashed lines mark FDR q-value < 0.05 for individual gene sets in each direction. (F) Average rank ordering of VIPER activities across the three tissue types (left) and zoom in to top of rank based inferred activity in each cancer separately (right). Combined p value across the three tissues by Stouffer’s method. See also Figure S1 and Table S1
Figure 2.
Figure 2.. An epigenetic basis for the shared SCN gene expression signature.
(A) RRHO heat map of lung and bladder SCN signatures defined by PLSR loadings. Number shown is the maximum -log10(p value) of the RRHO heatmap. (B) Enrichment analysis of methylation sites that define the lung or bladder SCN versus non-SCN dichotomy (random, representative sample of 100K sites shown for visibility). X-axis is the increasing (arrows) rank distance of the CG site from the nearest TSS. Y-axis is the rank value of individually-run lung or bladder PLSR component 1 loadings, thus extreme values represent sites with differential methylation between SCN and non-SCN tumors. Waterfall plots show the relative values of the ranked loadings. (C) PLSR analysis of DNA methylation data from patient bladder SCN and non-SCN tumor samples, and projection of lung LUAD and SCLC tumor samples onto this framework, or vice versa. PLSR component 1 is z-scored by tissue type. Dashed red lines separate training data (above line) from testing data (below line). Lines inside boxplots represent the 25th, 50th, and 75th quantiles. Whiskers extend to 1.5 the interquartile range. (D) Top 5 enrichment analysis (GSEA) terms for genes hypomethylated in SCN (averaged lung, prostate, and bladder PLSR component 1 loadings). Dashed green line is at FDR p value = 0.05. See also Figure S2.
Figure 3.
Figure 3.. SCNCs of lung and prostate origin share DNA copy number alteration patterns.
(A) PCA on lung CCLE cell line CNA profiles. (Side tracks are density plots of points along PC2) (B) Cell line PC1 score reflects degree of aneuploidy (integrated CNA (iCNA) score). (C) Projection of lung tumors onto the cell line PCA of panel A. LUAD category randomly down-sampled for clarity. Cell lines are from the same batch. (D) Projection of prostate tumors onto PCA of panel A. (E) PLSR of lung and prostate tumor CNA profiles, regressed on SCN or non-SCN status. LUAD category randomly down-sampled to match numbers in other categories. (F) Genome-wide view of CNA patterns. Each row is a tumor sample: SCLC-red, LUAD-light green, NEPC-blue, CRPC-brown; SC-green, non-SC (NSC)-orange. (G) Visualization of copy number changes that are observed in both lung and prostate SCNC signatures. Each cancer type was analyzed by PLSR independently and then combined. Y-axis represents the mean of the concordant PLSR loadings. See also Table S2.
Figure 4.
Figure 4.. Pan-cancer identification of primary tumors with an SCN signature.
(A) Gene expression-based prediction of SCN phenotype in epithelial TCGA patient tumors. Predictions made by projection onto PCv1 from Figure 1A. For each cancer type, samples greater than 3 standard deviations from the mean are highlighted as enlarged data points. Red inset boxes indicate known cases of non-SCN PNETS in the TCGA PAAD cohort (6 of 8; 2 missed are just subthreshold) and SCNCs in BLCA (3 of 4, 1 missed is the next sample subthreshold). Cancer types in rightmost box are left-right sorted based on the average of top 3 scores per cancer type. Lines inside boxplots represent the 25th, 50th, and 75th quantiles. Whiskers extend to 1.5 the interquartile range. (B) Kaplan-Meier overall survival analysis for predicted SCN versus non-SCN cases from TCGA epithelial cancers (samples in panel A right box plus LUAD; PAAD, SCLC, NEPC and CRPC-Adeno not included). P value is calculated controlling for tumor type. (C) P values from a Cox regression survival analysis in individual cancer types using the continuous SCN score (left), and pan-cancer Cox regression using the continuous score, accounting for cancer type (right). (D-G) TCGA BRCA hematoxylin and eosin (H&E) stained diagnostic slides of invasive ductal carcinoma (D; TCGA-D8-A1XD), small cell neuroendocrine carcinoma (E; TCGA-BH-A0HL), mixed tumor with components of invasive ductal carcinoma (lower left, green arrow) and small cell neuroendocrine carcinoma (upper right, blue arrow) (F; TCGA-E9-A245), mixed tumor with components of large cell neuroendocrine carcinoma (upper left, green arrow) and small cell neuroendocrine carcinoma (lower right, blue arrow) (G; TCGA-A1-A0SK). Scale bars in images represent approximately 20 µm. (H) Rug plot and Kolmogorov-Smirnov enrichment p value of breast cases scored by pathologist for SCN features ordered by their proliferation-removed SCN score. (I) Scatter plot of all samples in TCGA BRCA cohort. (x-axis: Proliferation removed SCN score; y-axis: Z-scored Chromogranin A expression. Cases to the right of the dashed red line, x=3, were computationally predicted as SCN-like). See also Figures S3, S4 and Table S3.
Figure 5.
Figure 5.. Metastases across multiple tissue types have increased expression of SCN features.
(A) Projection of lung, prostate, bladder normal tissue, primary and metastatic non-SCN tumor samples, and SCN tumor samples onto the PCA framework of Figure 1A. Centroids and 80% confidence regions for the indicated groups are displayed. Here, the pancreatic, cervix, stomach, and thymus blue samples are those annotated with a neuroendocrine (NE)-related term in Robinson et al., 2017. (B) Heatmap of the expression of canonical SCN marker genes (top) and key SCN transcription factor genes (bottom) for prostate normal, primary adeno, metastatic adeno, and metastatic SCN. Samples ordered from left to right by the sum z-score of the genes displayed, as indicated at the top of the heatmaps. (C) Pan-cancer projections onto framework of Figure 1A. Data are from TCGA normal samples, TCGA primary tumors, MET500 metastatic tumors, SCLC tumors (George et al., 2015), and CRPC and NEPC tumors (Beltran et al., 2016). Plotted are the PCV1 values, representing SCN score. The SKIN.met cohort has two sources, the TCGA and MET500 databases. Wilcoxon-Mann-Whitney p values are shown comparing primary (orange) and metastatic (red) cases. * p < 0.05, ** p < 0.01, *** p < 0.001, **** p < 0.0001. Lines inside boxplots represent the 25th, 50th, and 75th quantiles. Whiskers extend to 1.5 the interquartile range. See also Figure S5.
Figure 6.
Figure 6.. Blood cancers have SCN-like gene and protein expression profiles and drug sensitivities.
(A) Cell line gene expression SCN score (component 1 score of projection on PLSR of LUAD and SCLC lines). Z-score adjusted across all cell line samples together. Cancer types top-bottom sorted based on average SCN score per type. Red box: Non-SCN annotated epithelial lines with strong SCN score. Lines inside boxplots represent the 25th, 50th, and 75th quantiles. Whiskers extend to 1.5 the interquartile range. (B) Protein profile of blood cell lines, from projection onto PCA of LUAD and SCLC lines. (C) Drug sensitivity profile of blood cell lines, from projection onto PCA of IC50 values for LUAD and SCLC lines. Ellipses represent 80% confidence regions. In panels B and C, waterfall plots show binned gene expression SCN score of projected cell lines. (D) Heatmap of drugs with differential sensitivity between LUAD and SCLC cell lines (t-test p value < 0.0001). Hierarchical clustering is done on IC50 measurements for LUAD, SCLC, and blood lines. (E) Enrichment of drug targets for drugs more effective in LUAD or SCLC lines. Kolmogorov Smirnov test p values. See also Figures S6–S7 and Table S4.
Figure 7.
Figure 7.. Validation of shared vulnerabilities based on genome-scale functional RNAi screens.
(A) Varimax-rotated PLSR model trained on the genome-scale RNAi sensitivity values for LUAD and SCLC cell lines. Ellipses represent 80% confidence regions. (B) Prediction of RNAi sensitivity profile for blood, SRBCTs, and all other cell lines in the dataset. SCN sensitivity score based on projection to the varimax PLSR component 1 from panel A (which included LUAD and SCLC). (C-F) Comparison of gene set expression rank to gene set sensitivity rank for cell line SCLC versus LUAD (top) and blood versus non-blood (bottom) for gene sets containing selected keywords. Gene set RRHO scatter plots are subcategorized and colored by immune (C), lipid (D), cell cycle (E), and neuro (F) gene sets, with all other gene sets colored gray. Arrows in top left corner of individual panels indicate direction of significance (q < 0.01) by Kolmogorov-Smirnov test (diagonal arrows indicate significance in both expression and sensitivity directions; Benjamani-Hochberg correction). (G) Select targets with differential SCLC versus LUAD and blood versus non-blood RNAi sensitivity. The y-axis (RNAi sensitivity) is the published Demeter score. Student’s t-test p values. * p < 0.1, ** p < 0.01, *** p < 0.001, **** p < 0.0001. Lines inside boxplots represent the 25th, 50th, and 75th quantiles. Whiskers extend to 1.5 the interquartile range. See also Figure S8 and Table S5.
Figure 8.
Figure 8.. Tumors recapitulate SCN and blood cell line sensitivity signatures.
(A) Scatter plot of t-values from t-test of true IC50 values of SCLC versus LUAD in cell lines (x-axis) and predicted IC50 values in tumors (y–axis). (B) Comparison of cross validation model R2 values (cell line-based) to signed log p values of cell line SCLC versus LUAD true drug sensitivities (IC50). R2 values are from true cell line drug sensitivities versus cross validation-based predicted cell line sensitivities. Dashed lines are p value 0.05 (log p value = 1.3). (C) Real and predicted sensitivities for NPK76-II-72–1 and ABT-263. Y-axis is the log IC50. (D) Projection of RNA-seq, ENET-based predicted sensitivities of epithelial tumors onto PCA framework of SCLC and LUAD cell lines. More negative “Relative Sensitivity Scores” correspond to more SCN-like drug sensitivity profiles. Asterisks (*) denote individual tumor type significance by Kolmogorov Smirnov test, NS = not significant. SCLC and LUAD tumor predicted sensitivity compared via a Wilcoxon-Mann-Whitney test (p < 2.2 × 10 −16). Combined p value calculated with Stouffer’s test. (E) Real and predicted sensitivities of NPK76-II-72–1 and ABT-263 for blood tumors. Y-axis is the log IC50. (F) Projection of ENET-based sensitivities of epithelial tumors and blood tumors onto PCA framework of SCLC and LUAD cell lines (open bracket); combined p value from Stouffer’s test. More negative “Relative Sensitivity Scores” correspond to more SCN-like drug sensitivity profiles. Lines inside boxplots represent the 25th, 50th, and 75th quantiles. Whiskers extend to 1.5 the interquartile range. See also Table S6.

Comment in

Similar articles

Cited by

References

    1. Alanee S, Moore A, Nutt M, Holland B, Dynda D, El-Zawahry A, and McVary KT (2015). Contemporary Incidence and Mortality Rates of Neuroendocrine Prostate Cancer. Anticancer Res 35, 4145–4150. - PubMed
    1. Alvarez MJ, Shen Y, Giorgi FM, Lachmann A, Ding BB, Ye BH, and Califano A (2016). Functional characterization of somatic mutations in cancer using network-based inference of protein activity. Nat. Genet 48, 838–847. - PMC - PubMed
    1. Alvarez MJ, Subramaniam PS, Tang LH, Grunn A, Aburi M, Rieckhof G, Komissarova EV, Hagan EA, Bodei L, Clemons PA, et al. (2018). A precision oncology approach to the pharmacological targeting of mechanistic dependencies in neuroendocrine tumors. Nat. Genet 50, 979–989. - PMC - PubMed
    1. Barbie DA, Tamayo P, Boehm JS, Kim SY, Moody SE, Dunn IF, Schinzel AC, Sandy P, Meylan E, Scholl C, et al. (2009). Systematic RNA interference reveals that oncogenic KRAS-driven cancers require TBK1. Nature 462, 108–112. - PMC - PubMed
    1. Barretina J, Caponigro G, Stransky N, Venkatesan K, Margolin AA, Kim S, Wilson CJ, Lehár J, Kryukov GV, Sonkin D, et al. (2012). The Cancer Cell Line Encyclopedia enables predictive modelling of anticancer drug sensitivity. Nature 483, 603–307. - PMC - PubMed

Publication types

MeSH terms