. 2019 Jul 8;36(1):35-50.e9.
doi: 10.1016/j.ccell.2019.05.013.

Genomic and Transcriptomic Determinants of Therapy Resistance and Immune Landscape Evolution during Anti-EGFR Treatment in Colorectal Cancer

Affiliations

Genomic and Transcriptomic Determinants of Therapy Resistance and Immune Landscape Evolution during Anti-EGFR Treatment in Colorectal Cancer

Andrew Woolston et al. Cancer Cell. .

Abstract

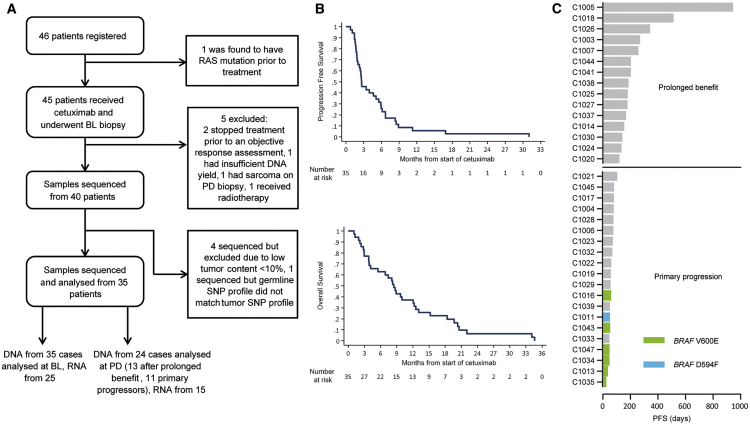
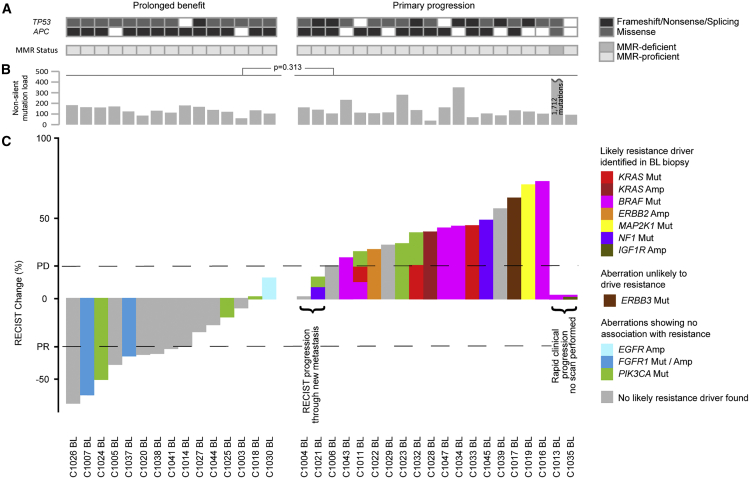
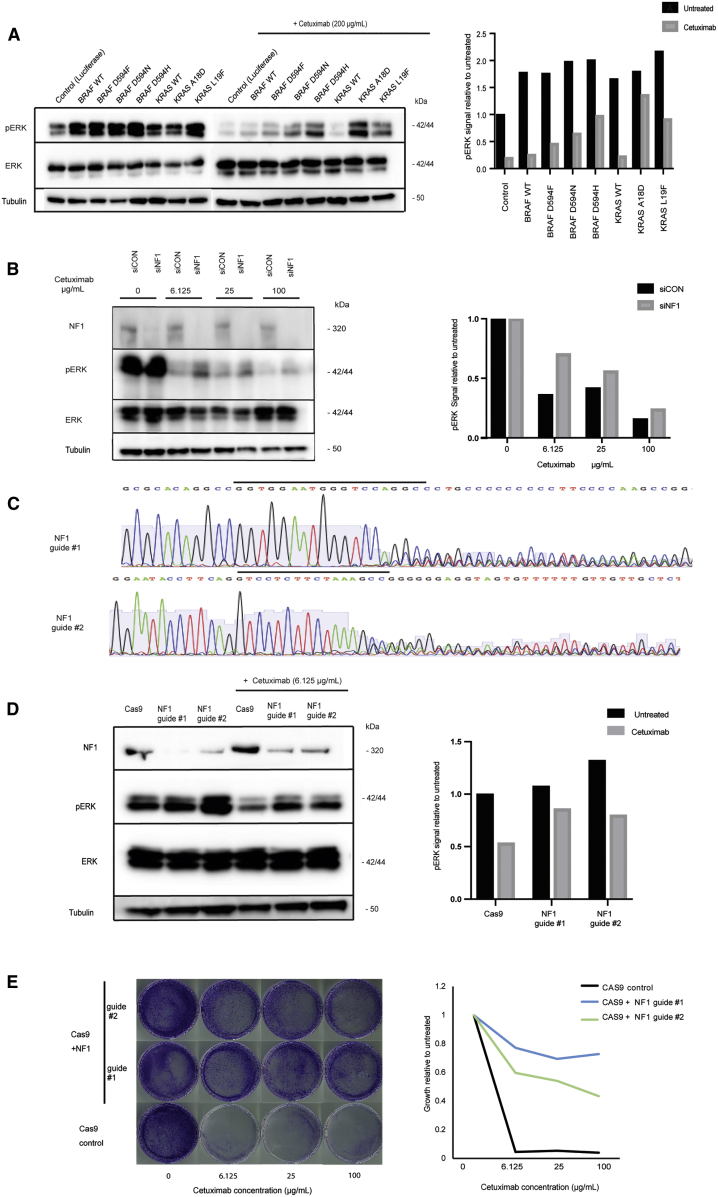
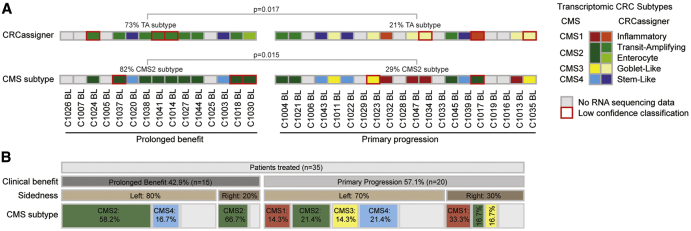
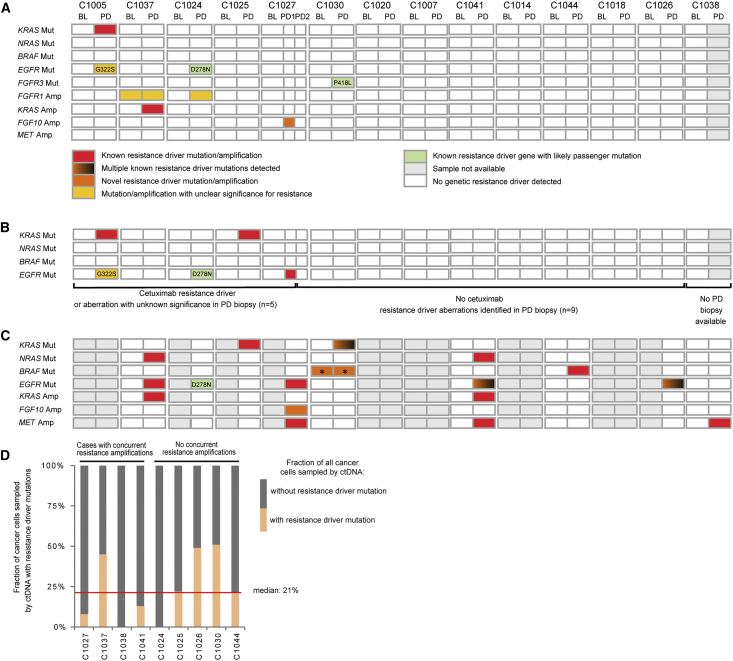
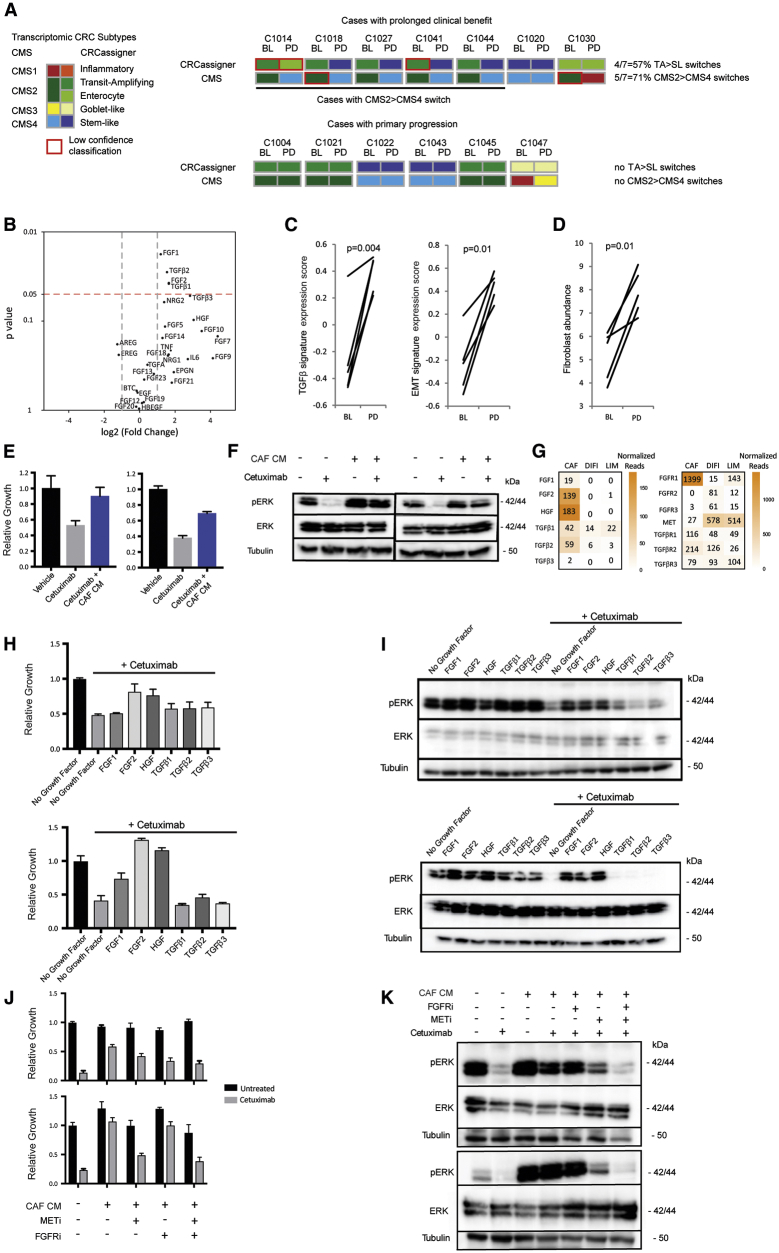
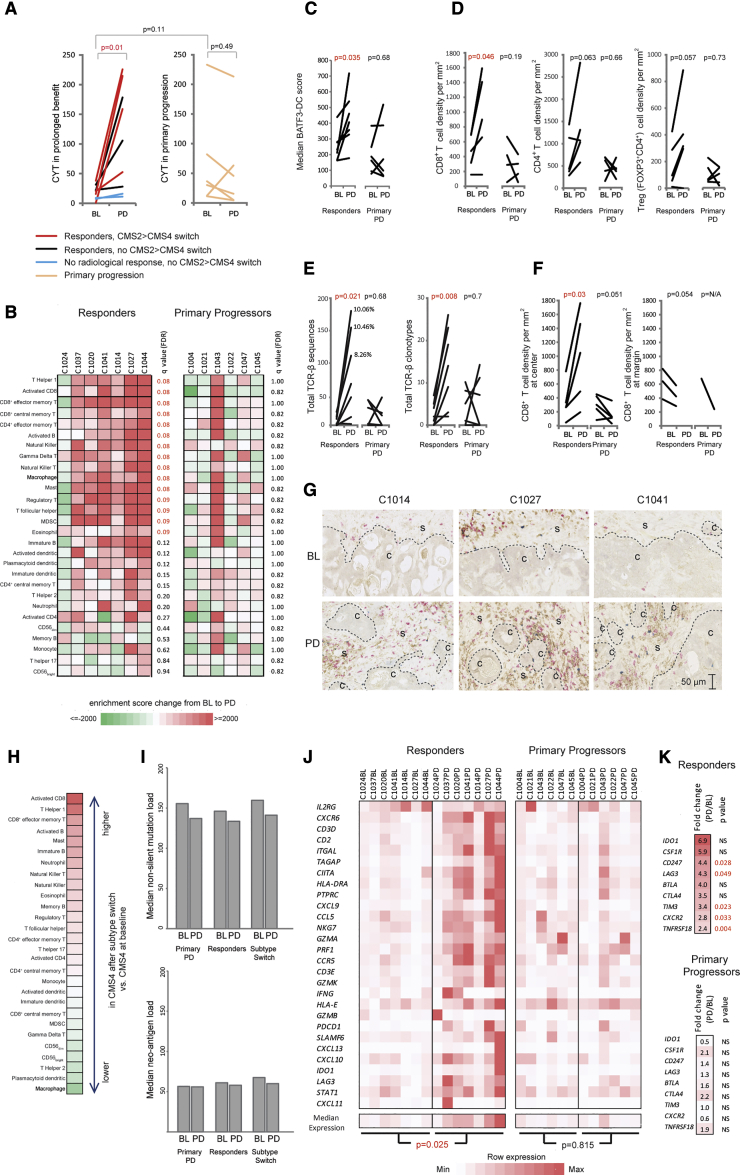
Despite biomarker stratification, the anti-EGFR antibody cetuximab is only effective against a subgroup of colorectal cancers (CRCs). This genomic and transcriptomic analysis of the cetuximab resistance landscape in 35 RAS wild-type CRCs identified associations of NF1 and non-canonical RAS/RAF aberrations with primary resistance and validated transcriptomic CRC subtypes as non-genetic predictors of benefit. Sixty-four percent of biopsies with acquired resistance harbored no genetic resistance drivers. Most of these had switched from a cetuximab-sensitive transcriptomic subtype at baseline to a fibroblast- and growth factor-rich subtype at progression. Fibroblast-supernatant conferred cetuximab resistance in vitro, confirming a major role for non-genetic resistance through stromal remodeling. Cetuximab treatment increased cytotoxic immune infiltrates and PD-L1 and LAG3 immune checkpoint expression, potentially providing opportunities to treat cetuximab-resistant CRCs with immunotherapy.

Keywords: EGFR; cancer evolution; cancer genomics; cancer-associated fibroblasts; cetuximab; colorectal cancer; drug resistance mechanisms; immunotherapy; molecular subtype; predictive biomarker.


Figures

Figure 1
Figure 1
CONSORT Diagram and Survival Data (A) CONSORT diagram of 46 patients (pts) included and biopsy samples analyzed. BL, baseline; PD, progressive disease. (B) Kaplan-Meier survival analysis of 35 pts whose samples were subjected to molecular analysis. (C) Swimmer plot of progression-free survival (PFS) data and separation into pts with prolonged benefit and with primary progression. See also Tables S1 and S2.
Figure 2
Figure 2
Molecular Profiles of 35 BL Biopsies Categorized into Cases with Prolonged Cetuximab Benefit and Primary Progressors (A) TP53 and APC mutations and microsatellite instability status. (B) Non-silent mutation load. The p value was calculated using the Student's t test. (C) Waterfall plot of best radiological response and genetic aberrations of RAS/RAF pathway members or regulators and PIK3CA. Amp, amplification; Mut, mutation; PR, partial response; PD, progressive disease as per RECIST criteria. See also Data S1 and S2.
Figure 3
Figure 3
Functional Impact of RAS/RAF Mutations and NF1 Inactivation on Cetuximab Sensitivity (A) Western blot of BRAF and KRAS mutants in DiFi cells. Quantification of pERK signal relative to total ERK as a loading control, and normalized to luciferase control. (B) Western blot following NF1 (siNF1) or control (siCON) small interfering RNA in LIM1215 cells. Quantification of pERK signal relative to total ERK, and normalized to untreated control. (C) Sanger sequencing of LIM1215 cells transduced with two CRISPR guide RNAs against NF1. Guide sequences are highlighted by a black bar. (D) Western blot of CRISPR-inactivated NF1 and Cas9 control cells with/without 24 h cetuximab treatment. Quantification of pERK signal relative to total ERK and normalized to untreated Cas9 control. (E) Growth of CRISPR-inactivated NF1 and Cas9 control cells by crystal violet staining (left) and quantification (right).
Figure 4
Figure 4
Transcriptomic Subtypes of BL Biopsies Categorized into Cases with Prolonged Cetuximab Benefit and Primary Progressors (A) Transcriptomic subtype assignment. The figure legend for the transcriptomic subtypes is arranged to show the most similar CMS and CRCassigner subtypes next to each other. Significance was assessed by the Fisher's exact test. (B) Association of clinical benefit with tumor sidedness and CMS subtype. See also Figure S1.
Figure 5
Figure 5
Genetic Alterations in RAS/RAF Pathway Members and Regulators at AR in 14 Cases (A) Mutations/amps identified by exome sequencing (158×) of biopsies. (B) Mutations identified by deep amplicon sequencing (2,179×) of KRAS, NRAS, BRAF, and EGFR in biopsies; color key as in (Figure 5A). (C) Mutations/amps identified by circulating tumor DNA (ctDNA) sequencing (1,048×); color key as in (A); indicates present at BL but with substantial increase in mutation abundance at PD. (D) Fraction of cancer cells sampled by ctDNA that harbored a resistance driver mutation at PD. BL, baseline; PD, progressive disease. See also Figures S2, S3, Data S3, and Tables S4 and S5.
Figure 6
Figure 6
Transcriptomic CRC Subtypes and CAFs as Drivers of AR to Cetuximab (A) Transcriptomic subtypes in 13 BL and PD biopsy pairs. TA, transit amplifying; SL, stem-like. (B) Volcano plot showing differential expression of growth factors in 5 cases from (A) undergoing CMS2>4 switches. Significance was assessed by paired t test. (C) Changes in TGF-β and EMT transcriptomic signatures through CMS2>4 switches. (D) Changes in fibroblast abundance through CMS2>4 switches based on MCP-counter analysis. (E) Impact of CAF conditioned medium (CM) on the growth of DiFi (left panel) and LIM1215 (right panel) treated with 50 μg/mL CET for 5 days. (F) Western blot analysis showing CAF CM rescue of pERK in DiFi (left panel) and LIM1215 (right panel) treated with 200 μg/mL CET for 2 h. (G) mRNA expression (normalized counts) of growth factors (GFs) (left panel) and their receptors (right panel) in CAF, DiFi, and LIM1215 cells. (H) Growth assay with 200 μg/mL CET and recombinant GF at a concentration of 20 ng/mL (FGF1/2), 10 ng/mL (TGF-β) and 50 ng/mL (HGF) for 5 days in DiFi (top panel) and LIM1215 (bottom panel). (I) Western blot analysis of pERK with and without recombinant GF treatment in the presence or absence of 200 μg/mL CET in DiFi (top panel) and LIM1215 (bottom panel). (J) Growth assay with CAF CM and combinations of CET, pan-FGFR inhibitor (FGFRi), and MET inhibitor (METi) for 5 days in DiFi (top panel) and LIM1215 (bottom panel). (K) Western blot analysis of pERK after 2 h treatment with CAF CM and combinations of CET, FGFRi, and METi in DiFi (top panel) and LIM1215 (bottom panel). (E, H, and J) All error bars ± SD of six replicates. See also Figure S4 and Table S6.
Figure 7
Figure 7
Impact of CET on the Tumor Immune Landscape (A) Cytolytic activity (CYT) change in paired BL and PD biopsies. (B) Single sample gene set enrichment analysis enrichment-score change for 28 immune cell subtypes from BL to PD. (C) Transcriptomic score estimating the abundance of BATF3+ dendritic cells (BATF3-DC). (D) Immuno-histochemical quantification of immune cell densities in formalin-fixed paraffin-embedded specimens. (E) Changes in the number of T cell receptor beta chain (TCR-β) sequences (left) and of clonotypes (right) from BL to PD. Percentages indicate the abundance of the largest TCR-β clonotype in samples with ≥100 TCR-β sequences. (F) Analysis of immune cell densities in the tumor center and at the margin in slides from (D). (G) Example of immune infiltrates before and after CMS2>4 subtype switches (red, CD8; brown, CD4; blue, FOXP3; C, cancer cell area; S, stroma). (H) Differences in immune cell abundance in biopsies that acquired CMS4 following a subtype switch and biopsies showing CMS4 at BL. Values were generated by subtracting median enrichment scores between the two groups. Higher abundance following CMS2>4 switch in red, lower abundance in green; color scale as in (B). (I) Median mutation and neoantigen loads (based on NetMHC rank <0.5%) at BL and PD. (J) Expression of a 28-gene T cell-associated inflammation signature. (K) RNA expression changes of targetable immune checkpoints and cytokine receptors. Statistical significance was assessed with the Mann-Whitney test followed by false discovery rate correction in (B) and with the paired Student's t test in all other panels. See also Figure S5.

Comment in

References

    1. Allegra C.J., Rumble R.B., Hamilton S.R., Mangu P.B., Roach N., Hantel A., Schilsky R.L. Extended RAS gene mutation testing in metastatic colorectal carcinoma to predict response to anti-epidermal growth factor receptor monoclonal antibody therapy: American Society of Clinical Oncology Provisional Clinical Opinion Update 2015. J. Clin. Oncol. 2016;34:179–185. - PubMed
    2. Allegra, C.J., Rumble, R.B., Hamilton, S.R., Mangu, P.B., Roach, N., Hantel, A., and Schilsky, R.L.. (2016). Extended RAS gene mutation testing in metastatic colorectal carcinoma to predict response to anti-epidermal growth factor receptor monoclonal antibody therapy: American Society of Clinical Oncology Provisional Clinical Opinion Update 2015. J. Clin. Oncol. 34, 179-185. - PubMed
    1. Amado R.G., Wolf M., Peeters M., Van Cutsem E., Siena S., Freeman D.J., Juan T., Sikorski R., Suggs S., Radinsky R. Wild-type KRAS is required for panitumumab efficacy in patients with metastatic colorectal cancer. J. Clin. Oncol. 2008;26:1626–1634. - PubMed
    2. Amado, R.G., Wolf, M., Peeters, M., Van Cutsem, E., Siena, S., Freeman, D.J., Juan, T., Sikorski, R., Suggs, S., Radinsky, R., et al. (2008). Wild-type KRAS is required for panitumumab efficacy in patients with metastatic colorectal cancer. J. Clin. Oncol. 26, 1626-1634. - PubMed
    1. Angelova M., Mlecnik B., Vasaturo A., Bindea G., Fredriksen T., Lafontaine L., Buttard B., Morgand E., Bruni D., Jouret-Mourin A. Evolution of metastases in space and time under immune selection. Cell. 2018;175:751–765.e16. - PubMed
    2. Angelova, M., Mlecnik, B., Vasaturo, A., Bindea, G., Fredriksen, T., Lafontaine, L., Buttard, B., Morgand, E., Bruni, D., Jouret-Mourin, A., et al. (2018). Evolution of metastases in space and time under immune selection. Cell 175, 751-765.e16. - PubMed
    1. Arena S., Bellosillo B., Siravegna G., Martinez A., Canadas I., Lazzari L., Ferruz N., Russo M., Misale S., Gonzalez I. Emergence of multiple EGFR extracellular mutations during cetuximab treatment in colorectal cancer. Clin. Cancer Res. 2015;21:2157–2166. - PubMed
    2. Arena, S., Bellosillo, B., Siravegna, G., Martinez, A., Canadas, I., Lazzari, L., Ferruz, N., Russo, M., Misale, S., Gonzalez, I., et al. (2015). Emergence of multiple EGFR extracellular mutations during cetuximab treatment in colorectal cancer. Clin. Cancer Res. 21, 2157-2166. - PubMed
    1. Ayers M., Lunceford J., Nebozhyn M., Murphy E., Loboda A., Kaufman D.R., Albright A., Cheng J.D., Kang S.P., Shankaran V. IFN-gamma-related mRNA profile predicts clinical response to PD-1 blockade. J. Clin. Invest. 2017;127:2930–2940. - PMC - PubMed
    2. Ayers, M., Lunceford, J., Nebozhyn, M., Murphy, E., Loboda, A., Kaufman, D.R., Albright, A., Cheng, J.D., Kang, S.P., Shankaran, V., et al. (2017). IFN-gamma-related mRNA profile predicts clinical response to PD-1 blockade. J. Clin. Invest. 127, 2930-2940. - PMC - PubMed

Publication types

MeSH terms