. 2019 Sep;189(9):1814-1830.
doi: 10.1016/j.ajpath.2019.05.022. Epub 2019 Jul 6.

Liver-Specific, but Not Retina-Specific, Hepcidin Knockout Causes Retinal Iron Accumulation and Degeneration

Affiliations

Liver-Specific, but Not Retina-Specific, Hepcidin Knockout Causes Retinal Iron Accumulation and Degeneration

Bailey H Baumann et al. Am J Pathol. 2019 Sep.

Abstract

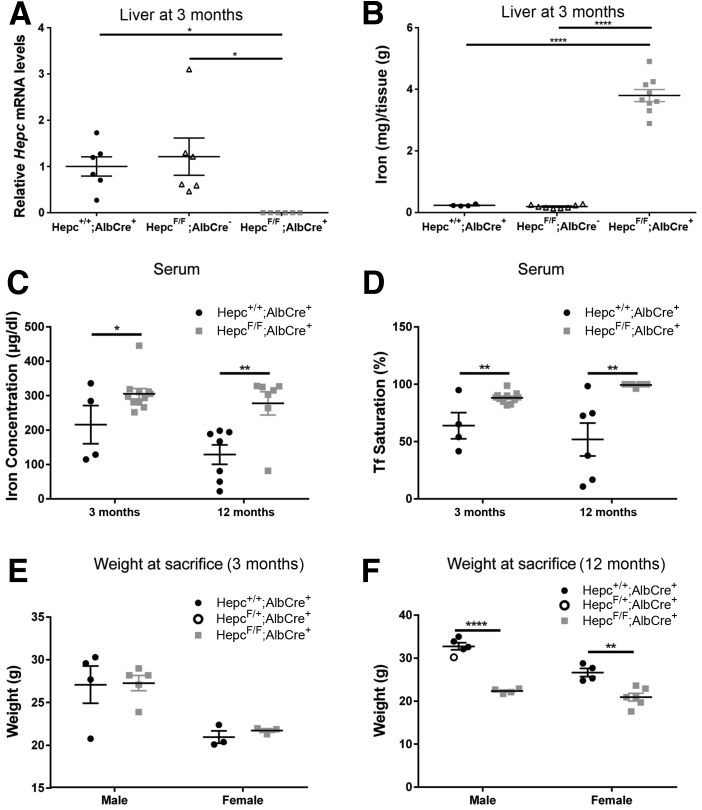
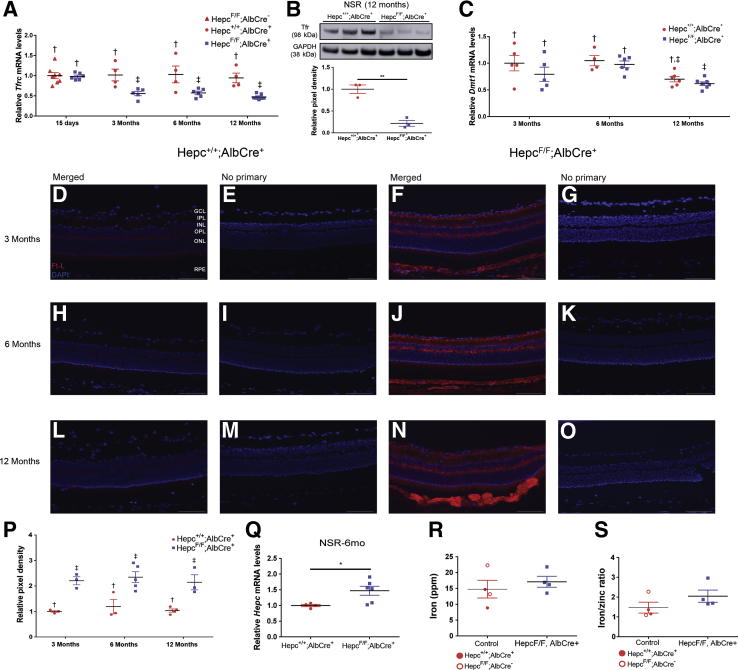
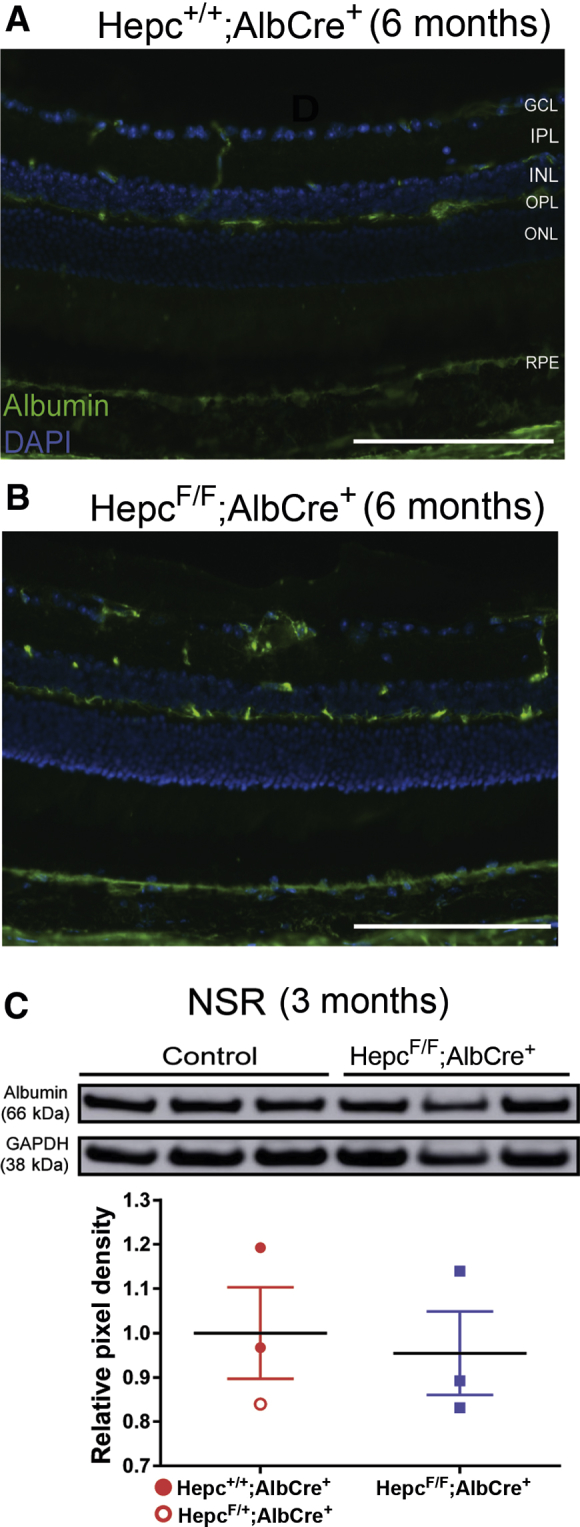
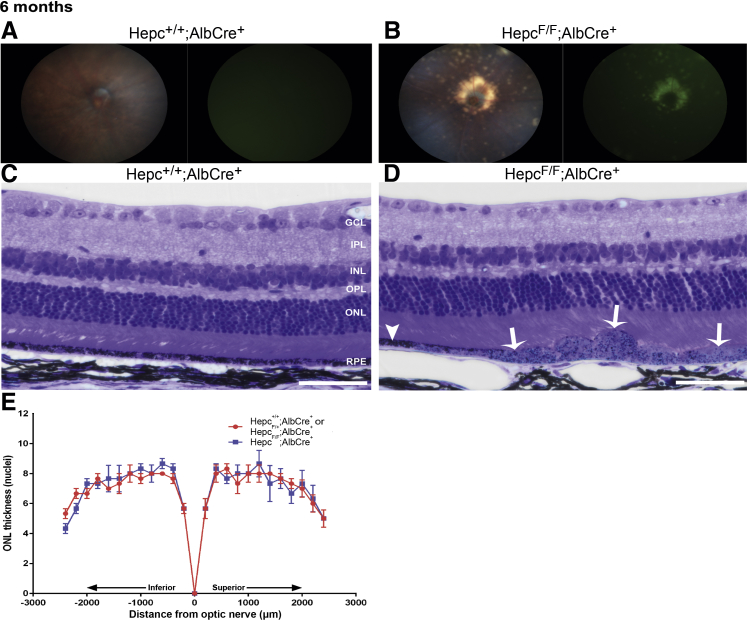
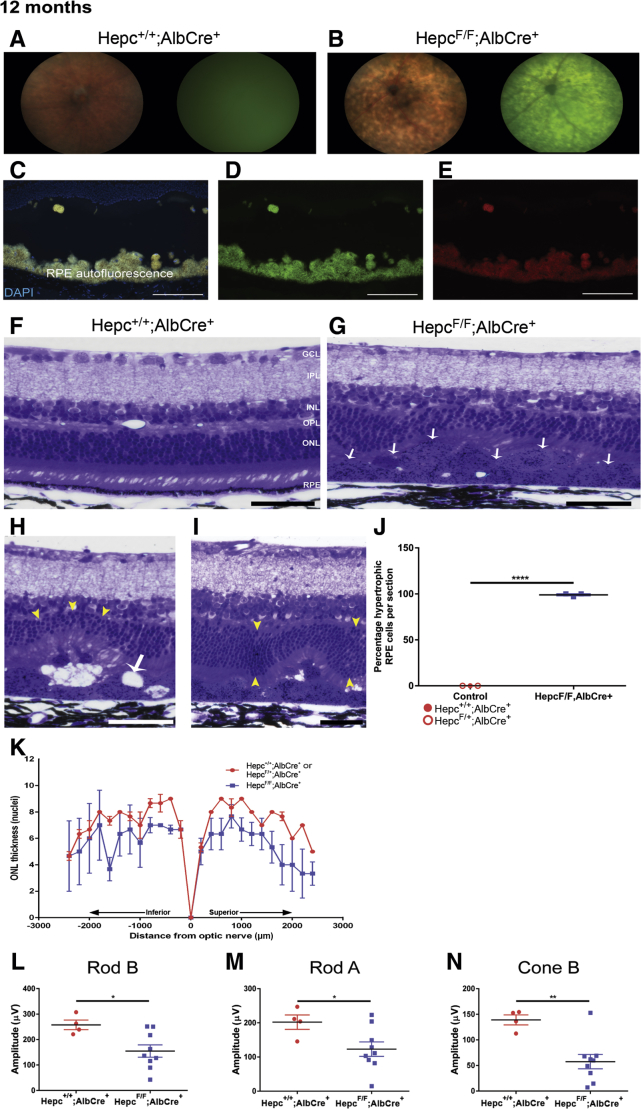
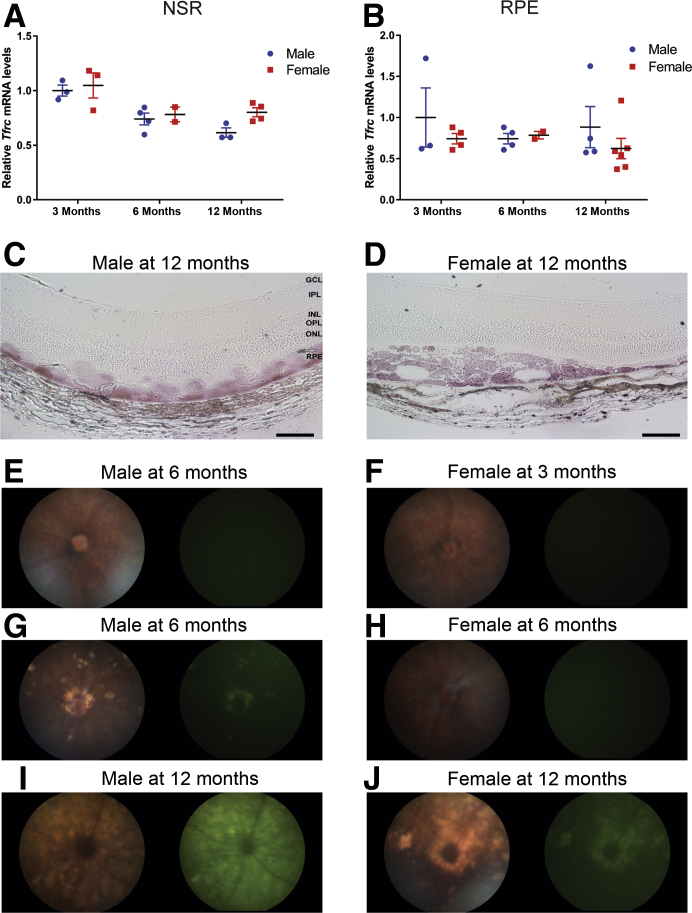
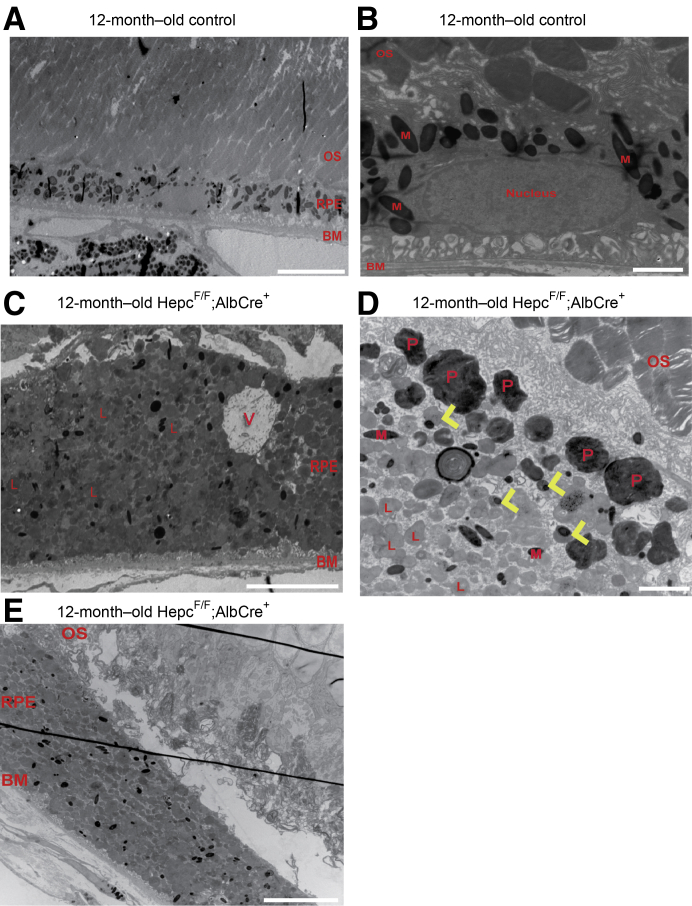
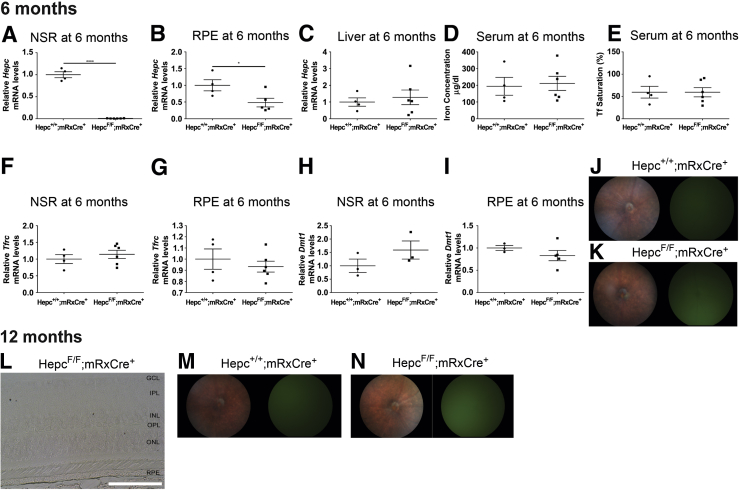
The liver secretes hepcidin (Hepc) into the bloodstream to reduce blood iron levels. Hepc accomplishes this by triggering degradation of the only known cellular iron exporter ferroportin in the gut, macrophages, and liver. We previously demonstrated that systemic Hepc knockout (HepcKO) mice, which have high serum iron, develop retinal iron overload and degeneration. However, it was unclear whether this is caused by high blood iron levels or, alternatively, retinal iron influx that would normally be regulated by retina-produced Hepc. To address this question, retinas of liver-specific and retina-specific HepcKO mice were studied. Liver-specific HepcKO mice had elevated blood and retinal pigment epithelium (RPE) iron levels and increased free (labile) iron levels in the retina, despite an intact blood-retinal barrier. This led to RPE hypertrophy associated with lipofuscin-laden lysosome accumulation. Photoreceptors also degenerated focally. In contrast, there was no change in retinal or RPE iron levels or degeneration in the retina-specific HepcKO mice. These data indicate that high blood iron levels can lead to retinal iron accumulation and degeneration. High blood iron levels can occur in patients with hereditary hemochromatosis or result from use of iron supplements or multiple blood transfusions. Our results suggest that high blood iron levels may cause or exacerbate retinal disease.


Figures

Figure 1
Figure 1
Validation of LS-HepcKO model. A: Liver Hepc mRNA levels measured by real-time quantitative PCR in LS-HepcKO (Hepcflox/flox;Alb-Cre+) versus controls (Hepc+/+;Alb-Cre+ or Hepcflox/flox;Alb-Cre-) at 3 months. B: Nonheme liver iron quantification (by bathophenanthroline sulfonate assay) in the LS-HepcKO mice compared with controls (Hepc+/+;Alb-Cre+ or Hepcflox/flox;Alb-Cre-) at 3 months. Statistical analysis for liver Hepc mRNA and liver iron quantification was performed using one-way analysis of variance with post hoc pairwise comparisons using the Tukey method. C: Serum iron concentration of LS-HepcKO mice versus controls at 3 and 12 months. D: Serum transferrin (Tf) saturation of LS-HepcKO mice versus controls at 3 and 12 months. For Tf saturation calculation, any value that was calculated to be >100%, because of the presence of nontransferrin bound iron, was recorded as 100% Tf saturation on the graph. E: Body weight of LS-HepcKO versus control mice at 3 months. F: Body weight of LS-HepcKO versus control mice at 12 months. Statistical analysis was performed using two-group, two-sided t-test. P < 0.05, ∗∗P < 0.01, and ∗∗∗∗P < 0.0001.
Figure 2
Figure 2
LS-HepcKO mice have retinal iron accumulation in the retinal pigment epithelium (RPE). A: Graphs of relative transferrin receptor (Tfrc) mRNA levels, determined by real-time quantitative PCR, in RPE of LS-HepcKO mice versus controls (Hepc+/+;Alb-Cre+) at the indicated ages. Groups marked with a different symbol are significantly different from each other (P < 0.05), as determined by two-way analysis of variance with post hoc Tukey adjustment. B: Relative Dmt1 mRNA levels in RPE of LS-HepcKO mice versus controls (Hepc+/+;Alb-Cre+ or Hepcflox/+;Alb-Cre+). C–H: Perls histochemical iron staining of cryosections at 3, 6, and 12 months. Control mice do not show any labeling in the RPE at any of the time points (C–E). LS-HepcKO mice show progressively stronger labeling in the RPE with age (F–H, black arrowheads). Inductively coupled mass spectrometry of RPE from LS-HepcKO and control mice at 6 months (I and J). I: There is significantly more iron within the RPE of the LS-HepcKO mice when compared with controls. J: There is also an elevated iron/zinc ratio in the RPE of LS-HepcKO mice compared with controls. Data are expressed as means ± SEM (A, B, I, and J). n = 3 per genotype (C–H). P < 0.05, ∗∗P < 0.01 versus control (I and J). Scale bars = 50 μm (C–H).
Figure 3
Figure 3
LS-HepcKO mice have labile iron accumulation in the neurosensory retina (NSR). A: Graphs of relative transferrin receptor (Tfrc) mRNA levels, determined by real-time quantitative PCR (qPCR), in NSR of LS-HepcKO mice versus controls (Hepc+/+;Alb-Cre+) at the indicated ages. Groups marked with a different symbol are significantly different from each other (P < 0.05), as determined by two-way analysis of variance with post hoc Tukey adjustment. B: Western blot analysis showing Tfr protein levels in the NSR in the LS-HepcKO mice versus controls at 12 months and relative pixel density of Western blot analysis Tfr bands corrected for glyceraldehyde-3-phosphate dehydrogenase (GAPDH). C: Relative Dmt1 mRNA levels in NSR of LS-HepcKO mice versus controls (Hepc+/+;Alb-Cre+ or Hepcflox/+;Alb-Cre+). D–O: Ferritin-L (Ft-L) immunolabeling of retinal sections. D, F, H, J, L, and N: At all three ages (3, 6, and 12 months), there is increased Ft-L immunolabeling in the NSR of LS-HepcKO mice (F, J, and N) compared with age-matched controls (D, H, and L). P: Pixel density of Ft-L immunolabeling in the NSR was quantified. Q: Relative levels of Hepc mRNA in LS-HepcKO NSR versus controls, determined by qPCR at 6 months. R and S: Inductively coupled mass spectrometry of NSR from LS-HepcKO and control mice at 6 months. R: There is no difference in iron (ppm) within the NSR of the LS-HepcKO mice when compared with controls. S: There is no change in the iron/zinc ratio in the NSR of LS-HepcKO mice compared with controls. Data are expressed as means ± SEM (AC and P–S). P < 0.05, ∗∗P < 0.01 (B and Q). Scale bars = 25 μm (D–O). GCL, ganglion cell layer; INL, inner nuclear layer; IPL, inner plexiform layer; ONL, outer nuclear layer; OPL, outer plexiform layer; RPE, retinal pigment epithelium.
Figure 4
Figure 4
Retinal iron accumulation in the LS-HepcKO mice occurs despite an intact blood-retinal barrier (BRB). A and B: Albumin immunolabeling to test for BRB integrity in cryosections from the control (A) and LS-HepcKO (B) mice at 6 months. C: Western analysis showing albumin protein levels in the neurosensory retina (NSR) in the LS-HepcKO mice versus controls at 3 months and relative pixel density of Western analysis albumin bands corrected for glyceraldehyde-3-phosphate dehydrogenase (GAPDH). n = 4 per genotype (A and B). Scale bars = 100 μm (A and B). GCL, ganglion cell layer; INL, inner nuclear layer; IPL, inner plexiform layer; ONL, outer nuclear layer; OPL, outer plexiform layer; RPE, retinal pigment epithelium.
Figure 5
Figure 5
Iron loading in LS-HepcKO mice leads to retinal pigment epithelium (RPE) hypertrophy and degeneration at 6 months. A and B: Representative in vivo color fundus images and green autofluorescence images. For each genotype, a representative micrograph is presented; all representative images are from male mice. C and D: Plastic sections of Hepc+/+;Alb-Cre+ control (C) and LS-HepcKO (D) retinas. D: There is RPE hypertrophy (white arrows) and adjacent regions where the RPE is normal (white arrowhead) in the LS-HepcKO retinas. For each genotype, a representative micrograph is presented; all representative images are from male mice. E: Graph of photoreceptor nuclei number per row comparing LS-HepcKO with age-matched controls. n = 8 Hepc+/+;Alb-Cre controls (A and B); n = 12 LS-HepcKO mice (A and B); n = 3 LS-HepcKO mice (CE); n = 2 Hepc+/+;Alb-Cre+ controls (C–E); n = 1 Hepcflox/+;Alb-Cre+ control mice (C–E). Scale bars = 50 μm (C and D). GCL, ganglion cell layer; INL, inner nuclear layer; IPL, inner plexiform layer; ONL, outer nuclear layer; OPL, outer plexiform layer.
Figure 6
Figure 6
Iron loading in LS-HepcKO mice leads to retinal pigment epithelium (RPE) degeneration and retinal dysfunction at 12 months. A and B: Representative in vivo color fundus images and green autofluorescence images. For each genotype, a representative micrograph is presented; all representative images are from male mice. C–E: Autofluorescence imaging of cryosections on the DAPI (C), Cy2 (D), and Cy3 (E) channels in 12-month–old LS-HepcKO retinas. F and G: Plastic sections showing widespread RPE hypertrophy in LS-HepcKO mice (white arrows; G). H and I: LS-HepcKO mice also demonstrate other characteristics of retinal degeneration, including outer nuclear layer (ONL) thinning (yellow arrowheads, H), RPE vacuolization (white arrow), and undulating ONL (yellow arrowheads, I). J: Percentage hypertrophic RPE per retinal section. K: Graph of photoreceptor nuclei number comparing LS-HepcKO with age-matched controls. L–N: Electroretinography rod B (L), rod A (M), and cone B (N) amplitudes in 12-month–control and LS-HepcKO mice. n = 7 Hepc+/+;Alb-Cre controls (A and B); n = 9 LS-HepcKO mice (A and B); n = 3 LS-HepcKO mice (CE); n = 1 Hepc+/+; Alb-Cre+ control (C–E); and n = 2 Hepcflox/+; Alb-Cre+ control mice (CE). P < 0.05, ∗∗P < 0.01, and ∗∗∗∗P < 0.0001. Scale bars = 50 μm (CI). GCL, ganglion cell layer; INL, inner nuclear layer; IPL, inner plexiform layer; OPL, outer plexiform layer.
Figure 7
Figure 7
Sexual dimorphism in retinal degeneration of 12-month–old LS-HepcKO mice. A: Graphs of relative transferrin receptor (Tfrc) mRNA levels, determined by real-time quantitative PCR (qPCR), in neurosensory retina (NSR) of LS-HepcKO male versus LS-HepcKO female mice at the indicated ages. B: Graphs of relative Tfrc mRNA levels, determined by qPCR, in retinal pigment epithelium (RPE) of LS-HepcKO male versus LS-HepcKO female mice at the indicated ages. C and D: VIP-enhanced Perls staining of plastic sections of 12-month–old male and female LS-HepcKO mice. E and F:In vivo color fundus images and green autofluorescence imaging of male and female LS-HepcKO mice at the age of 3 months. G and H: Six months. I and J: Twelve months. For each genotype, a representative micrograph is presented. Scale bars = 50 μm (C and D). GCL, ganglion cell layer; INL, inner nuclear layer; IPL, inner plexiform layer; ONL, outer nuclear layer; OPL, outer plexiform layer.
Figure 8
Figure 8
Electron micrographs of RPE cells in the LS-HepcKO mice are hypertrophic and contain numerous lipofuscin-filled vesicles. A: Low-magnification representative image of a 12-month–old C57BL/6J control retinal pigment epithelium (RPE) demonstrates the relative size of a normal RPE cell. B: Higher-magnification image of a normal RPE cell demonstrates organelle composition in a non-hypertrophic RPE cell. C: Low-magnification image of a 12-month–old LS-HepcKO mouse demonstrates the size of the hypertrophic RPE cells. D: Higher-magnification image of 12-month–old LS-HepcKO RPE demonstrates phagosomes (Ps) in apical region, melanolysosomes (yellow arrowheads), and lysosomes (Ls). E: Disorganized outer segments adjacent to hypertrophic RPE cells. Scale bars: 10 μm (A, C, and E); 2 μm (B and D). BM, Bruch membrane; M, melanosome; OS, outer segment; V, vacuole.
Figure 9
Figure 9
Analysis of RS-HepcKO model at 6 and 12 months in mice. A: Graph of Hepc mRNA levels in neurosensory retina (NSR), measured by real-time quantitative PCR (qPCR), in RS-HepcKO versus controls at 6 months. B: Hepc mRNA levels in retinal pigment epithelium (RPE) of RS-HepcKO versus controls at 6 months. C: Hepc mRNA levels in liver of RS-HepcKO versus controls at 6 months. D: Serum iron concentration of RS-HepcKO mice versus controls at 6 months. E: Serum transferrin saturation of RS-HepcKO mice versus controls at 6 months. F: Graph of Tfrc mRNA levels, measured by qPCR, in NSR of RS-HepcKO versus controls at 6 months. G: Graph of Tfrc mRNA levels, measured by qPCR, in RPE of RS-HepcKO versus controls at 6 months. H: Graph of Dmt1 mRNA levels, measured by qPCR, in NSR of RS-HepcKO versus controls at 6 months. I: Graph of Dmt1 mRNA levels, measured by qPCR, in RPE of RS-HepcKO versus controls at 6 months. J and K:In vivo fundus images and autofluorescence images of 6-month–old RS-HepcKO and control mice. L: VIP-enhanced Perls iron staining of plastic sections of 12-month–old RS-HepcKO retina. M and N:In vivo fundus images and autofluorescence images of 12-month–old RS-HepcKO and control mice. Statistical analysis was performed using two-group, two-sided t-test. P < 0.05, ∗∗∗∗P < 0.0001. Scale bar = 50 μm (L). GCL, ganglion cell layer; INL, inner nuclear layer; IPL, inner plexiform layer; ONL, outer nuclear layer; OPL, outer plexiform layer.

Similar articles

Cited by

References

    1. Beard J.L. Iron biology in immune function, muscle metabolism and neuronal functioning. J Nutr. 2001;131:568S–579S. discussion 580S. - PubMed
    1. Aisen P., Enns C., Wessling-Resnick M. Chemistry and biology of eukaryotic iron metabolism. Int J Biochem Cell Biol. 2001;33:940–959. - PubMed
    1. Rogers B.S., Symons R.C.A., Komeima K., Shen J., Xiao W., Swaim M.E., Yuan Y.G., Kachi S., Campochiaro P.A. Differential sensitivity of cones to iron-mediated oxidative damage. Invest Ophthalmol Vis Sci. 2007;48:438–445. - PubMed
    1. Hahn P., Milam A.H., Dunaief J.L. Maculas affected by age-related macular degeneration contain increased chelatable iron in the retinal pigment epithelium and Bruch's membrane. Arch Ophthalmol. 2003;121:1099–1105. - PubMed
    1. Rouault T.A. Iron metabolism in the CNS: implications for neurodegenerative diseases. Nat Rev Neurosci. 2013;14:551–564. - PubMed

Publication types