. 2019 Jul 26;16(156):20190103.
doi: 10.1098/rsif.2019.0103. Epub 2019 Jul 10.

Bumblebees learn foraging routes through exploitation-exploration cycles

Affiliations

Bumblebees learn foraging routes through exploitation-exploration cycles

Jackelyn M Kembro et al. J R Soc Interface. .

Abstract

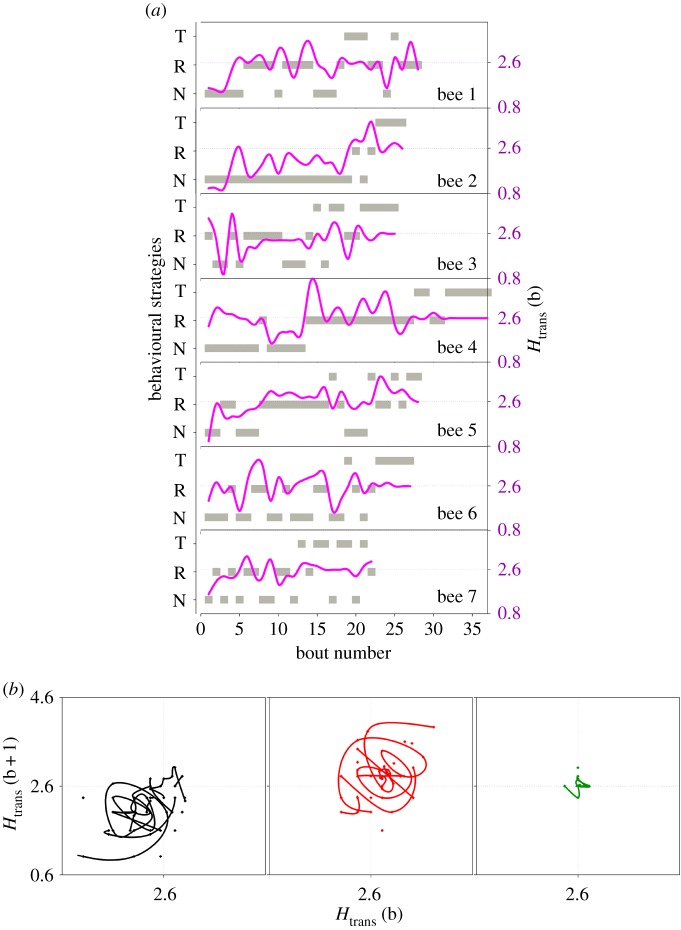
How animals explore and acquire knowledge from the environment is a key question in movement ecology. For pollinators that feed on multiple small replenishing nectar resources, the challenge is to learn efficient foraging routes while dynamically acquiring spatial information about new resource locations. Here, we use the behavioural mapping t-Stochastic Neighbouring Embedding algorithm and Shannon entropy to statistically analyse previously published sampling patterns of bumblebees feeding on artificial flowers in the field. We show that bumblebees modulate foraging excursions into distinctive behavioural strategies, characterizing the trade-off dynamics between (i) visiting and exploiting flowers close to the nest, (ii) searching for new routes and resources, and (iii) exploiting learned flower visitation sequences. Experienced bees combine these behavioural strategies even after they find an optimal route minimizing travel distances between flowers. This behavioural variability may help balancing energy costs-benefits and facilitate rapid adaptation to changing environments and the integration of more profitable resources in their routes.

Keywords: bumblebees; exploration–exploitation trade-off; movement ecology; t-Stochastic Neighbouring Embedding; trapline foraging.


Conflict of interest statement

We declare we have no competing interests.

Figures

Figure 1.
Figure 1.
Behavioural landscape. Quantitative analysis of bumblebee foraging bouts in a large-scale set-up containing the nest-box (N) and 5 artificial flowers (1–5). Computation of the behavioural landscape of foraging bouts from seven bees based on a t-Stochastic Neighbouring Embedding (t-SNE) analysis. The heat map of t-SNE landscape reveals three behavioural strategies: NNV, Route Development and Traplining. The dominant behavioural mode characterizing each strategy is defined by a peak (black dot). The smaller the size of the clustered region and the larger the strength of the dominant peak, the less variable the foraging behaviour. The largest clustered area and the lowest peak correspond to the Route Development strategy, whereas the smallest clustered region and strongest dominant peak are associated with the Traplining strategy. Skeleton diagrams show representative foraging bouts (data from all bees pooled together) for each strategy. Only transitions between near flowers are represented for simplicity. White, dark grey and black double arrows represent transitions that occurred 0%, greater than or equal to 4% and greater than or equal to 7% of foraging bouts of each type, respectively. Grey numbers denote each flower. We used 11 variables for t-SNE analysis (table 1 and figure 2a): length of the flower visitation sequence, probability of immediate revisits to a flower, numbers of different flowers found and probability of visiting the flower furthest from the colony nest (flower 3), probability of symmetrical 2-flower transition types 3, 4 and 5 (electronic supplementary material, figure S20), probability of 4-flower transition type 1 and 2, probability of 5-flower transition and the determinism index. (Online version in colour.)
Figure 2.
Figure 2.
Characterization of behavioural strategies and their unfolding across time. (ac) Probability distribution of the mean distance to the nest (d) estimated as the mean distances expressed in metres between each flower visited during a foraging bout (including revisits) and the nest. Distinct distributions are observed in NNV, Route Development and Traplining behavioural strategies. Dotted black line represents an optimal trapline. (dg) Boxplots show foraging bout variability of four variables for Near-nest visits (N), Route Development (R) and Traplining (T). (d) Determinism estimated for each period of three consecutive foraging bouts, and a minimum designated series length of three flowers, (e) mean turning angle (i.e. the mean of the absolute values of turning angles) and (f,g) Shannon entropies (H = −Σp(x)log2p(x)), Hft where p is the relative flight duration (i.e. flight duration/duration of foraging bout), and Htrans where p is the probability of performing one of the 36 possible transitions between flowers and/or the nest. (dg) Strategies that do not share the same letter differ by p < 0.05 (Tukey and Kramer (Nemenyi) test with Tukey-Dist approximation for independent samples). (h) Per cent of foraging bouts classified as belonging to each behavioural strategy as a function of the temporal sequence of bouts, computed over five foraging bouts overlapped running windows. Lines show a quadratic polynomial fit to data points of each foraging bout class. (i,j) Median values of entropies Hft and Htrans for all seven bees, computed over five foraging bouts overlapped running windows. For illustrative purposes, we show quadratic polynomial fits to data points as lines. (Online version in colour.)
Figure 3.
Figure 3.
Temporal evolution of behavioural strategies and entropy from naive to experienced bumblebees. (a) Time series of fluctuations between behavioural strategies Near-Nest Exploitation (N or NNV), Route Development (R) and Traplining (T) throughout route learning of each of the seven bumblebees evaluated. Grey squares represent the behavioural strategy (left axis) and lines represent the estimated entropy Htrans (right axis) of given bout. (b) Return plots of entropy Htrans estimated in two successive foraging bouts of the same behavioural strategy. Note the oscillatory nature of Htrans during NNV and Route Development bouts where higher values are often followed by lower entropies. Similar results are shown for Hfl in electronic supplementary material, figure S15. Moreover, NNV bout oscillations occurred mainly between 0.8 and 2.59, while between Route Development bouts a larger variability was observed mainly between 1.7 and 4.2. By contrast, during Traplining fairly constant values of Htrans were observed near the optimum value 2.6 (dotted lines). (Online version in colour.)
Figure 4.
Figure 4.
Behavioural transition from naive to experienced bumblebees depicted in a cost–benefit landscape, and contextualized in simple and complex fitness landscapes for optimal routing. (a) The three behaviourally distinct strategies of figure 1 depicted in a cost–benefit landscape (distance from nest D^ versus exploratory activity H^trans). Near-Nest Exploitation (NNV, black open circles) represents low distances from nest and low exploratory activity, whereas Route Development (red open circles) represents large costs associated with being far from the nest and large exploratory activity relative to Traplining (green open circles). (b) Three-dimensional representation of a two-dimensional kernel density estimation of the population-level frequency of foraging bouts with a given amount of cost–benefit exposure (data of all bees pooled together). The peak represents optimized trapline foraging behaviour. Note also the smaller plateaus in the lower-left and upper-right quadrants, representing opposite behavioural strategies, surrounding optimal trapline foraging. (c,d) Examples of two-dimensional kernel density population-level representations with the individual sequences of foraging bouts for two different bees. (e) The different possible behavioural states an animal can adopt can be associated with a cost/benefit ratio. In this context, an optimal trapline minimizing travel distances can be associated with a local minimum of a cost/benefit. Attractors (local cost/benefit minimums) are constantly perturbed due to environmentally driven or induced behavioural variability, that may come from imperfect memory or motor control at some level, casting the forager out of the local minimum to another (potentially better) minimum. Depending on the overall behavioural state landscape dynamics can be stable or unstable attractor points, so that bees may end up returning to specific spatial configuration (as is the case of the experimental set-up) or else never come back, a process endured by a never-ending exploratory process only constrained by the distance to the nest. (Online version in colour.)

References

    1. Bartumeus F, Campos D, Ryu WS, Lloret-Cabot R, Mendez V, Catalan J. 2016. Foraging success under uncertainty: search tradeoffs and optimal space use. Ecol. Lett. 19, 1299–1313. (10.1111/ele.12660) - DOI - PubMed
    1. Bartumeus F, Raposo EP, Viswanathan GM, da Luz MG. 2014. Stochastic optimal foraging: tuning intensive and extensive dynamics in random searches. PLoS ONE 9, e106373 (10.1371/journal.pone.0106373) - DOI - PMC - PubMed
    1. Hills TT, Todd PM, Lazer D, Redish AD, Couzin ID. 2015. Cognitive search research G. Exploration versus exploitation in space, mind, and society. Trends Cogn. Sci. 19, 46–54. (10.1016/j.tics.2014.10.004) - DOI - PMC - PubMed
    1. McNamara JM, Green RF, Olsson O. 2006. Bayes' theorem and its application in animal behaviour. Oikos 112, 243–251. (10.1111/j.0030-1299.2006.14228.x) - DOI
    1. Janzen DH. 1971. Euglossine bees as long-distance pollinators of tropical plants. Science 171, 203–205. (10.1126/science.171.3967.203) - DOI - PubMed

Publication types