. 2019 Jul 10;286(1906):20190513.
doi: 10.1098/rspb.2019.0513. Epub 2019 Jul 10.

A multi-sensory code for emotional arousal

Affiliations

A multi-sensory code for emotional arousal

Beau Sievers et al. Proc Biol Sci. .

Abstract

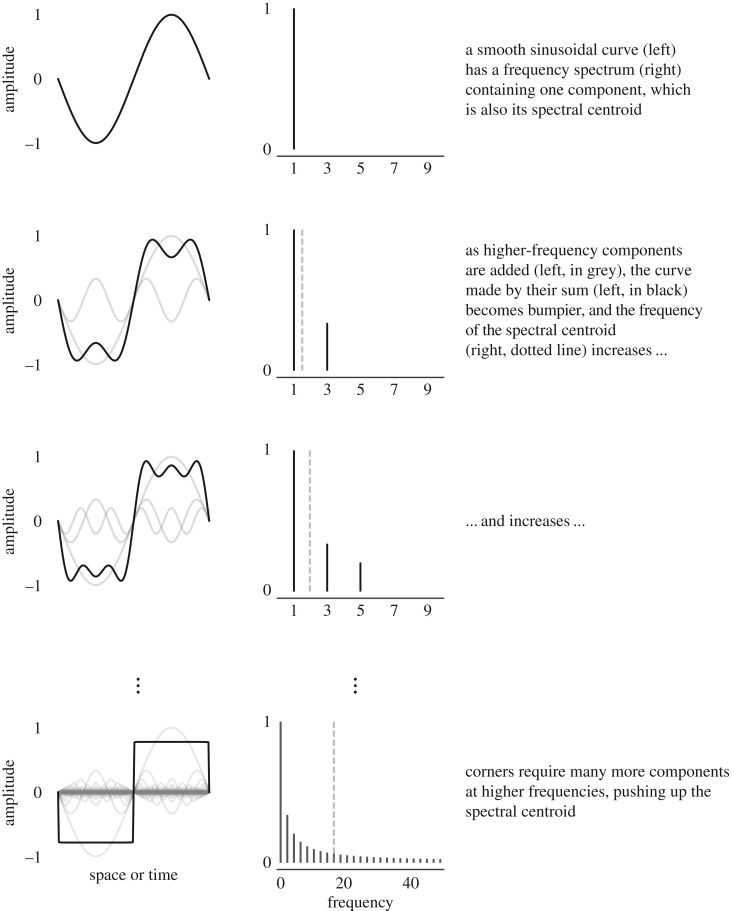
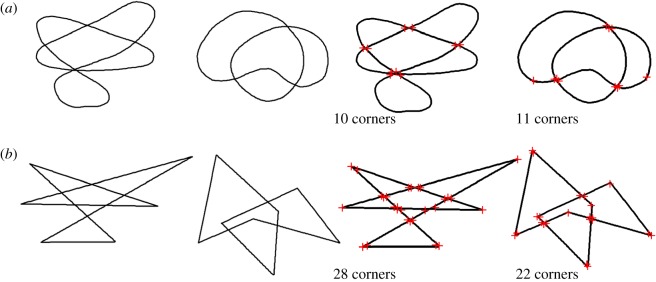
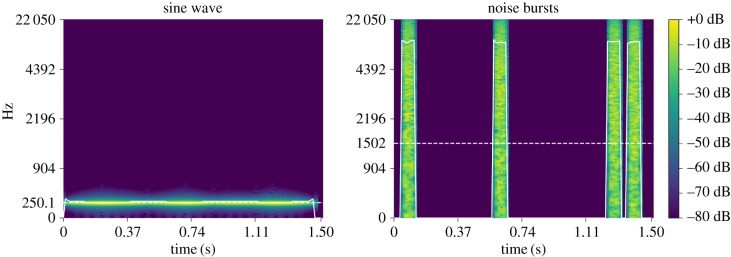
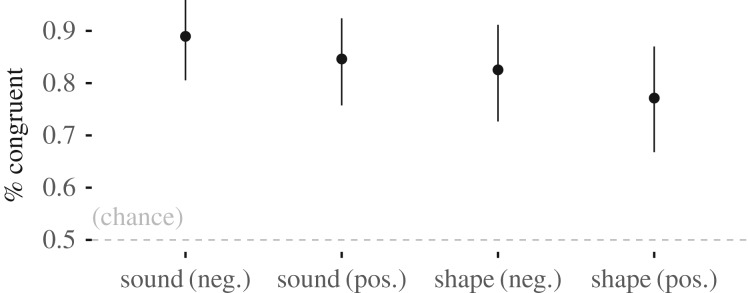
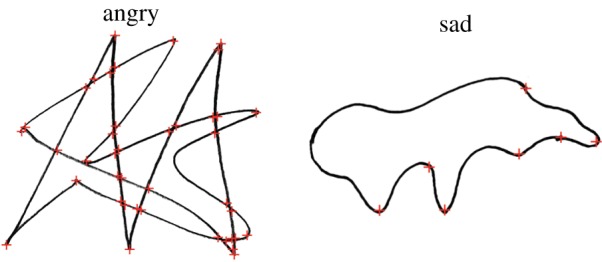
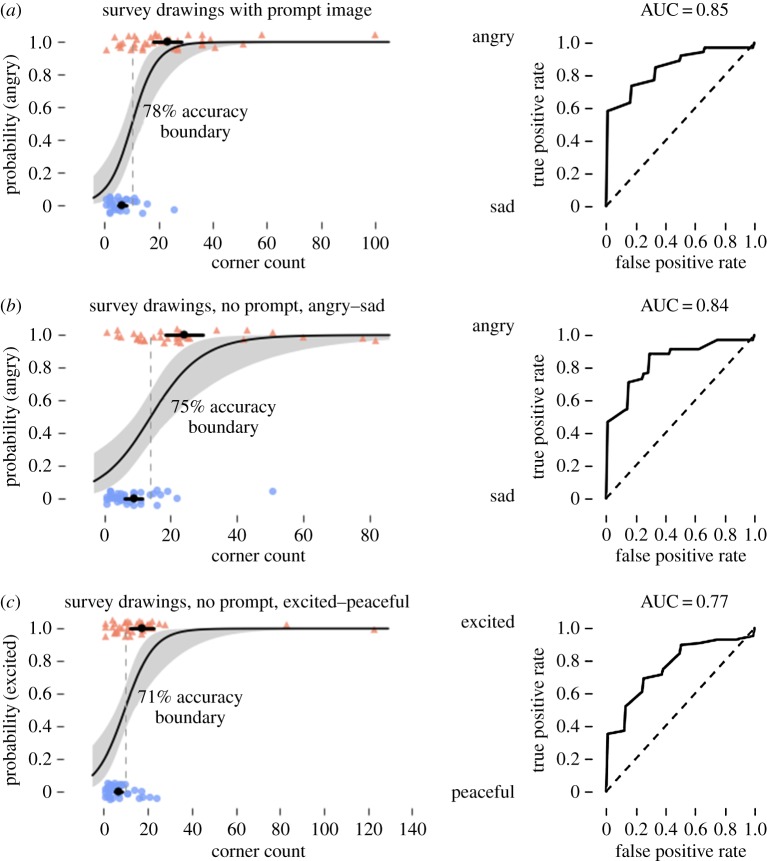
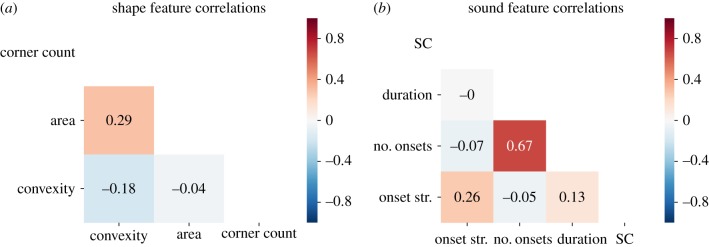
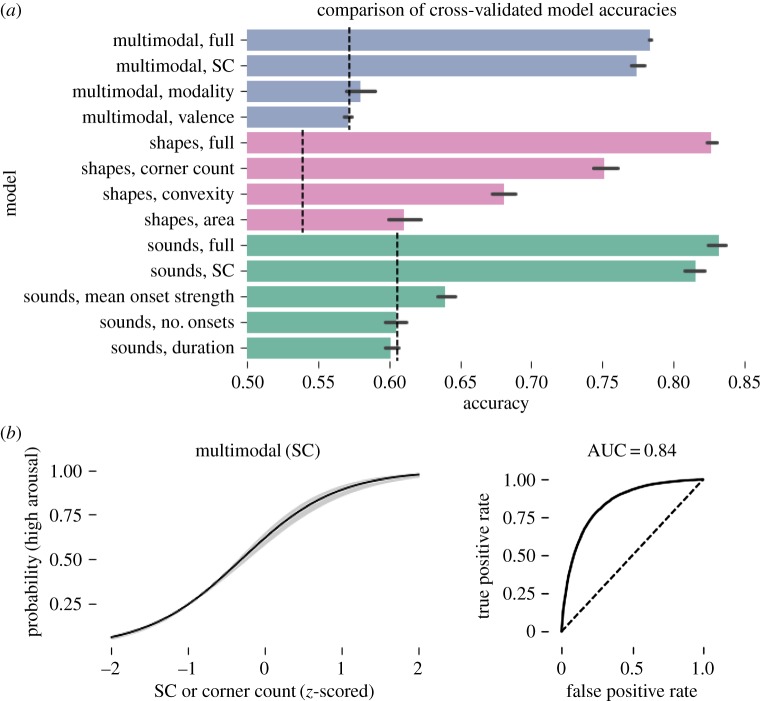
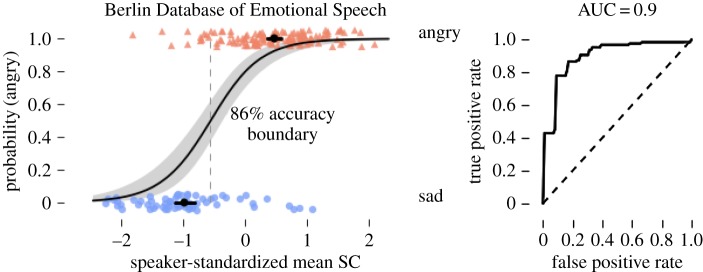
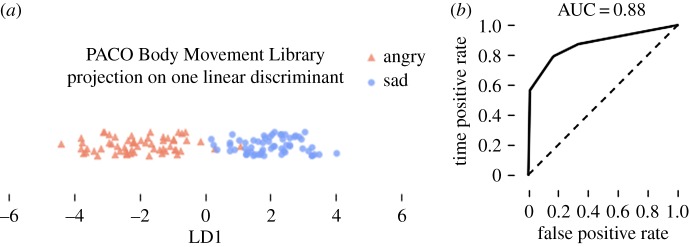
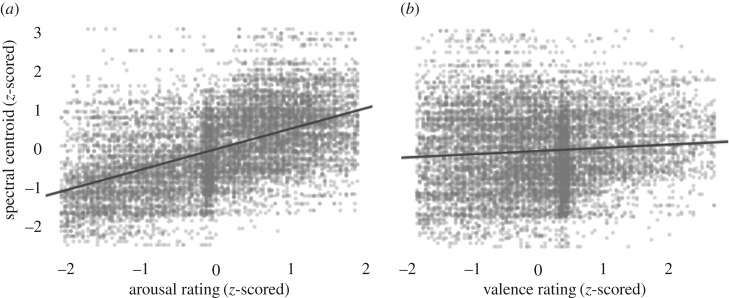
People express emotion using their voice, face and movement, as well as through abstract forms as in art, architecture and music. The structure of these expressions often seems intuitively linked to its meaning: romantic poetry is written in flowery curlicues, while the logos of death metal bands use spiky script. Here, we show that these associations are universally understood because they are signalled using a multi-sensory code for emotional arousal. Specifically, variation in the central tendency of the frequency spectrum of a stimulus-its spectral centroid-is used by signal senders to express emotional arousal, and by signal receivers to make emotional arousal judgements. We show that this code is used across sounds, shapes, speech and human body movements, providing a strong multi-sensory signal that can be used to efficiently estimate an agent's level of emotional arousal.

Keywords: arousal; cross-modal; emotion; spectral centroid; supramodal.


Conflict of interest statement

We declare we have no competing interests.

Figures

Figure 1.
Figure 1.
Visual explanation of the link between SC and corners.
Figure 2.
Figure 2.
Shape pairs used in tasks 1 and 2, based on Köhler's [20] shapes, before and after Harris corner detection. (a) Low SC, low corner count shapes; (b) high SC, high corner count shapes.
Figure 3.
Figure 3.
Spectrograms of sound stimuli. Solid white line shows instantaneous SC; dotted white line shows the mean SC. (Online version in colour.)
Figure 4.
Figure 4.
Study 1 results. Angry and excited (high arousal) were associated with high SC stimuli (noise bursts and spiky shapes), while sad and peaceful (low arousal) were associated with low SC stimuli (sine wave and rounded shapes).
Figure 5.
Figure 5.
Characteristic angry and sad drawings from study 3, after smoothing and corner detection. Corners are marked with red ‘+’ signs. Among our participants, angry drawings had a mean of 23.3 corners, while sad drawings had a mean of 6.6 corners. (Online version in colour.)
Figure 6.
Figure 6.
Bayesian logistic regression classification of angry, sad, excited and peaceful drawings from our survey participants. For all logistic regression plots, black dots and bars show means and 95% CIs of the mean, and the dotted line shows the 50% probability boundary. (a) Participants were shown a prompt image and asked to draw a shape conveying the opposite arousal negative emotion. (b,c) Participants were shown no prompt image and asked to draw a shape that was angry, sad, excited or peaceful.
Figure 7.
Figure 7.
Correlation matrices for features of procedurally generated (a) shape and (b) sound stimuli. Corner count and SC were not strongly correlated with other features, enabling accurate estimation of effect sizes for each feature. (Online version in colour.)
Figure 8.
Figure 8.
Bayesian logistic regression classification of participant emotion judgements of procedurally generated shapes and sounds. (a) Comparison of model accuracies. Dashed lines indicate chance performance. ‘Full’ models included all predictors and interactions; others were limited to the single labelled predictor. All models included random slopes and intercepts per participant. (b) Fixed effect of SC in the multimodal, single-predictor model. Lines and shaded areas show the mean and 95% credible interval. See electronic supplementary material for all model fit plots. (Online version in colour.)
Figure 9.
Figure 9.
Bayesian logistic regression classification of angry and sad examples from the Berlin Database of Emotional Speech. (Online version in colour.)
Figure 10.
Figure 10.
 (a) Projection of angry and sad movements from the PACO Body Movement Library onto a single linear discriminant using Bayes rule. (b) ROC analysis of LDA-based classification. (Online version in colour.)
Figure 11.
Figure 11.
Visualizations of the relationship between arousal, valence and the SC. See above for complete hierarchical Bayesian linear regression results. (a) Stimuli rated as having higher arousal also have higher SCs. (b) The relationship between valence and SC is relatively weak.

References

    1. Sauter DA, Eisner F, Ekman P, Scott SK. 2010. Cross-cultural recognition of basic emotions through nonverbal emotional vocalizations. Proc. Natl Acad. Sci. USA 107, 2408–2412. (10.1073/pnas.0908239106) - DOI - PMC - PubMed
    1. Russell JA, Lewicka M, Niit T. 1989. A cross-cultural study of a circumplex model of affect. J. Pers. Soc. Psychol. 57, 848–856. (10.1037/0022-3514.57.5.848) - DOI
    1. Filippi P, et al. 2017. Humans recognize emotional arousal in vocalizations across all classes of terrestrial vertebrates: evidence for acoustic universals. Proc. R. Soc. B 284, 1–9. (10.1098/rspb.2017.0990) - DOI - PMC - PubMed
    1. Faragó T, Andics A, Devecseri V, Kis A, Gácsi M, Miklósi Á. 2014. Humans rely on the same rules to assess emotional valence and intensity in conspecific and dog vocalizations. Biol. Lett. 10, 20130926 (10.1098/rsbl.2013.0926) - DOI - PMC - PubMed
    1. Holland M, Wertheimer M. 1964. Some physiognomic aspects of naming, or, maluma and takete revisited. Percept. Mot. Skills 19, 111–117. (10.2466/pms.1964.19.1.111) - DOI - PubMed

Publication types