. 2019 Jul 9;11(1):100.
doi: 10.1186/s13148-019-0695-0.

Clustered protocadherins methylation alterations in cancer

Affiliations

Clustered protocadherins methylation alterations in cancer

Ana Florencia Vega-Benedetti et al. Clin Epigenetics. .

Abstract

Background: Clustered protocadherins (PCDHs) map in tandem at human chromosome 5q31 and comprise three multi-genes clusters: α-, β- and γ-PCDH. The expression of this cluster consists of a complex mechanism involving DNA hub formation through DNA-CCTC binding factor (CTCF) interaction. Methylation alterations can affect this interaction, leading to transcriptional dysregulation. In cancer, clustered PCDHs undergo a mechanism of long-range epigenetic silencing by hypermethylation.

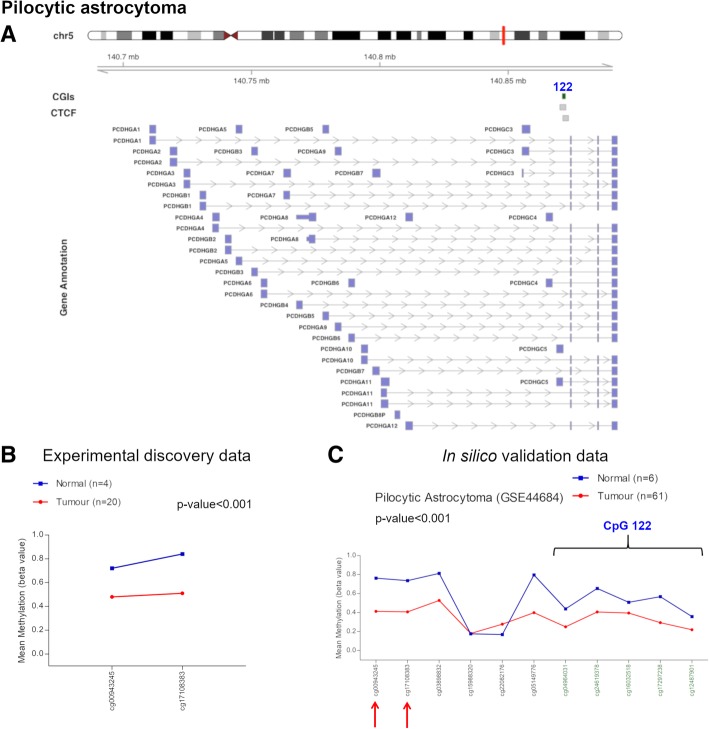
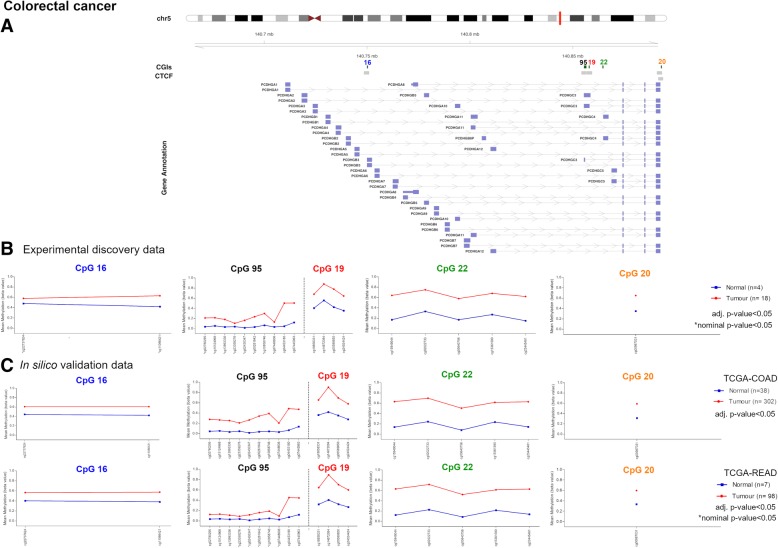
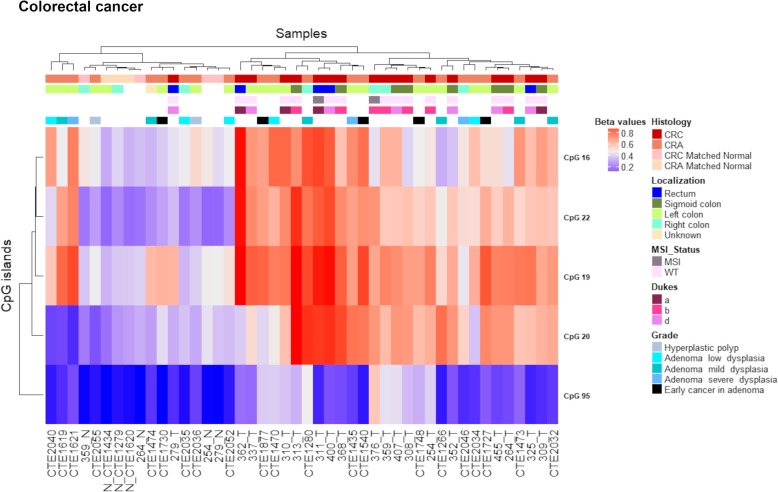
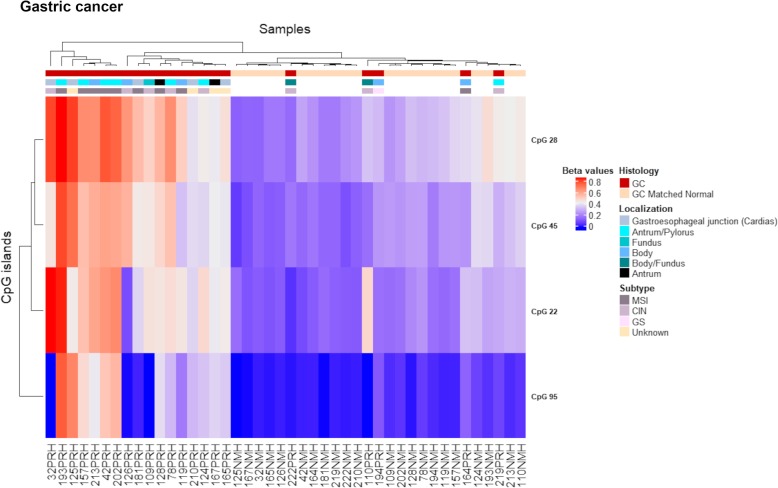
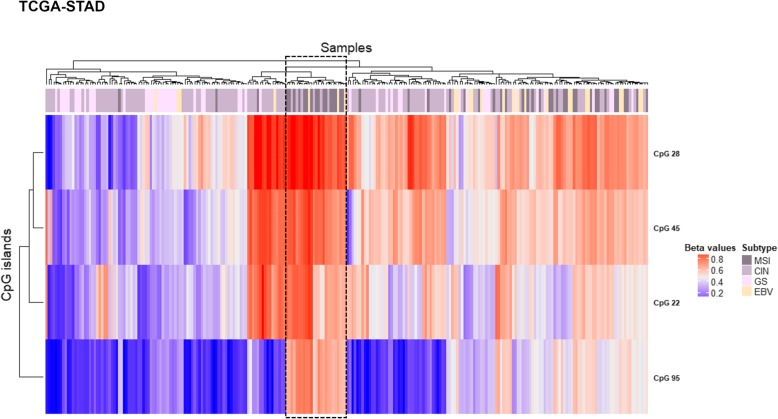
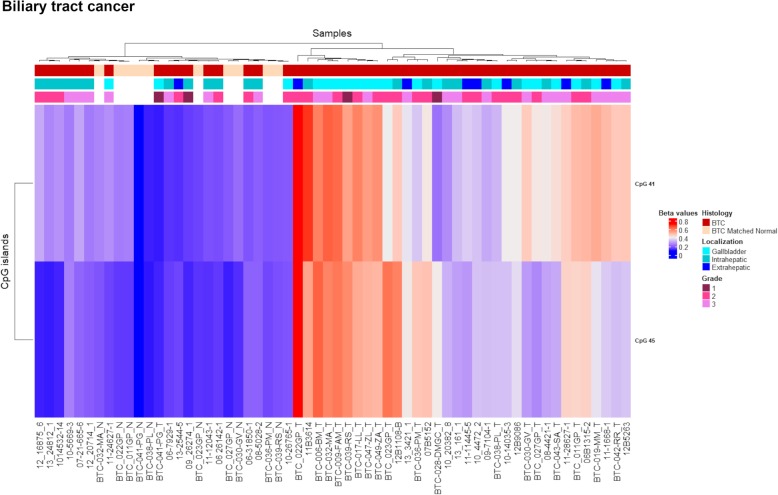
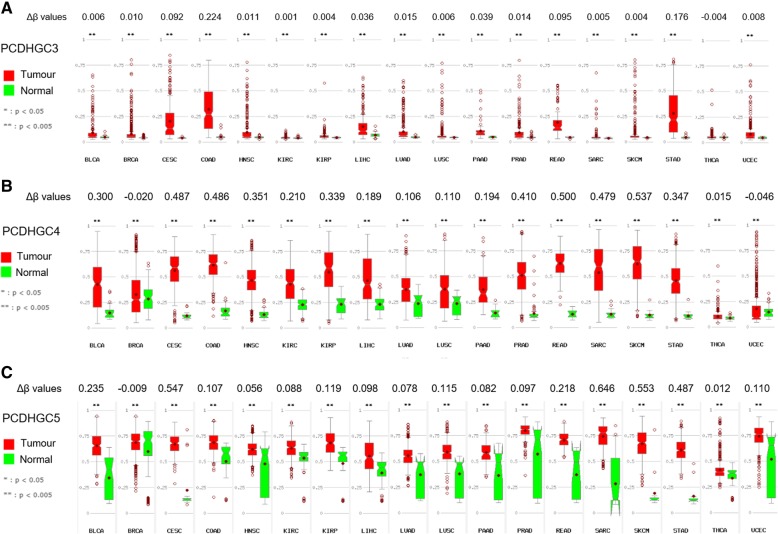
Results: In this study, we detected frequent methylation alterations at CpG islands associated to these clustered PCDHs in all the solid tumours analysed (colorectal, gastric and biliary tract cancers, pilocytic astrocytoma), but not hematologic neoplasms such as chronic lymphocytic leukemia. Importantly, several altered CpG islands were associated with CTCF binding sites. Interestingly, our analysis revealed a hypomethylation event in pilocytic astrocytoma, suggesting that in neuronal tissue, where PCDHs are highly expressed, these genes become hypomethylated in this type of cancer. On the other hand, in tissues where PCDHs are lowly expressed, these CpG islands are targeted by DNA methylation. In fact, PCDH-associated CpG islands resulted hypermethylated in gastrointestinal tumours.

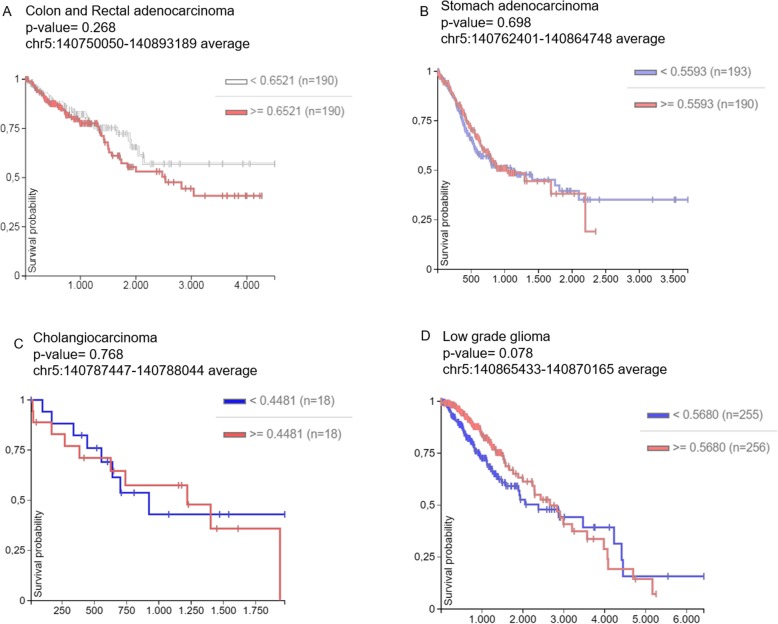
Conclusions: Our study highlighted a strong alteration of the clustered PCDHs methylation pattern in the analysed solid cancers and suggested these methylation aberrations in the CpG islands associated with PCDH genes as powerful diagnostic biomarkers.

Keywords: BTC; Biliary tract cancer; CLL; CRA; CRC; CTCF; Cancer methylation alteration; Chronic lymphocytic leukemia; Clustered PCDH; Colorectal adenoma; Colorectal carcinoma; CpG islands; GC; Gastric cancer; LGG; Low grade glioma; PA; Pilocytic astrocytoma.


Conflict of interest statement

The authors declare that they have no competing interests.

Figures

Fig. 1
Fig. 1
Description of sample sets used for the work. Discovery datasets: cancer samples collected for the study of methylome. In silico datasets: data used to validate the methylation alterations identified in clustered PCDHs, to explore the overall survival in relation to the identified aberrations and the correlation between methylation and expression of selected PCDHGs
Fig. 2
Fig. 2
Methylation values obtained from the pilocytic astrocytoma discovery dataset and the in silico data. a Genomic organization of PCDHG@, including the localization of exons, CGIs (annotated with the UCSC CGI names) and CTCF binding sites. b Mean β values, resulting from the average of the samples (normal and tumour), of each probe obtained using Infinium HumanMethylation27 BeadChip. These two probes correspond to the N-shelf region of the CpG 122 (chr5:140871064-140872335), altered in our analysis. c Mean methylation values of each probe, belonging to the CpG 122 (green) and to its flanking region (black), obtained from the in silico dataset GSE44684. The red arrows indicate the two probes used in our experimental study
Fig. 3
Fig. 3
Methylation values obtained from the colorectal cancer discovery dataset and the in silico datasets. a Genomic organization of PCDHG@, including the localization of exons, CGIs (annotated with the UCSC CGI names) and CTCF binding sites. b Mean β values, resulting from the average of the samples (normal and tumour) of each probe of the altered CGIs obtained using Infinium HumanMethylation450 BeadChip. c Mean methylation values of each probe, belonging to the CpG 16, CpG 95, CpG 19, CpG 22 and CpG 20 (green), obtained from the in silico datasets TCGA-COAD and TCGA-READ
Fig. 4
Fig. 4
Colon discovery set unsupervised hierarchical clustering analysis based on the average methylation β value for each of the aberrantly methylated CGI. Heatmap obtained by UHC of CRC, CRA, CRC-matched normals and CRA-matched normals. All CRCs branched in a same group separated from control samples, except for sample 279T. Adenomas samples clustered randomly, 12 of them branched along CRCs and the others resembled the methylation status of normal samples. No correlation was observed between methylation profile and localization/subtype/staging in CRCs and CRAs. To the right of the heatmap, further information are reported: histology, localization, MSI status, Dukes and grade. CRC colorectal cancer, CRA colorectal adenoma, MSI microsatellite instability, WT wild-type
Fig. 5
Fig. 5
Methylation values obtained from the gastric cancer discovery dataset and the in silico dataset. a Genomic organization of PCDHG@, including the localization of exons, CGIs (annotated with the UCSC CGI name) and CTCF binding sites. b Mean β values, resulting from the average of the samples (normal and tumour), of each probe of the altered CGIs obtained using EPIC array. c Mean methylation values of each probe, belonging to the CpG 28, CpG 45, CpG 95 and CpG 22, obtained from the in silico datasets TCGA-STAD (450K array)
Fig. 6
Fig. 6
Gastric discovery set unsupervised hierarchical clustering analysis based on the average methylation β value for each of the aberrantly methylated CGI. Heatmap obtained by UHC of 22 gastric cancer samples and their matched normal samples. A group of GC with high methylation values branched together separated from normal samples and few GC samples that resembled the methylation pattern of controls. The UHC analysis also revealed another group of GC with a methylation profile between normal and tumour samples. To the right of the heatmap, further information are reported: histology, localization and subtype. GC gastric cancer, MSI microsatellite instability, CIN chromosomal instability, GS genomic stability
Fig. 7
Fig. 7
Gastric in silico set unsupervised hierarchical clustering analysis based on the average methylation β value for each of the aberrantly methylated CGI. Heatmap obtained by UHC of 248 gastric cancer samples. Two groups of GC branched separately according to their methylation levels. A subgroup with high methylation values in all CGIs is enclosed in a dashed box. To the right of the heatmap, subtype information are reported: MSI microsatellite instability, CIN chromosomal instability, GS genomic stability, EBV Epstein-Barr virus positivity
Fig. 8
Fig. 8
Methylation values obtained from the biliary tract cancer discovery dataset and the in silico dataset. a Genomic organization of PCDHG@, including the localization of exons, CGIs (annotated with the UCSC CGI name) and CTCF binding sites. b Mean β values, resulting from the average of the samples (normal and tumour) of each probe of the altered CGIs obtained using EPIC array. c Mean methylation values of each probe, belonging to the CpG 45 and CpG 41, obtained from the in silico datasets TCGA-CHOL (450K array). Tumour: Gbc, gallbladder cancer; Extra chol, extrahepatic cholangiocarcinoma; Intra chol, intrahepatic cholangiocarcinoma. Normal: Gb, gallbladder; Extra, extrahepatic; Intra, intrahepatic
Fig. 9
Fig. 9
Discovery set unsupervised hierarchical clustering analysis based on the average methylation β value for the two aberrantly methylated CGIs. Heatmap obtained by UHC of 50 BTC samples and 10 matched normal samples. The UHC analysis clearly separated one group of sole tumours and another group including normal and tumoral samples. To the right of the heatmap further information are reported: histology, localization and grade. BTC, biliary tract cancer
Fig. 10
Fig. 10
Box plots of the methylation values in tumour and normal tissues from different cancers, obtained from the in silico dataset TCGA. Differential methylation (Δβ) values of the CGIs of PCDHGC3 (a), PCDHGC4 (b) and PCDHGC5 (c) were calculated between tumour and normal tissues. BLCA bladder urothelial carcinoma, BRCA breast invasive carcinoma, CESC cervical squamous cell carcinoma and endocervical adenocarcinoma, COAD colon adenocarcinoma, HNSC head and neck squamous cell carcinoma, KIRC kidney renal clear cell carcinoma, KIRP kidney renal papillary cell carcinoma, LIHC liver hepatocellular carcinoma, LUAD lung adenocarcinoma, LUSC lung squamous cell carcinoma, PAAD pancreatic adenocarcinoma, PRAD prostate adenocarcinoma, READ rectal adenocarcinoma, SARC sarcoma, SKCM skin cutaneous melanoma, STAD stomach adenocarcinoma, THCA thyroid carcinoma, UCEC uterine corpus endometrial carcinoma
Fig. 11
Fig. 11
In silico survival curves of patients with colon and rectal adenocarcinoma (a), stomach adenocarcinoma (b), cholangiocarcinoma (c) and low grade glioma (d). The altered region detected in our research and used for this analysis is specified for each tumour type in the Kaplan-Meier plots (x-axis, survival time in days; y-axis, survival probability). Samples were divided into high and low methlyation value groups
Fig. 12
Fig. 12
In silico analyses using the dataset TCGA-LGG. Survival curves of patients classified by high and low methylation β values of PCDHGC3 (a), PCDHGC4 (b) and PCDHGC5 (c). d Correlation between methylation and expression level of each PCDHG C-type

References

    1. Shan M, Su Y, Kang W, Gao R, Li X, Zhang G. Aberrant expression and functions of protocadherins in human malignant tumors. Tumour biology : the journal of the International Society for Oncodevelopmental Biology and Medicine. 2016;37(10):12969–12981. doi: 10.1007/s13277-016-5169-9. - DOI - PubMed
    1. El Hajj N, Dittrich M, Haaf T. Epigenetic dysregulation of protocadherins in human disease. Seminars in cell & developmental biology. 2017;69:172–182. doi: 10.1016/j.semcdb.2017.07.007. - DOI - PubMed
    1. Schreiner D, Weiner JA. Combinatorial homophilic interaction between gamma-protocadherin multimers greatly expands the molecular diversity of cell adhesion. Proceedings of the National Academy of Sciences of the United States of America. 2010;107(33):14893–14898. doi: 10.1073/pnas.1004526107. - DOI - PMC - PubMed
    1. Dallosso AR, Oster B, Greenhough A, Thorsen K, Curry TJ, Owen C, et al. Long-range epigenetic silencing of chromosome 5q31 protocadherins is involved in early and late stages of colorectal tumorigenesis through modulation of oncogenic pathways. Oncogene. 2012;31(40):4409–4419. doi: 10.1038/onc.2011.609. - DOI - PMC - PubMed
    1. Chen J, Lu Y, Meng S, Han MH, Lin C, Wang X. Alpha- and gamma-protocadherins negatively regulate PYK2. The Journal of biological chemistry. 2009;284(5):2880–2890. doi: 10.1074/jbc.M807417200. - DOI - PMC - PubMed

Publication types