. 2019 Sep;31(9):2070-2088.
doi: 10.1105/tpc.18.00929. Epub 2019 Jul 9.

Differential UVR8 Signal across the Stem Controls UV-B-Induced Inflorescence Phototropism

Affiliations

Differential UVR8 Signal across the Stem Controls UV-B-Induced Inflorescence Phototropism

Lucas Vanhaelewyn et al. Plant Cell. 2019 Sep.

Abstract

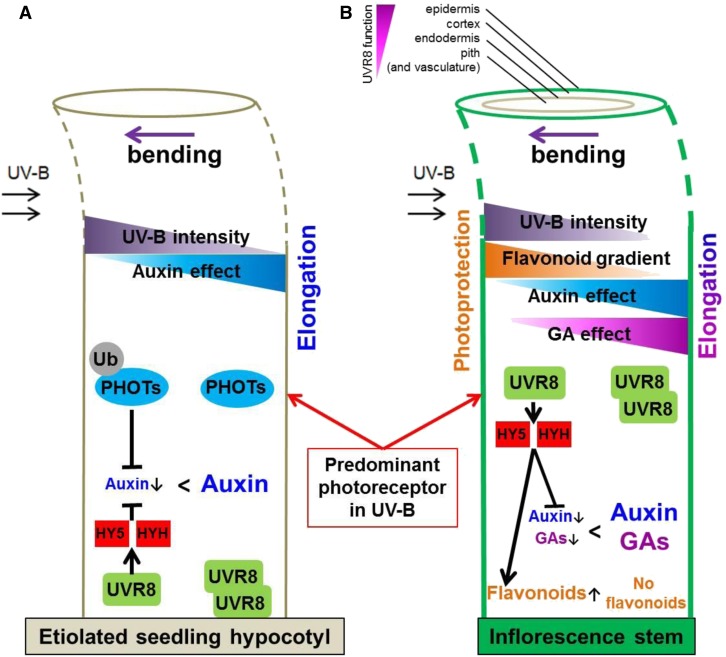
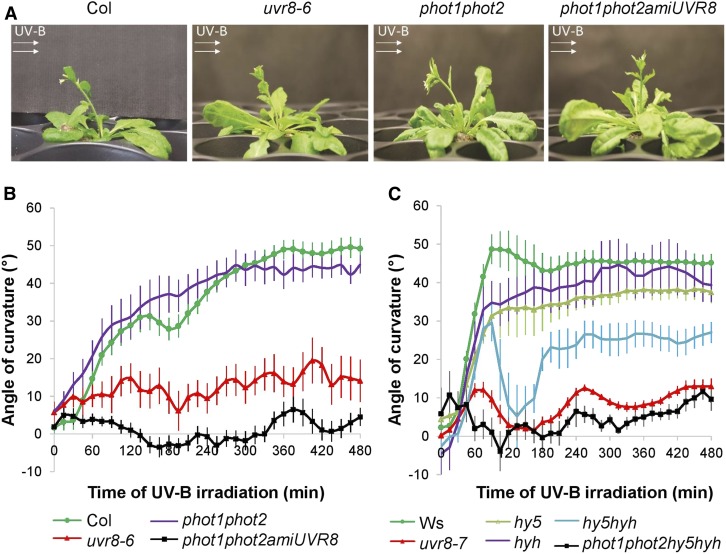
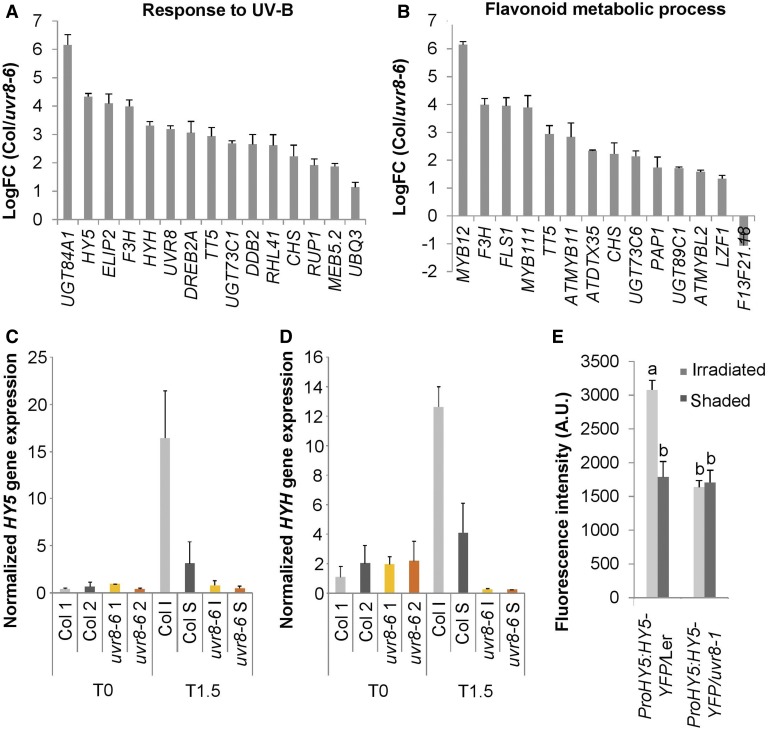
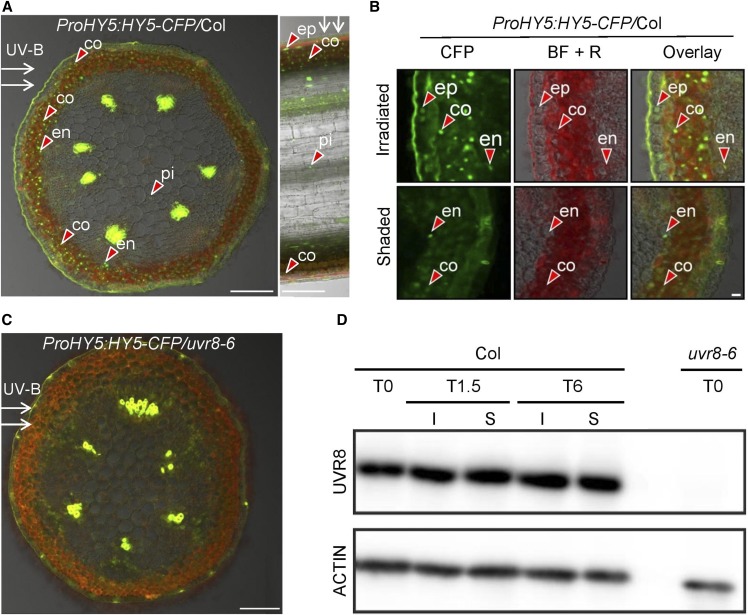
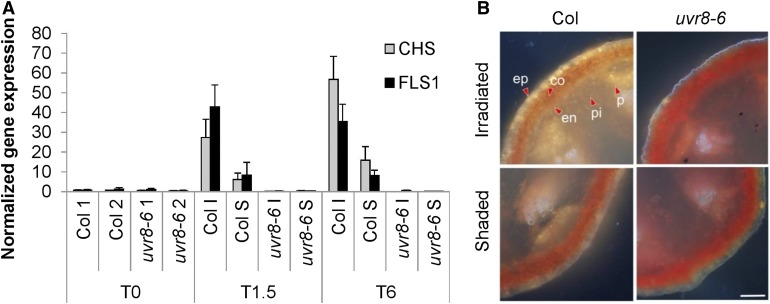
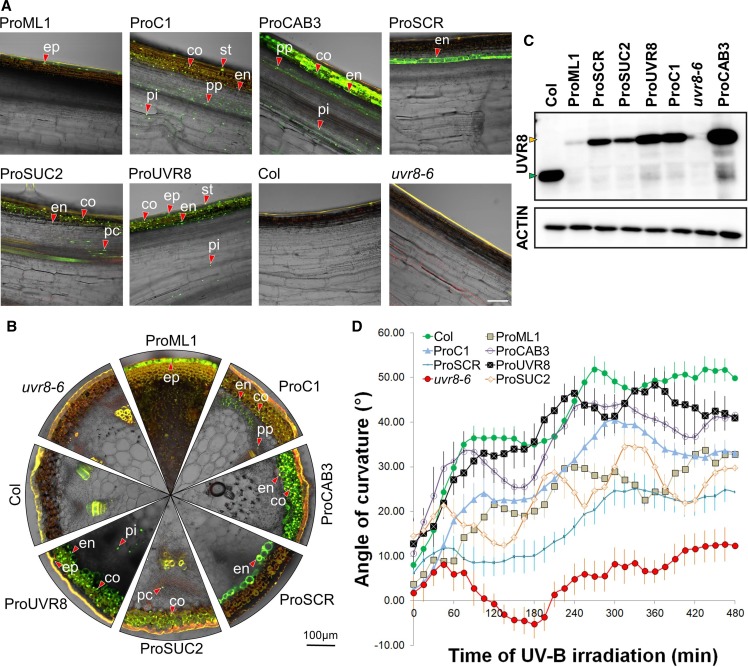
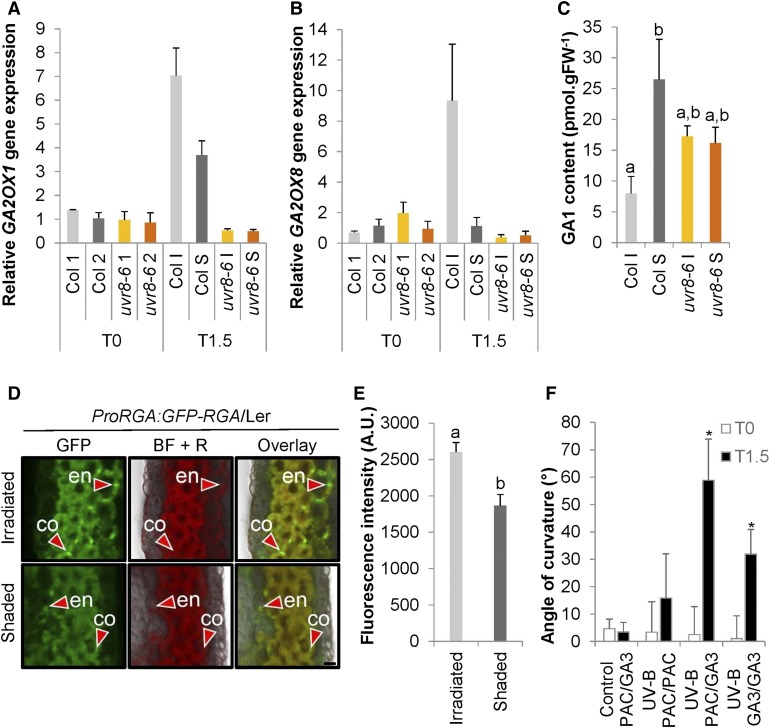
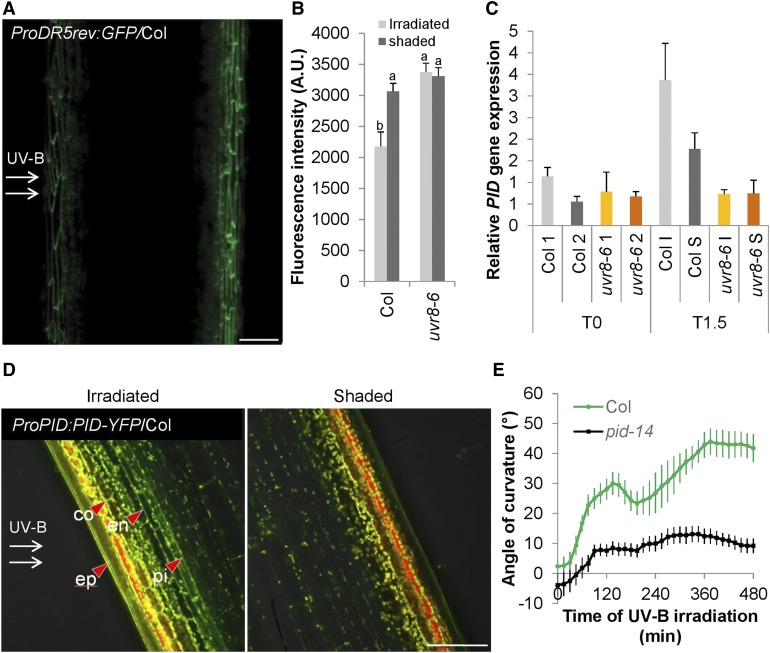
In the course of evolution, plants have developed mechanisms that orient their organs toward the incoming light. At the seedling stage, positive phototropism is mainly regulated by phototropin photoreceptors in blue and UV wavelengths. Contrasting with this, we report that UV RESISTANCE LOCUS8 (UVR8) serves as the predominant photoreceptor of UV-B-induced phototropic responses in Arabidopsis (Arabidopsis thaliana) inflorescence stems. We examined the molecular mechanisms underlying this response and our findings support the Blaauw theory (Blaauw, 1919), suggesting rapid differential growth through unilateral photomorphogenic growth inhibition. UVR8-dependent UV-B light perception occurs mainly in the epidermis and cortex, but deeper tissues such as endodermis can also contribute. Within stems, a spatial difference of UVR8 signal causes a transcript and protein increase of transcription factors ELONGATED HYPOCOTYL5 (HY5) and its homolog HY5 HOMOLOG at the UV-B-exposed side. The irradiated side shows (1) strong activation of flavonoid synthesis genes and flavonoid accumulation; (2) increased gibberellin (GA)2-oxidase expression, diminished GA1 levels, and accumulation of the DELLA protein REPRESSOR OF GA1; and (3) increased expression of the auxin transport regulator PINOID, contributing to diminished auxin signaling. Together, the data suggest a mechanism of phototropin-independent inflorescence phototropism through multiple, locally UVR8-regulated hormone pathways.


Figures

Figure 1.
Figure 1.
Model for Seedling and Inflorescence Stem Bending to Unilateral UV-B light Radiation. (A) Current state of knowledge about UV-B–mediated phototropism. PHOTs are able to absorb and respond to UV-B irradiation and act as the predominant UV-B photoreceptor, resulting in positive phototropism in etiolated seedlings. However, in the absence of active PHOTs, a UV-B–positive phototropic response exists that is UVR8 and HY5/HYH dependent that, in turn, alike PHOTs affects auxin signaling (Eisinger et al., 2003; Christie and Murphy, 2013; Goyal et al., 2013; Briggs, 2014; Vandenbussche et al., 2014; Jenkins, 2017b). (B) Different from seedlings, UVR8 is the dominant UV-B photoreceptor in inflorescence stems. Unilateral exposure to UV-B leads to unilateral UVR8 activation, inducing a strong accumulation of HY5 and HYH transcript and protein. These transcription factors regulate auxin efflux, GA catabolism, and flavonoid biosynthesis. Unilateral UVR8 activity therefore inhibits growth at the irradiated side, whereas the shaded side can still elongate and thus allows bending toward the UV-B source. Arrows next to auxins, GAs, or flavonoids indicate up- or downregulation.
Figure 2.
Figure 2.
Phototropic Response of Arabidopsis Inflorescence Stems under Unilateral UV-B Irradiation. (A) Photographs of Arabidopsis inflorescence stems having a height of ∼5 cm that were exposed to unilateral 1.3 µmol m−2 s−1 311 nm irradiation for 24 h (UV-B treatment). This UV-B treatment was given to four different genotypes: the wild type (Col), lack-of-function UVR8 mutant uvr8-6, phototropin double mutant phot1 phot2, and the triple mutant phot1 phot2 amiUVR8. The direction of the UV-B irradiation is indicated by white arrows. (B) and (C) Kinetic analysis of the phototropic bending response of the inflorescence stems upon UV-B treatment. The bending angle was quantified every 15 min for 8 h. UVR8-deficient lines (uvr8-6 and uvr8-7), phototropin double mutant with or without UVR8 (phot1 phot2 and phot1 phot2 amiUVR8, respectively), hy5 and hyh single and double (hy5 hyh) mutants, and a quadruple mutant (phot1 phot2 hy5 hyh) are compared with the corresponding wild type (Col and Ws). Error bars indicate se (n ≥ 8).
Figure 3.
Figure 3.
Spatial Expression Differences in Arabidopsis Inflorescence Stems Exposed to Unilateral UV-B. (A) and (B) Gene expression analysis by RNA-seq of the bending zone after 1.5 h of 1.3 µmol m−2 s−1 311 nm unilateral UV-B treatment of Col and uvr8-6 stems. UVR8-regulated genes were selected. Genes with a logFC value higher than 1 and/or lower than −1 with a p-value < 0.05 were selected for GO analysis. The logFC values of the overrepresented genes of the response to UV-B category (A) and the flavonoid metabolic process (B) are shown. With positive values, induced and negative values repressed in Col, compared with uvr8-6. Error bars indicate se (n = 3). (C) and (D) HY5 (C) and HYH (D) expression in inflorescence stems exposed to 1.3 µmol m−2 s−1 of unilateral irradiation (UV-B treatment) for 1.5 h (T1.5), or nonexposed inflorescence stems (T0) was determined by RT-qPCR. The irradiated side (I) was dissected from the shaded side (S). Nonexposed plants were dissected longitudinally in two halves without specific positioning (1 and 2), both for the wild type (Col) and uvr8-6 mutants. Error bars indicate se (n = 3). (E) Quantification of fluorescent HY5-YFP signal in the inflorescence stem cortex of the wild-type (Ler) or uvr8-1 plants expressing the ProHY5:HY5-YFP transgene after 3 h of unilateral 1.3 µmol m−2 s−1 UV-B treatment. Error bars are se (n ≥ 6). The superscript lowercase letters (a, b) indicate statistically significant difference in YFP intensities across the inflorescence stems at the 0.05 level (p-value ≤ 0.003) based on independent samples Kruskal–Wallis test. A.U., arbitrary units.
Figure 4.
Figure 4.
Spatial HY5 Protein Accumulation Differences in UV-B–Exposed Arabidopsis Inflorescence Stems. (A) CLSM image of transverse (left) and longitudinal (right) section of a UV-B–treated inflorescence stem taken from a transgenic Col plant expressing the ProHY5:HY5-CFP transgene. White arrows indicate the direction of UV-B irradiation; red arrowheads point at selected nuclei containing HY5-CFP signal, observed in the epidermis (ep), cortex (co), endodermis (en), and pith (pi). HY5-CFP accumulation is mainly observed on the irradiated side of the stem. Bar = 100 µm. (B) High-resolution CLSM images of transverse section of a UV-B–treated inflorescence stem as described in (A). The CFP channel, bright-field + red channel for autofluorescence (BF + R), and the overlay are displayed from both the irradiated and shaded side. The red arrowheads point at selected nuclei containing HY5-CFP signal. Bar = 10 µm. (C) Same as described in (A) but using the uvr8-6 mutant background. (D) Col and uvr8-6 plants having inflorescence stems of 5-cm height were irradiated with unilateral 1.3 µmol m−2 s−1 of UV-B for 1.5 h (T1.5) or 6 h (T6) or were not irradiated (T0). Inflorescence stems were dissected, and total protein extracts were isolated from the shaded (S) and the irradiated (I) stem sides. Immunoblot analysis was used to determine the level of endogenous UVR8 (top), whereas hybridization using ACTIN-specific antibody was applied as loading control (bottom).
Figure 5.
Figure 5.
Asymmetric Accumulation of Transcripts Encoding Flavonoid Biosynthesis Enzymes and Flavonols. (A) RT-qPCR analysis of CHS and FLS1 gene expression in stems irradiated with unilateral 1.3 µmol m−2 s−1 of 311 nm UV-B light for 1.5 h (T1.5) or 6 h (T6) or without UV-B exposure (T0). Irradiated side (I) was dissected from the shaded side (S); stems of nonexposed plants were dissected without orientation in two halves (1 and 2), both for the wild type (Col) and uvr8-6 mutants. Error bars are se (n = 3). (B) Comparison of flavonol content of the irradiated side versus the shaded side of Arabidopsis inflorescence stems after UV-B treatment for 12 h. Transverse sections were made and mounted in DPBA and were documented by epifluorescence microscopy. The quercetin derivatives are visible as yellow/orange; red shows autofluorescence. Arrowheads indicate chosen cells in the epidermis (ep), cortex (co), endodermis (en), phloem (P), and pith (pi). Bar = 100 µm.
Figure 6.
Figure 6.
Stem Bending Phenotype of the uvr8 Mutant Can Be Complemented in YFP-UVR8 Expression in Different Cell Types. (A) Longitudinal sections made from Arabidopsis inflorescence stems demonstrate the expression pattern of YFP-UVR8 expressed under the control of different promoters in the uvr8-6 background. Col and uvr8-6 are presented as controls. The presented images are the overlay of the green and bright-field channels obtained from CLSM. Green color indicates the YFP signal; red color shows autofluorescence. A few representative nuclei containing YFP-UVR8 are marked in the epidermis (ep), stomata (st), cortex (co), endodermis (en), phloem parenchyma (pp), phloem companion cells (pc), and pith (pi). Bar = 100 µm. (B) Transverse sections of the same stems as depicted in (A). The marked nuclei in different tissues are named also as in (A). (C) Immunoblot analysis of UVR8 and YFP-UVR8 expression levels in the inflorescence stems. (Top) Result of the membrane hybridization using the anti-UVR8 antibody, with the green arrowhead indicating native UVR8 and the orange arrowhead indicating YFP-UVR8. (Bottom) Result of immune staining using anti-ACTIN antibody, demonstrating the equal total protein amounts in the lanes. (D) Kinetic analysis of the bending response of Arabidopsis inflorescence stems exposed to unilateral UV-B treatment. Inflorescence stem reorientation was quantified over time. Error bars show se (n ≥ 8). The full names of the transgenic lines throughout this figure are as follows: ProML1, ProML1:YFP-UVR8/uvr8-6; ProC1, ProC1:YFP-UVR8/uvr8-6; ProCAB3, ProCAB3:YFP-UVR8/uvr8-6; ProSCR, ProSCR:YFP-UVR8/uvr8-6; ProUVR8, ProUVR8:YFP-UVR8/uvr8-6; ProSUC2, ProSUC2:YFP-UVR8/uvr8-6.
Figure 7.
Figure 7.
Differential GA Signal Is Involved in UV-B–Induced Phototropic Responses. (A) and (B) GA2OX1 (A) and GA2OX8 (B) expression was determined in stems that were exposed to 1.3 µmol m−2 s−1 of unilateral UV-B irradiation for 1.5 h (T1.5) or nonexposed (T0). The irradiated side (I) was dissected from the shaded side (S), and nonexposed plants were dissected longitudinally without specific direction in two halves (1 and 2), both for the wild type (Col) and uvr8-6 mutants. Error bars are se (n = 3). (C) GA1 content measured in stems after 3 h of UV-B treatment as described in (A) and (B). Error bars are se (n = 4). The superscript lowercase letters (a, b) indicate statistically significant difference in the GA1 content at the 0.1 level (p-value = 0.084) based on an independent samples Kruskal–Wallis test. (D) Transverse section of stems from pRGA:GFP-RGA/Ler plants after 4 h of UV-B treatment was examined using CLSM. A few representative nuclei containing GFP-RGA are marked with red arrowheads in the cortex (co) and endodermis (en); the GFP channel, bright-field + red channel for autofluorescence (BF + R), and the overlay are displayed from both the irradiated and shaded side. Bar = 10 µm. (E) Quantification of the RGA-GFP signal obtained by CLSM in the stem endodermis of pRGA:RGA-GFP/Ler plants irradiated by unilateral UV-B. Error bars indicate se (n = 12). The superscript lowercase letters (a, b) indicate statistically significant difference in GFP intensities across the inflorescence stems at the 0.05 level (p-value = 0.001) based on an independent samples Mann–Whitney U test. A.U., arbitrary units. (F) Angle of curvature of the wild-type (Col) inflorescence stems with a split stem base that had PAC or GA treatment on either side and were subsequently irradiated with unilateral UV-B (UV-B) or kept in white light (control). The measurement of stem curvature was done at the beginning (T0) and after 1.5 h of irradiation (T1.5). Error bars indicate se (n ≥ 7). The asterisks indicate statistically significant difference in the angle of curvature of inflorescence stems at T1.5 versus T0 at the 0.05 level (p-value < 0.001) based on a Mann–Whitney U test.
Figure 8.
Figure 8.
Auxin Gradient Is Established for UV-B–Induced Phototropic Responses. (A) CLSM image of expressing ProDR5rev:GFP/Col after 4 h of unilateral 1.3 µmol m−2 s−1 UV-B (UV-B treatment). Green color indicates GFP. Bar = 100 µm. (B) Quantification of ProDR5rev:3xVenus-N7 in the epidermis after 4 h of UV-B treatment based on CLSM. Error bars indicate se (n ≥ 9). The superscript lowercase letters (a, b) indicate statistically significant difference in Venus-N7-intensities across the inflorescence stems at the 0.1 level (p-value = 0.002) based on independent samples Kruskal–Wallis test. A.U., arbitrary units. (C) RT-qPCR experiment of the PID gene expression in stems that were exposed to unilateral UV-B treatment for 1.5 h (T1.5) or nonexposed (T0). The irradiated side (I) was dissected from the shaded side (S), and nonexposed plants were dissected longitudinally without specific direction in two halves (1 and 2), both for the wild type (Col) and uvr8-6 mutants. Error bars are se (n = 3). (D) CLSM image of ProPID:PID-YFP/Col after 4 h of unilateral UV-B treatment expressed in Col stem. YFP signal is observed in the membranes of the epidermis (ep), cortex (co), endodermis (en), and pith (pi). Green color indicates the YFP signal; yellow and red show autofluorescence. Bar = 100 µm. (E) Kinetic analysis of the bending response of the UV-B–treated wild-type (Col) and pid-14 mutant inflorescence stems. Stem orientation was quantified over time. Error bars indicate se (n ≥ 12).
None

References

    1. Abbas M., Hernandez-Garcia J., Pollmann S., Samodelov S.L., Kolb M., Friml J., Hammes U.Z., Zurbriggen M.D., Blázquez M.A., Alabadí D. (2018). Auxin methylation is required for differential growth in Arabidopsis. Proc. Natl. Acad. Sci. USA 115: 6864–6869. - PMC - PubMed
    1. Achard P., Liao L., Jiang C., Desnos T., Bartlett J., Fu X., Harberd N.P. (2007). DELLAs contribute to plant photomorphogenesis. Plant Physiol. 143: 1163–1172. - PMC - PubMed
    1. Amarasinghe R., Poldy J., Matsuba Y., Barrow R.A., Hemmi J.M., Pichersky E., Peakall R. (2015). UV-B light contributes directly to the synthesis of chiloglottone floral volatiles. Ann. Bot. 115: 693–703. - PMC - PubMed
    1. Atamian H.S., Creux N.M., Brown E.A., Garner A.G., Blackman B.K., Harmer S.L. (2016). Circadian regulation of sunflower heliotropism, floral orientation, and pollinator visits. Science 353: 587–590. - PubMed
    1. Aukerman M.J., Hirschfeld M., Wester L., Weaver M., Clack T., Amasino R.M., Sharrock R.A. (1997). A deletion in the PHYD gene of the Arabidopsis Wassilewskija ecotype defines a role for phytochrome D in red/far-red light sensing. Plant Cell 9: 1317–1326. - PMC - PubMed

Publication types

MeSH terms

Substances