

Metabolic Model of the Phytophthora infestans-Tomato Interaction Reveals Metabolic Switches during Host Colonization
- PMID: 31289172
- PMCID: PMC6747730
- DOI: 10.1128/mBio.00454-19
Metabolic Model of the Phytophthora infestans-Tomato Interaction Reveals Metabolic Switches during Host Colonization
Abstract
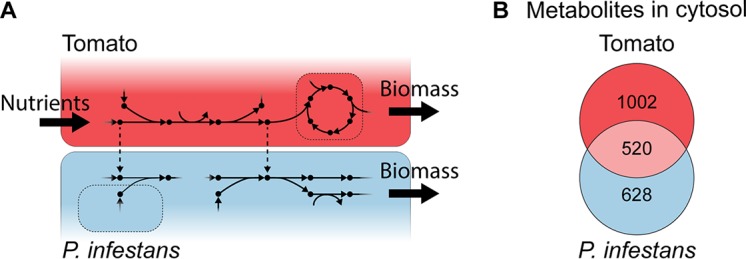
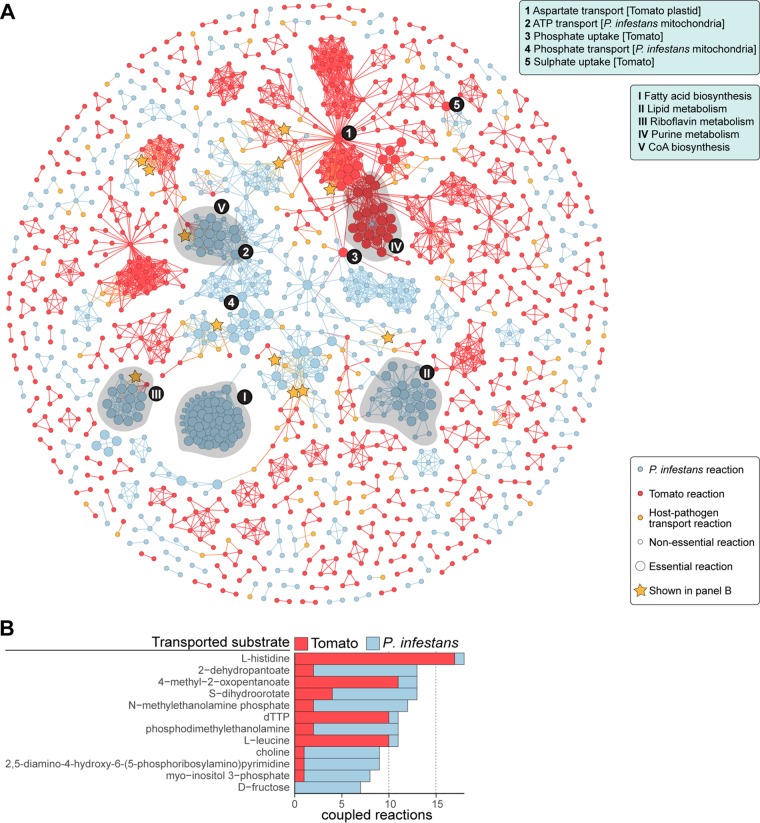
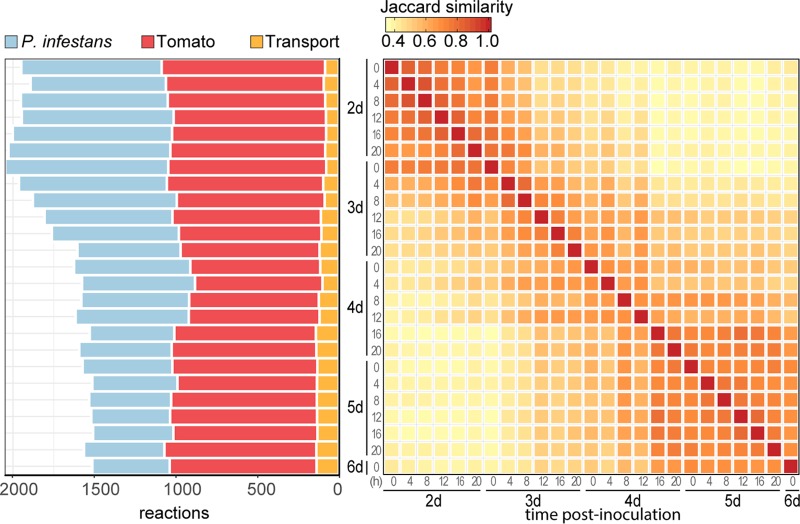
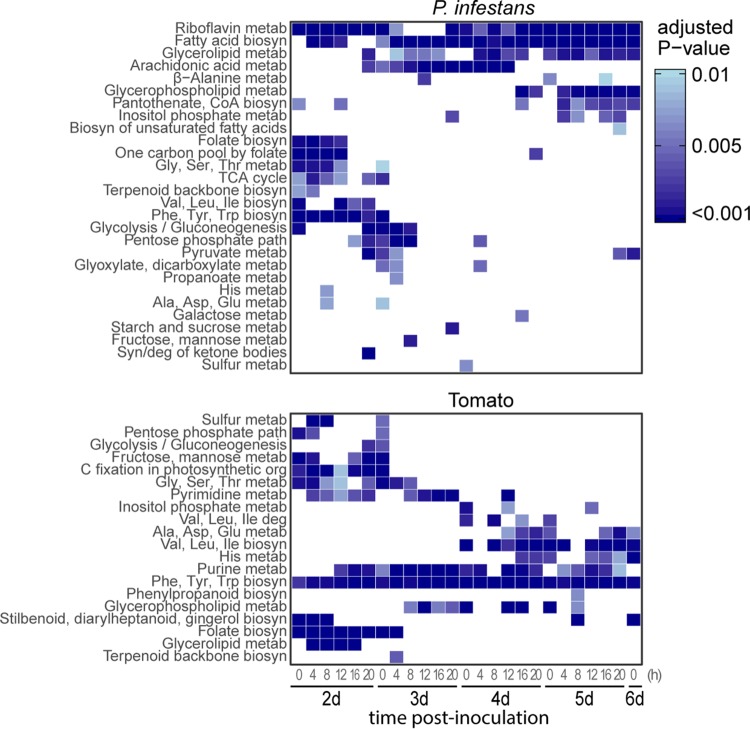
The oomycete pathogen Phytophthora infestans causes potato and tomato late blight, a disease that is a serious threat to agriculture. P. infestans is a hemibiotrophic pathogen, and during infection, it scavenges nutrients from living host cells for its own proliferation. To date, the nutrient flux from host to pathogen during infection has hardly been studied, and the interlinked metabolisms of the pathogen and host remain poorly understood. Here, we reconstructed an integrated metabolic model of P. infestans and tomato (Solanum lycopersicum) by integrating two previously published models for both species. We used this integrated model to simulate metabolic fluxes from host to pathogen and explored the topology of the model to study the dependencies of the metabolism of P. infestans on that of tomato. This showed, for example, that P. infestans, a thiamine auxotroph, depends on certain metabolic reactions of the tomato thiamine biosynthesis. We also exploited dual-transcriptome data of a time course of a full late blight infection cycle on tomato leaves and integrated the expression of metabolic enzymes in the model. This revealed profound changes in pathogen-host metabolism during infection. As infection progresses, P. infestans performs less de novo synthesis of metabolites and scavenges more metabolites from tomato. This integrated metabolic model for the P. infestans-tomato interaction provides a framework to integrate data and generate hypotheses about in planta nutrition of P. infestans throughout its infection cycle.IMPORTANCE Late blight disease caused by the oomycete pathogen Phytophthora infestans leads to extensive yield losses in tomato and potato cultivation worldwide. To effectively control this pathogen, a thorough understanding of the mechanisms shaping the interaction with its hosts is paramount. While considerable work has focused on exploring host defense mechanisms and identifying P. infestans proteins contributing to virulence and pathogenicity, the nutritional strategies of the pathogen are mostly unresolved. Genome-scale metabolic models (GEMs) can be used to simulate metabolic fluxes and help in unravelling the complex nature of metabolism. We integrated a GEM of tomato with a GEM of P. infestans to simulate the metabolic fluxes that occur during infection. This yields insights into the nutrients that P. infestans obtains during different phases of the infection cycle and helps in generating hypotheses about nutrition in planta.
Keywords: Phytophthora infestans; metabolic modeling; metabolism; oomycetes; tomato.
Copyright © 2019 Rodenburg et al.
Figures
Similar articles
-
Quantitative Proteomics Reveals the Dynamic Regulation of the Tomato Proteome in Response to Phytophthora infestans.Int J Mol Sci. 2021 Apr 17;22(8):4174. doi: 10.3390/ijms22084174. Int J Mol Sci. 2021. PMID: 33920680 Free PMC article.
-
Prediction and validation of potential pathogenic microRNAs involved in Phytophthora infestans infection.Mol Biol Rep. 2014 Mar;41(3):1879-89. doi: 10.1007/s11033-014-3037-5. Epub 2014 Jan 16. Mol Biol Rep. 2014. PMID: 24430294
-
De novo pyrimidine biosynthesis in the oomycete plant pathogen Phytophthora infestans.Gene. 2014 Mar 10;537(2):312-21. doi: 10.1016/j.gene.2013.12.009. Epub 2013 Dec 18. Gene. 2014. PMID: 24361203
-
How Does Phytophthora infestans Evade Control Efforts? Modern Insight Into the Late Blight Disease.Phytopathology. 2018 Aug;108(8):916-924. doi: 10.1094/PHYTO-04-18-0130-IA. Epub 2018 Jul 6. Phytopathology. 2018. PMID: 29979126 Review.
-
Late blight in tomato: insights into the pathogenesis of the aggressive pathogen Phytophthora infestans and future research priorities.Planta. 2021 May 8;253(6):119. doi: 10.1007/s00425-021-03636-x. Planta. 2021. PMID: 33963935 Review.
Cited by
-
Environment-coupled models of leaf metabolism.Biochem Soc Trans. 2021 Feb 26;49(1):119-129. doi: 10.1042/BST20200059. Biochem Soc Trans. 2021. PMID: 33492365 Free PMC article. Review.
-
New insights in metabolism modelling to decipher plant-microbe interactions.New Phytol. 2025 May;246(4):1485-1493. doi: 10.1111/nph.70063. Epub 2025 Mar 21. New Phytol. 2025. PMID: 40119556 Free PMC article. Review.
-
Comparison of the Distinct, Host-Specific Response of Three Solanaceae Hosts Induced by Phytophthora infestans.Int J Mol Sci. 2021 Oct 12;22(20):11000. doi: 10.3390/ijms222011000. Int J Mol Sci. 2021. PMID: 34681661 Free PMC article.
-
Established Pseudomonas syringae pv. tomato infection disrupts immigration of leaf surface bacteria to the apoplast.Front Microbiol. 2025 Feb 3;16:1546411. doi: 10.3389/fmicb.2025.1546411. eCollection 2025. Front Microbiol. 2025. PMID: 39963495 Free PMC article.
-
Analysis of QTLs and Candidate Genes for Tassel Symptoms in Maize Infected with Sporisorium reilianum.Int J Mol Sci. 2022 Nov 20;23(22):14416. doi: 10.3390/ijms232214416. Int J Mol Sci. 2022. PMID: 36430897 Free PMC article.
References
-
- Kamoun S, Furzer O, Jones JDG, Judelson HS, Ali GS, Dalio RJD, Roy SG, Schena L, Zambounis A, Panabières F, Cahill D, Ruocco M, Figueiredo A, Chen XR, Hulvey J, Stam R, Lamour K, Gijzen M, Tyler BM, Grünwald NJ, Mukhtar MS, Tomé DFA, Tör M, Van Den Ackerveken G, Mcdowell J, Daayf F, Fry WE, Lindqvist-Kreuze H, Meijer HJG, Petre B, Ristaino J, Yoshida K, Birch PRJ, Govers F. 2015. The top 10 oomycete pathogens in molecular plant pathology. Mol Plant Pathol 16:413–434. doi:10.1111/mpp.12190. - DOI - PMC - PubMed
Publication types
MeSH terms
Substances
LinkOut - more resources
Full Text Sources
Research Materials
