. 2019 Jul 9;10(4):e01319-19.
doi: 10.1128/mBio.01319-19.

Ubiquinone Biosynthesis over the Entire O2 Range: Characterization of a Conserved O2-Independent Pathway

Affiliations

Ubiquinone Biosynthesis over the Entire O2 Range: Characterization of a Conserved O2-Independent Pathway

Ludovic Pelosi et al. mBio. .

Abstract

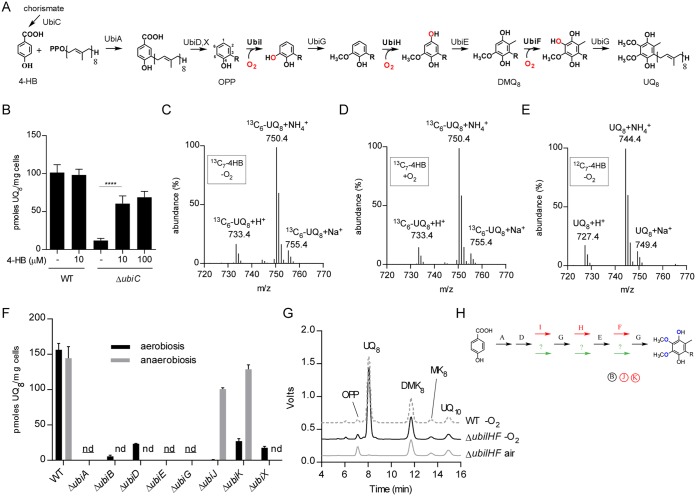
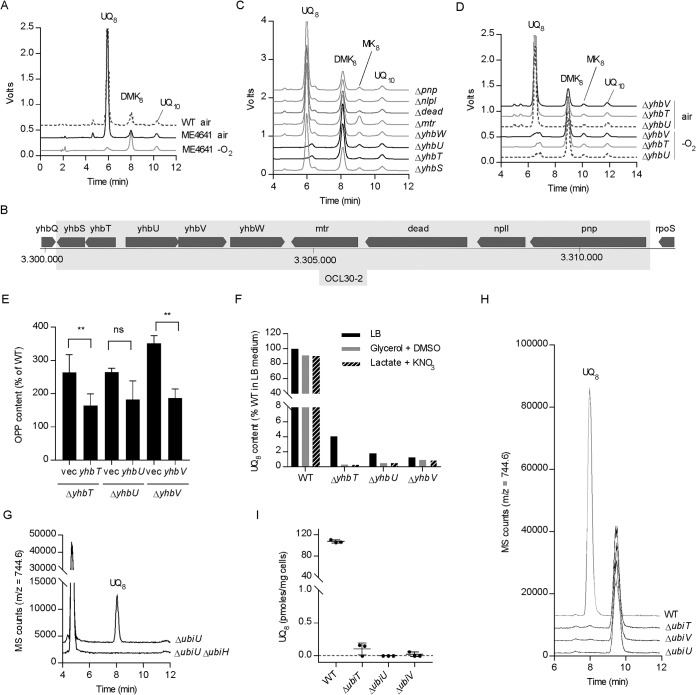
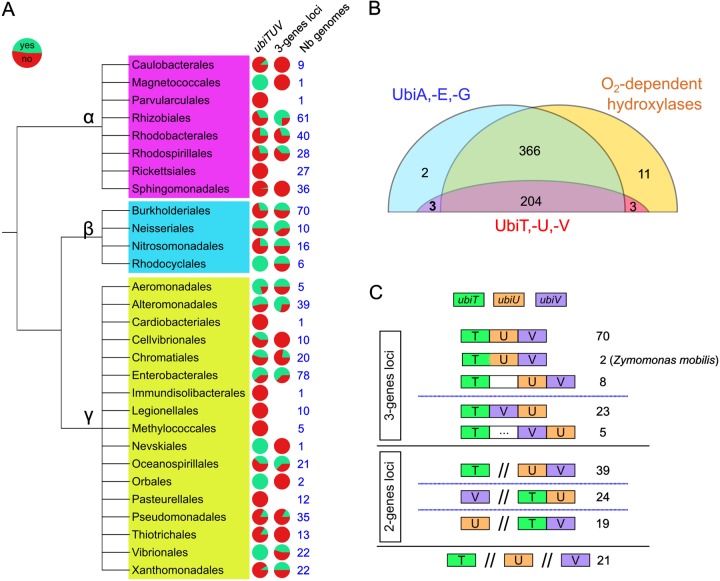
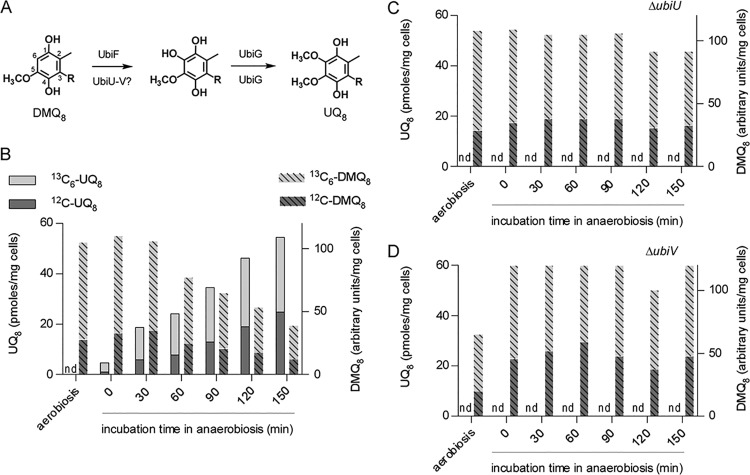
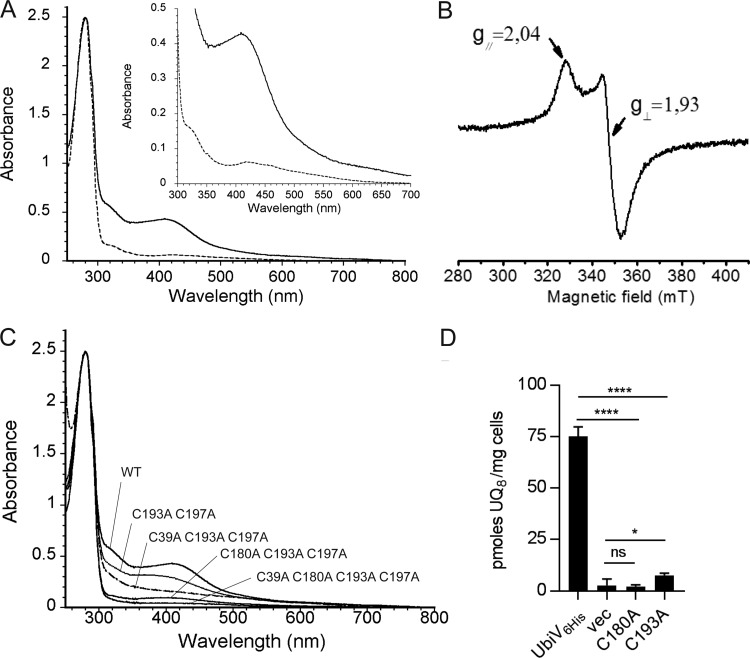
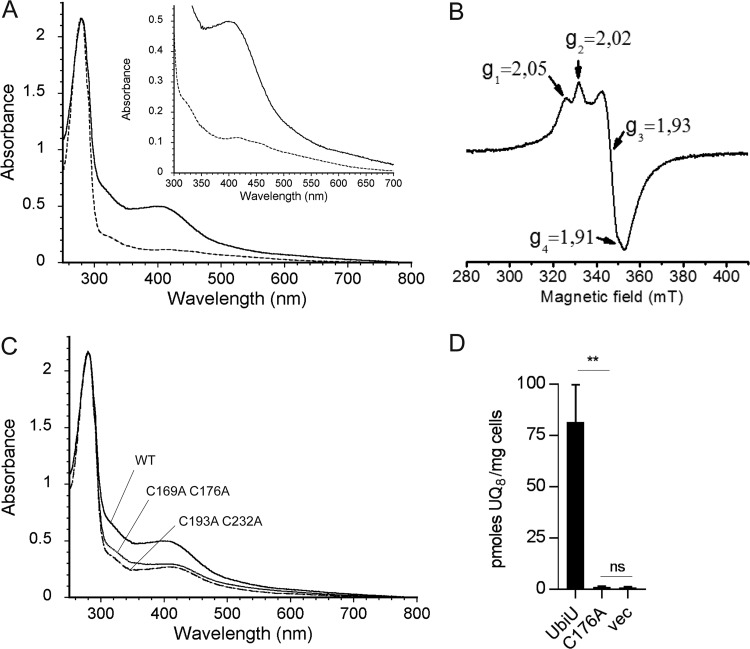
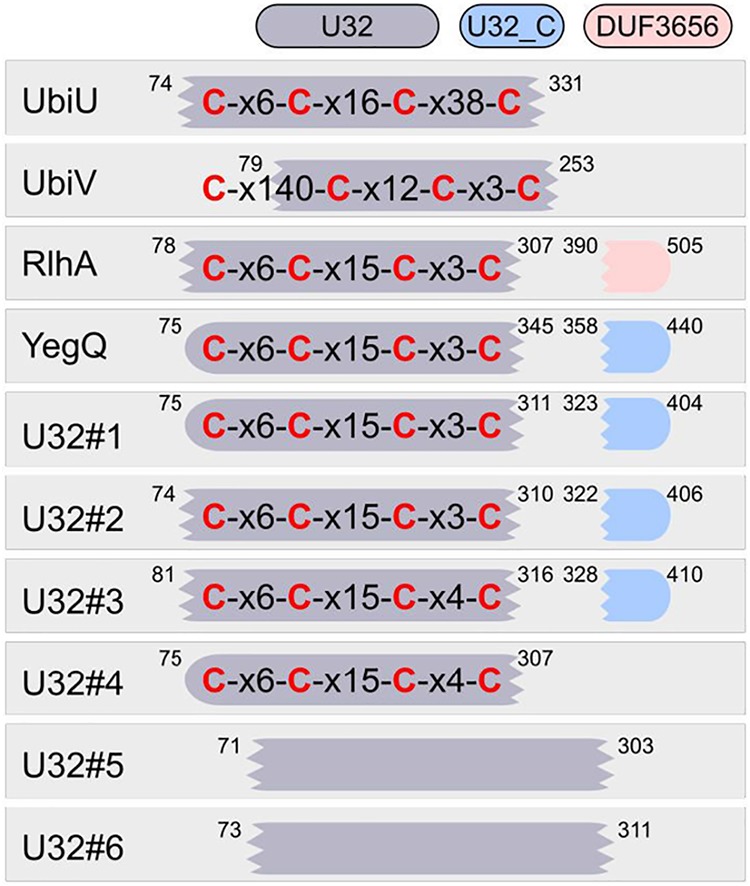
Most bacteria can generate ATP by respiratory metabolism, in which electrons are shuttled from reduced substrates to terminal electron acceptors, via quinone molecules like ubiquinone. Dioxygen (O2) is the terminal electron acceptor of aerobic respiration and serves as a co-substrate in the biosynthesis of ubiquinone. Here, we characterize a novel, O2-independent pathway for the biosynthesis of ubiquinone. This pathway relies on three proteins, UbiT (YhbT), UbiU (YhbU), and UbiV (YhbV). UbiT contains an SCP2 lipid-binding domain and is likely an accessory factor of the biosynthetic pathway, while UbiU and UbiV (UbiU-UbiV) are involved in hydroxylation reactions and represent a novel class of O2-independent hydroxylases. We demonstrate that UbiU-UbiV form a heterodimer, wherein each protein binds a 4Fe-4S cluster via conserved cysteines that are essential for activity. The UbiT, -U, and -V proteins are found in alpha-, beta-, and gammaproteobacterial clades, including several human pathogens, supporting the widespread distribution of a previously unrecognized capacity to synthesize ubiquinone in the absence of O2 Together, the O2-dependent and O2-independent ubiquinone biosynthesis pathways contribute to optimizing bacterial metabolism over the entire O2 range.IMPORTANCE In order to colonize environments with large O2 gradients or fluctuating O2 levels, bacteria have developed metabolic responses that remain incompletely understood. Such adaptations have been recently linked to antibiotic resistance, virulence, and the capacity to develop in complex ecosystems like the microbiota. Here, we identify a novel pathway for the biosynthesis of ubiquinone, a molecule with a key role in cellular bioenergetics. We link three uncharacterized genes of Escherichia coli to this pathway and show that the pathway functions independently from O2 In contrast, the long-described pathway for ubiquinone biosynthesis requires O2 as a substrate. In fact, we find that many proteobacteria are equipped with the O2-dependent and O2-independent pathways, supporting that they are able to synthesize ubiquinone over the entire O2 range. Overall, we propose that the novel O2-independent pathway is part of the metabolic plasticity developed by proteobacteria to face various environmental O2 levels.

Keywords: bioenergetics; facultative anaerobes; hydroxylases; iron-sulfur; oxygen; peptidase U32; proteobacteria; quinones; respiration; ubiquinone.


Figures

FIG 1
FIG 1
Aerobic and anaerobic UQ biosynthetic pathways differ only in the hydroxylation steps. (A) O2-dependent UQ biosynthesis pathway in E. coli. The octaprenyl tail is represented by R on the biosynthetic intermediates, and the numbering of the aromatic carbon atoms is shown on OPP. Abbreviations used are 4-HB for 4-hydroxybenzoic acid, OPP for octaprenylphenol, DMQ8 for C6-demethoxy-ubiquinone 8, and UQ8 for ubiquinone 8. (B) UQ8 quantification of WT and ΔubiC cells grown anaerobically in glycerol-nitrate medium supplemented with the indicated concentrations of 4-HB or left unsupplemented. Values are means ± standard deviations (SD) (n = 3 to 6). ****, P < 0.0001 by unpaired Student's t test. (C to E) Mass spectra of UQ8 obtained by HPLC-MS analysis of lipid extracts from cells grown with 13C7-4-HB either anaerobically (C) or aerobically (D) or anaerobically with unlabeled 4-HB (E). (F) UQ8 quantification from WT and Δubi cells grown anaerobically in SMGN medium overnight or aerobically in LB medium until an OD of 0.8 was reached. nd, not detected under aerobic and anaerobic conditions; nd, not detected under anaerobic conditions. Values are means ± SD (n = 3 to 4). (G) HPLC-ECD analyses (mobile phase 1) of lipid extracts from 1 mg of WT or ΔubiIHF cells grown in LB medium under air or anaerobic conditions (−O2). Chromatograms are representative of n = 3 independent experiments (UQ10 used as a standard). (H) UQ biosynthesis represented with Ubi enzymes specific to the O2-dependent pathway (red), to the O2-independent pathway (green), or common to both pathways (black). The same color code applies to the accessory factors (circled).
FIG 2
FIG 2
yhbT, yhbU, and yhbV are essential to the anaerobic biosynthesis of UQ. (A) HPLC-ECD analysis of lipid extracts from ME4641 strain grown in SMGN either aerobically or anaerobically (−O2). (B) Genomic region covered by the OCL30-2 deletion in the ME4641 strain. (C) HPLC-ECD analysis of lipid extracts from knockout strains of the individual genes covered by the OCL30-2 deletion grown in SMGN anaerobically. (D) HPLC-ECD analysis of lipid extracts from ΔyhbT, ΔyhbU, and ΔyhbV strains constructed in the MG1655 background and grown in SMGN either aerobically or anaerobically. HPLC-ECD analyses with mobile phase 2 (A, C, and D). (E) OPP content (as a percentage of the WT, mass detection M+NH4+) in cells from Table 1. The Δyhb strains contain either an empty plasmid or a plasmid carrying the indicated gene and were cultured anaerobically in SMGN containing 0.02% arabinose. Values are means ± SD (n = 3 to 5). **, P < 0.01 by unpaired Student's t test. (F) UQ8 content (as a percentage of the WT grown in LB medium) of cells cultured anaerobically in SM containing the indicated carbon sources and electron acceptors. (G) Single-ion monitoring for UQ8 (M+NH4+) in HPLC-MS analysis (mobile phase 1) of lipid extracts from 1 mg of ΔubiU or ΔubiU ΔubiH cells grown in SMGN under anaerobic conditions. (H) Single-ion monitoring in HPLC-MS analysis (mobile phase 1) of lipid extracts from 1.6 mg of cells grown in LB medium under strict anaerobic conditions and quenched in methanol. Chromatograms are representative of n = 3 independent experiments (G and H). (I) UQ8 content of cells described for panel H (quantification of the signal at 8 min with m/z 744.6). Values are means ± SD (n = 3).
FIG 3
FIG 3
ubiT, -U, and -V occurrence and genetic architecture in proteobacterial genomes. (A) The proportion of genomes with (green) and without (red) all three genes, ubiTUV (left column), is indicated for each proteobacterial order known to synthesize UQ. The middle column, labeled 3-genes loci, displays the proportion of genomes with the three genes either at a single locus (green) or at different loci (red). The number of genomes analyzed for each order is given in the right column (Nb genomes). (B) Occurrence in the reference proteobacterial genomes of the marker proteins (UbiA, -E, and -G), of the O2-dependent hydroxylases, and of the UbiT,-U, and -V proteins. The number in boldface represents the 3 genomes (P. fulvum, M. marinus, and O. formigenes) containing exclusively the O2-independent pathway. (C) The distinct genetic architectures found for ubiT, -U, and -V in genomes where the three genes were present are displayed as boxes with different colors. The numbers of cases corresponding to each depicted architecture are given on the right. A white box corresponds to a gene found between the genes of interest, and a white box with dots corresponds to two to five genes between the genes of interest.
FIG 4
FIG 4
UbiU and UbiV are necessary for the anaerobic conversion of DMQ8 into UQ8. (A) Conversion of DMQ8 to UQ8 with enzymes of the O2-dependent and the O2-independent pathways, indicated above and below arrows (numbering of carbon atoms shown on DMQ8 and polyprenyl tail represented by R). (B) Quantification by HPLC-MS (monitoring of Na+ adducts) of unlabeled (12C) and labeled (13C6) DMQ8 and UQ8 in ΔubiC ΔubiF cells after aerobic growth and transition to anaerobiosis. (C and D) Same as panel B but with ΔubiC ΔubiF ΔubiU cells (C) and ΔubiC ΔubiF ΔubiV cells (D). nd, not detected. Results are representative of two independent experiments (B to D).
FIG 5
FIG 5
UbiV binds a [4Fe-4S] cluster. (A) UV-visible absorption spectra of as-purified UbiV (dotted line, 47 μM) and reconstituted holo-UbiV (solid line, 41 μM). The inset is an enlargement of the 300- to 700-nm region. The molar extinction coefficient, ε410nm, was determined to be 10.8 ± 0.4 mM−1 cm−1 for holo-UbiV. (B) X-band EPR spectrum of 785 μM dithionite-reduced holo-UbiV. Recording conditions were the following: temperature, 10K; microwave power, 10 mW; modulation amplitude, 0.6 mT. (C) Comparative UV-visible absorption spectra of WT and different Cys-to-Ala mutants of UbiV after [Fe-S] cluster reconstitution, with the following concentrations: 41 μM WT, 44 μM C193A C197A, 46 μM C39A C193A C197A, 47 μM C180A C193A C197A, and 54 μM C39A C180A C193A C197A. (A to C) Proteins were in 50 mM Tris-HCl, pH 8.5, 25 mM NaCl, 15% glycerol, 1 mM DTT. (D) UQ8 quantification of ΔubiV cells transformed with pBAD-UbiV6His, pBAD-UbiV6His C180A, pBAD-UbiV6His C193A, or empty pBAD and grown overnight in anaerobic SMGN plus 0.02% arabinose. Values are means ± SD (n = 4 to 5). *, P < 0.05; ****, P < 0.0001; both by unpaired Student's t test.
FIG 6
FIG 6
UbiU-V complex binds two [4Fe-4S] clusters. (A) UV-visible absorption spectra of as-purified UbiU-UbiV (dotted line, 17 μM) and reconstituted holo-UbiU-UbiV (solid line, 15.5 μM). The inset shows an enlargement of the 300- to 700-nm region. (B) X-band EPR spectrum of 339 μM dithionite-reduced holo-UbiU-UbiV. Recording conditions were the following: temperature, 10K; microwave power, 2 mW; modulation amplitude, 0.6 mT. (C) Comparative UV-visible absorption spectra of Cys-to-Ala mutants of UbiU in the UbiU-UbiV complex after metal cluster reconstitution with the following concentrations: 15.5 μM WT, 16.0 μM UbiU C169A C176A, and 16.0 μM UbiU C193A C232A. (A to C) Proteins were in 50 mM Tris-HCl, pH 8.5, 150 mM NaCl, 15% glycerol, 1 mM DTT. (D) UQ8 quantification of ΔubiU cells transformed with pBAD-UbiU (n = 4), pBAD-UbiU C176A (n = 2), or pBAD empty vector (n = 3) and grown overnight in anaerobic SMGN plus 0.02% arabinose. Values are means ± SD. **, P < 0.01; ns, not significant; both by unpaired Student's t test.
FIG 7
FIG 7
Conserved four-cysteine motifs in the U32 protease family. The conserved 4-cysteine motifs and Pfam domains (colored boxes) found in each U32 protease family are displayed for a set of reference sequences. These motifs were obtained by aligning the sequences listed by Kimura et al. (43). Conserved cysteines are in red, and x6 indicates that 6 residues were found between two conserved cysteines. Positions of the domains are displayed on the outside of the boxes for the reference sequences. Scrambled extremities show interrupted matches for the Pfam domain. No conserved cysteines were found for U32#5 and U32#6 (see the main text). Reference sequences were from E. coli for UbiU, UbiV, YegQ, and RhlA (YHBU_ECOLI, YHBV_ECOLI, YEGQ_ECOLI, and YDCP_ECOLI for RlhA). For the rest of the families, the sequence accession numbers were the following: R7JPV1_9FIRM for U32#1, R6XKQ3_9CLOT for U32#2, S1NZZ5_9ENTE for U32#3, H1YXA1_9EURY for U32#4, H3NJ45_9LACT for U32#5, and D5MIQ1_9BACT for U32#6.

Similar articles

Cited by

References

    1. Schoepp-Cothenet B, van Lis R, Atteia A, Baymann F, Capowiez L, Ducluzeau A-L, Duval S, ten Brink F, Russell MJ, Nitschke W. 2013. On the universal core of bioenergetics. Biochim Biophys Acta 1827:79–93. doi:10.1016/j.bbabio.2012.09.005. - DOI - PubMed
    1. Marteyn B, Scorza FB, Sansonetti PJ, Tang C. 2011. Breathing life into pathogens: the influence of oxygen on bacterial virulence and host responses in the gastrointestinal tract. Cell Microbiol 13:171–176. doi:10.1111/j.1462-5822.2010.01549.x. - DOI - PubMed
    1. Wallace N, Zani A, Abrams E, Sun Y. 2016. The impact of oxygen on bacterial enteric pathogens, p 179–204. In Sariaslani S, Gadd GM (ed), Advances in applied microbiology, vol 95 Elsevier Academic Press Inc, San Diego, CA. - PubMed
    1. Bettenbrock K, Bai H, Ederer M, Green J, Hellingwerf KJ, Holcombe M, Kunz S, Rolfe MD, Sanguinetti G, Sawodny O, Sharma P, Steinsiek S, Poole RK. 2014. Towards a systems level understanding of the oxygen response of Escherichia coli. Adv Microb Syst Biol 64:65–114. doi:10.1016/B978-0-12-800143-1.00002-6. - DOI - PubMed
    1. Morris RL, Schmidt TM. 2013. Shallow breathing: bacterial life at low O-2. Nat Rev Microbiol 11:205–212. doi:10.1038/nrmicro2970. - DOI - PMC - PubMed

Publication types

MeSH terms