

Ectopic Defense Gene Expression Is Associated with Growth Defects in Medicago truncatula Lignin Pathway Mutants
- PMID: 31289215
- PMCID: PMC6716239
- DOI: 10.1104/pp.19.00533
Ectopic Defense Gene Expression Is Associated with Growth Defects in Medicago truncatula Lignin Pathway Mutants
Abstract
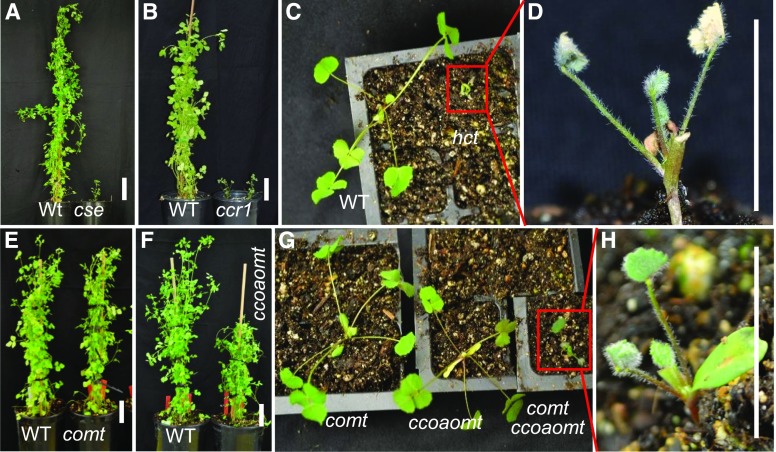
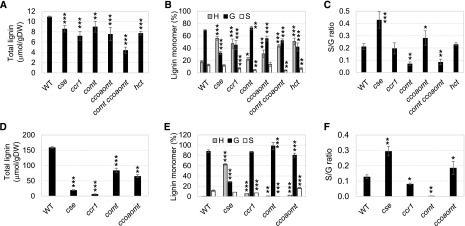
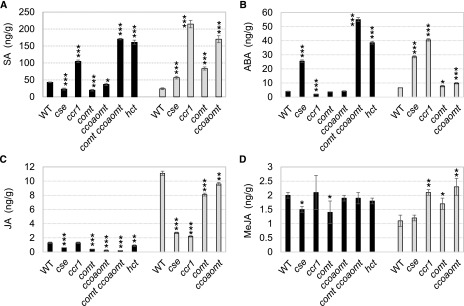
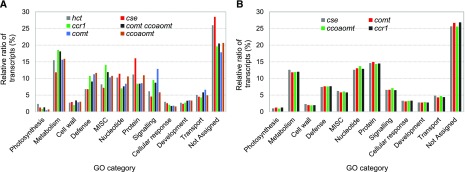
Lignin provides essential mechanical support for plant cell walls but decreases the digestibility of forage crops and increases the recalcitrance of biofuel crops. Attempts to modify lignin content and/or composition by genetic modification often result in negative growth effects. Although several studies have attempted to address the basis for such effects in individual transgenic lines, no common mechanism linking lignin modification with perturbations in plant growth and development has yet been identified. To address whether a common mechanism exists, we have analyzed transposon insertion mutants resulting in independent loss of function of five enzymes of the monolignol pathway, as well as one double mutant, in the model legume Medicago truncatula These plants exhibit growth phenotypes from essentially wild type to severely retarded. Extensive phenotypic, transcriptomic, and metabolomics analyses, including structural characterization of differentially expressed compounds, revealed diverse phenotypic consequences of lignin pathway perturbation that were perceived early in plant development but were not predicted by lignin content or composition alone. Notable phenotypes among the mutants with severe growth impairment were increased trichome numbers, accumulation of a variety of triterpene saponins, and extensive but differential ectopic expression of defense response genes. No currently proposed model explains the observed phenotypes across all lines. We propose that reallocation of resources into defense pathways is linked to the severity of the final growth phenotype in monolignol pathway mutants of M. truncatula, although it remains unclear whether this is a cause or an effect of the growth impairment.
© 2019 American Society of Plant Biologists. All Rights Reserved.
Figures


Similar articles
-
Loss of function of cinnamyl alcohol dehydrogenase 1 leads to unconventional lignin and a temperature-sensitive growth defect in Medicago truncatula.Proc Natl Acad Sci U S A. 2013 Aug 13;110(33):13660-5. doi: 10.1073/pnas.1312234110. Epub 2013 Jul 30. Proc Natl Acad Sci U S A. 2013. PMID: 23901113 Free PMC article.
-
An NAC transcription factor orchestrates multiple features of cell wall development in Medicago truncatula.Plant J. 2010 Jul 1;63(1):100-14. doi: 10.1111/j.1365-313X.2010.04223.x. Epub 2010 Apr 7. Plant J. 2010. PMID: 20408998
-
Modifying crops to increase cell wall digestibility.Plant Sci. 2012 Apr;185-186:65-77. doi: 10.1016/j.plantsci.2011.10.014. Epub 2011 Oct 25. Plant Sci. 2012. PMID: 22325867 Review.
-
Growth-defense trade-offs and yield loss in plants with engineered cell walls.New Phytol. 2021 Jul;231(1):60-74. doi: 10.1111/nph.17383. Epub 2021 May 4. New Phytol. 2021. PMID: 33811329
-
Functional Genomics in the Study of Metabolic Pathways in Medicago truncatula: An Overview.Methods Mol Biol. 2018;1822:315-337. doi: 10.1007/978-1-4939-8633-0_20. Methods Mol Biol. 2018. PMID: 30043312 Review.
Cited by
-
Injectable Antioxidant and Oxygen-Releasing Lignin Composites to Promote Wound Healing.ACS Appl Mater Interfaces. 2023 Apr 19;15(15):18639-18652. doi: 10.1021/acsami.2c22982. Epub 2023 Apr 6. ACS Appl Mater Interfaces. 2023. PMID: 37022100 Free PMC article.
-
Pectin-derived immune elicitors in response to lignin modification in plants.Proc Natl Acad Sci U S A. 2020 Mar 3;117(9):4442-4444. doi: 10.1073/pnas.2000509117. Epub 2020 Feb 6. Proc Natl Acad Sci U S A. 2020. PMID: 32029583 Free PMC article. No abstract available.
-
FERONIA and wall-associated kinases coordinate defense induced by lignin modification in plant cell walls.Sci Adv. 2023 Mar 10;9(10):eadf7714. doi: 10.1126/sciadv.adf7714. Epub 2023 Mar 10. Sci Adv. 2023. PMID: 36897948 Free PMC article.
-
Manipulating microRNA miR408 enhances both biomass yield and saccharification efficiency in poplar.Nat Commun. 2023 Jul 18;14(1):4285. doi: 10.1038/s41467-023-39930-3. Nat Commun. 2023. PMID: 37463897 Free PMC article.
-
Clavibacter michiganensis Downregulates Photosynthesis and Modifies Monolignols Metabolism Revealing a Crosstalk with Tomato Immune Responses.Int J Mol Sci. 2021 Aug 5;22(16):8442. doi: 10.3390/ijms22168442. Int J Mol Sci. 2021. PMID: 34445148 Free PMC article.
References
-
- Anterola AM, Lewis NG (2002) Trends in lignin modification: A comprehensive analysis of the effects of genetic manipulations/mutations on lignification and vascular integrity. Phytochemistry 61: 221–294 - PubMed
-
- Ashraf M, Foolad MR (2007) Roles of glycine betaine and proline in improving plant abiotic stress resistance. Environ Exp Bot 59: 206–216
-
- Augustin JM, Kuzina V, Andersen SB, Bak S (2011) Molecular activities, biosynthesis and evolution of triterpenoid saponins. Phytochemistry 72: 435–457 - PubMed
Publication types
MeSH terms
Substances
LinkOut - more resources
Full Text Sources
