. 2019 Jul 9;9(1):9950.
doi: 10.1038/s41598-019-46240-6.

Acute stress-induced change in polysialic acid levels mediated by sialidase in mouse brain

Affiliations

Acute stress-induced change in polysialic acid levels mediated by sialidase in mouse brain

Chikara Abe et al. Sci Rep. .

Abstract

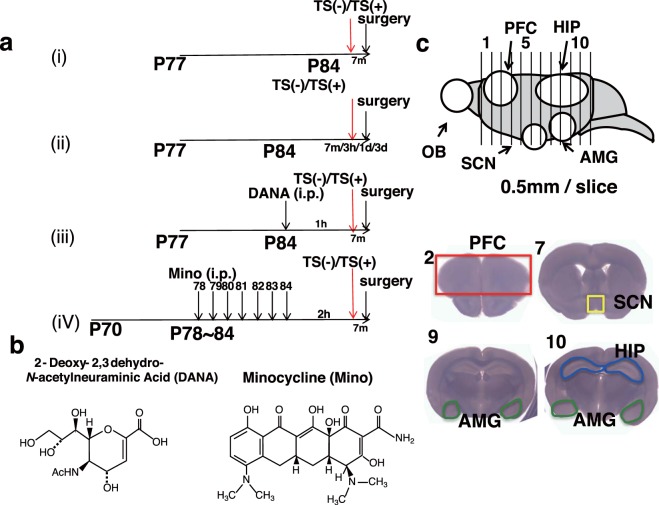
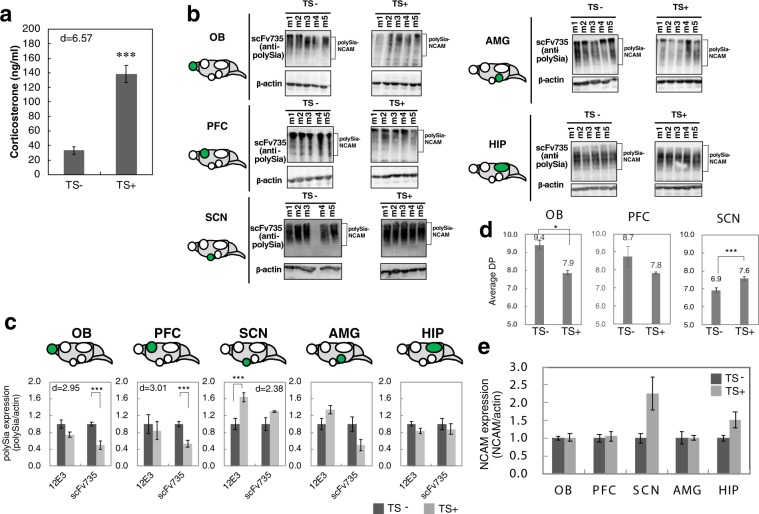
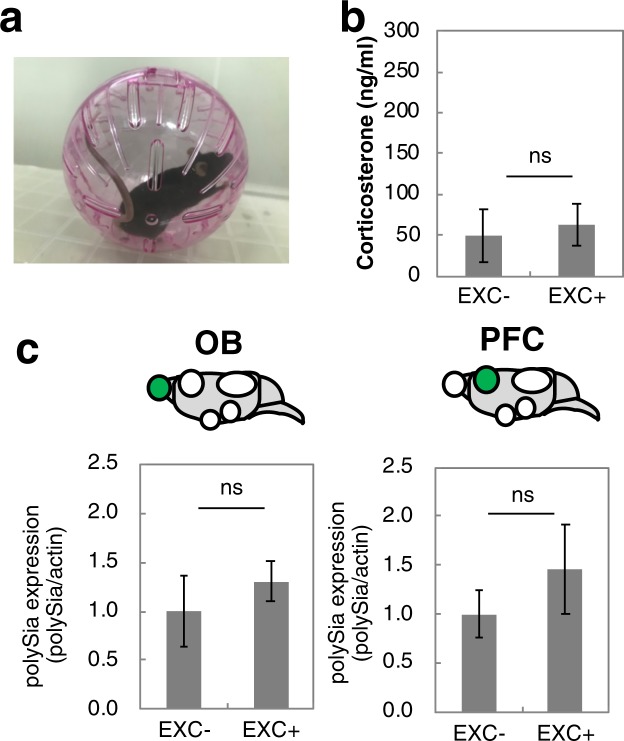
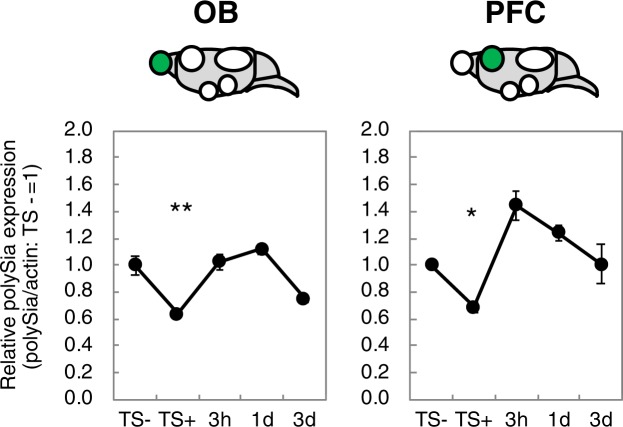
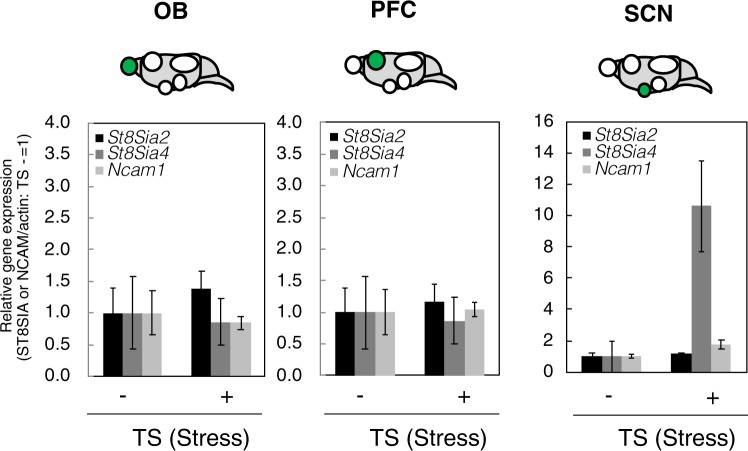
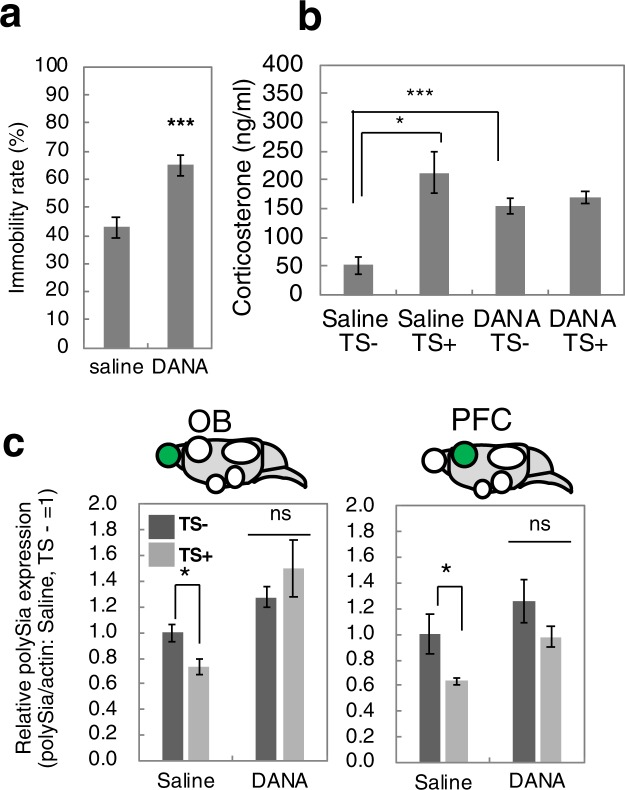
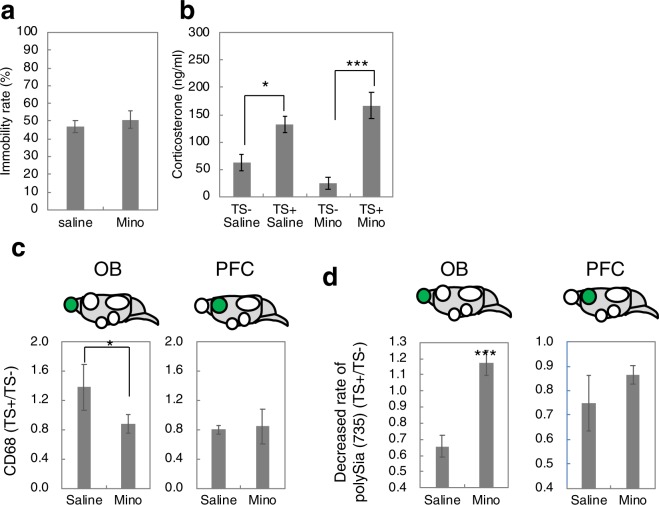
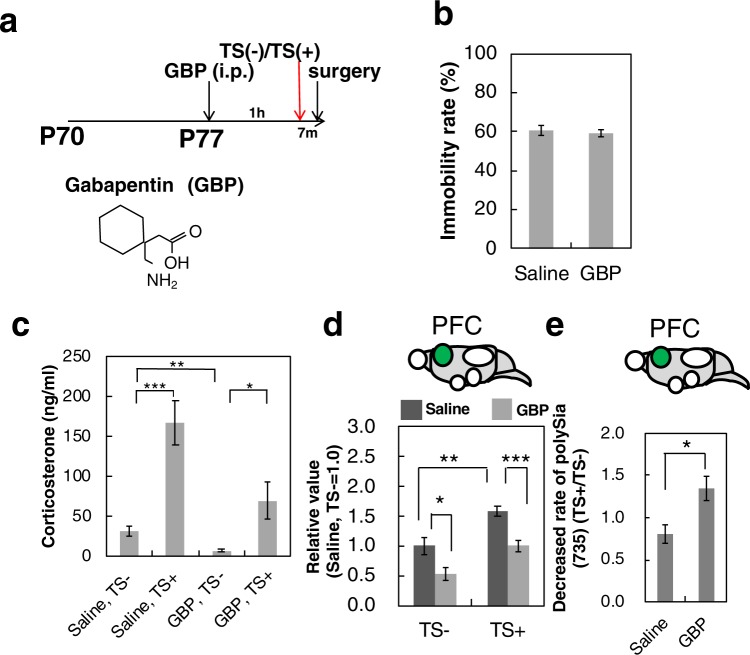
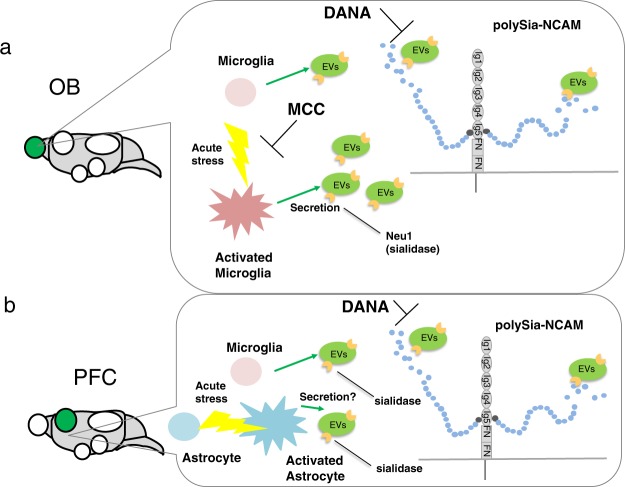
Stress is an important environmental factor influencing human behaviour and causing several mental disorders. Alterations in the structure of polysialic acid (polySia/PSA) due to genetic alterations in ST8SIA2, which encodes a polySia-synthesizing enzyme, are related to certain mental disorders. However, whether stress as an environmental factor leads to changes in polySia structure is unknown. Here we studied the effects of acute stress on polySia expression and found reductions in both the quantity and quality of polySia in the olfactory bulb and prefrontal cortex, even with short-term exposure to acute stress. The use of inhibitors for sialidase, microglia and astrocytes revealed that these declines were due to a transient action of sialidase from microglia and astrocytes in the olfactory bulb and prefrontal cortex, respectively. These data suggest that sialidase dynamically regulates polySia expression in a brain region-specific manner.


Conflict of interest statement

The authors declare no competing interests.

Figures

Figure 1
Figure 1
Experimental schedules. (a) Time schedule of mice experiments. All mice (10 weeks, P77 or P70) used for the experiments were housed over 1 week (P84). Tail suspension (TS) as acute stress for 7 min was performed. Immediately after TS, brains were excised (i). (ii) Time course effect of TS on polySia expression. Mice were sacrificed at 7 min, 3 h, 1 day or 3 days after TS. (iii) Sialidase inhibition analysis. TS was performed on mice at 1 h after saline or sialidase inhibitor (2-deoxy-2,3-dehydro-N-acetylneuraminic acid (DANA) injection. (iv) Microglia inhibition analysis. TS was performed on mice after saline or minocycline (Mino) injection. For inhibition of microglia, Mino injection was given once per day for 7 days and TS was performed 2 hours after final injection. As a control, saline was injected. (b) Chemical structure of DANA and Mino. (c) Strategy of brain sections. Brains were sliced into 0.5 mm/slice except olfactory bulb and 12 sections were prepared (Upper panel). Brain areas in sections used for this experiment are shown and include PFC from section 2, SCN from section 7. AMG from section 9 and 10. HIP from section 10. These areas were separated and used for the experiment.
Figure 2
Figure 2
Effect of TS as an acute stress. (a) Concentrations of corticosterone in serum before and after TS (n = 3 mice; ***p < 0.005; d = 6.57) (b) PolySia expression in the OB, PFC, SCN, AMG, and HIP before and after TS as the acute stress. Homogenates derived from the five brain areas were analyzed using anti-polySia antibody (scFv735) and anti-β-actin antibody (n = 5 mice). For each brain area, the blots for TS− and TS+ were cut out from a larger blot obtained by the same SDS-PAGE/immunoblotting. The each blot was further cut into the upper and lower parts for anti-polySia and anti-actin antibodies, respectively. The original whole blots corresponding to the blots for each brain area are shown in Supplementary Fig. S1b. The square brackets indicate polySia-NCAM. (c) Quantification of polySia. The polySia expression was evaluated by the intensities of anti-polySia antibody and anti-β-actin antibody as shown in (b). Each of the western blottings was repeated 3 times and the error bars show the standard error (SE). TS− was set to 1.0. (n = 5 mice, t-test, ***p < 0.005). (d) Chemical analyses of the change of polySia structure. The amount of α2,8-linked polySia structure was evaluated by fluorometric C7/C9 analyses and the average DP is shown (n = 3 mice, t-test, *p < 0.05, ***p < 0.005). (e) NCAM expression in OB, PFC, SCN, AMG, and HIP before and after TS as acute stress. Homogenates derived from 5 brain areas after Endo-N were analyzed using anti-NCAM antibody and anti-β-actin antibody (n = 5 mice for OB, PFC, AMG, n = 4 mice for HIP, n = 3 mice for SCN). Each of the western blottings was repeated 3 times and the error bars show the SE. The original blots were shown in Supplementary Fig. S1c.
Figure 3
Figure 3
Effect of exercise on polySia expression in mice brains. (a) Photo of rolling bowl used in the exercise experiment. (b) Concentrations of corticosterone in serum before and after the 3-min exercise (EXC) (n = 3 mice). (c) Quantification of polySia. PolySia expression was evaluated by the intensities of anti-polySia antibody and anti-β-actin antibody as shown in Supplementary Fig. S2. Each of the western blottings was repeated 3 times and the error bars show the SE. TS− was set to 1.0. (n = 3 mice). ns indicates no significance.
Figure 4
Figure 4
Time course of acute stress-induced polySia decrease. The time course of acute stress-induced polySia decrease was evaluated by the staining with anti-polySia antibody and anti-β-actin antibody. Each of the western blottings was repeated 3 times and the error bars show the SE. TS− indicates polySia expression before TS. TS+, 3 h, 1 day, and 3 days indicate the polySia expression 7 min, 3 h, 1 day and 3 days after TS treatment, respectively. TS− was set to 1.0. (n = 4 mice, *p < 0.05, **p < 0.01 vs TS−).
Figure 5
Figure 5
Real-time PCR of polySia-related genes before and after acute stress. The amounts of polySia-related genes, St8sia2, St8sia4, and Ncam1 in OB, PFC and SCN were evaluated by real-time PCR. Gene expression of TS− (without acute stress) was set to 1.0. (n = 3 mice, t-test).
Figure 6
Figure 6
Effects of sialidase inhibitor on polySia expression during acute stress. (a) Immobility rate of the TST. Mice injected with saline or sialidase inhibitor DANA were exposed to the TST and the immobility rate was measured. (n = 4 mice, t-test, *p < 0.05) (b) Concentrations of corticosterone in serum. Mice were pretreated with saline or DANA. Then half of the mice were exposed to acute stress (TS+) and the other half were not exposed (TS−). (n = 5 mice, *p < 0.05, ***p < 0.005) (c) Quantification of polySia. PolySia expression in OB and PFC was evaluated by western blotting as shown in Supplementary Fig. S4b. Each of the western blottings was repeated 3 times and the error bars show the SE. Saline/TS− was set to 1.0 (n = 5 mice, t-test, *p < 0.05).
Figure 7
Figure 7
Effects of microglia inhibitor injection on polySia expression during acute stress. (a) Immobility rate of TST. Mice injected with saline or microglia inhibitor, Mino were used for the TST and the immobility rate was measured (n = 5 mice). (b) Concentrations of corticosterone in serum. Mice were pretreated with saline or Mino. Half of the mice were exposed to acute stress (TS+) and the other half were not exposed (TS−) (n = 5 mice, *p < 0.05, ***p < 0.005). (c) Relative ratio of activated microglia as CD68 staining. CD68 staining in the OB and PFC derived from saline treated (Saline) and minocycline-treated mice (Mino) was evaluated before and after acute stress (TS− and TS+) as shown in Supplementary Fig. S5b and relative ratio of activated microglia (TS+/TS−) are shown. (d)The ratio of acute stress-induced polySia decrease. PolySia expression in OB and PFC were evaluated by western blotting as shown in Supplementary Fig. S5c. Each of the western blottings was repeated 3 times and the error bars show the SE.
Figure 8
Figure 8
Effects of astrocyte inhibitor injection on polySia expression during acute stress. (a) Time schedule of mice experiments. Mice (10 weeks, P77) used for the experiments were housed over 1 week (P84). TS as acute stress for 7 min was performed and immediately after TS, brains were excised. TS was performed on mice at 1 h after saline or GBP injection. Lower panel shows the chemical structure of GBP. (b) Immobility rate. Mice injected with saline or GBP were exposed to TST and the immobility rate was measured (n = 5 mice). (c) Concentrations of corticosterone in serum. Mice were pretreated with saline or GBP. Half of the mice were exposed to acute stress (TS+) and the other half were not exposed (TS−) (n = 5 mice, *p < 0.05, ***p < 0.005). (d) Relative ratio of GFAP staining derived from astrocyte as GFAP staining. GFAP staining in PFC derived from saline-treated (Saline) and GBP-treated mice was evaluated before and after acute stress (TS− and TS+) as shown in Fig. S6a and relative ratio of GFAP (TS+/TS−) has been shown. (e) The ratio of acute stress-induced polySia decrease. PolySia expression in PFC were evaluated by western blotting as shown in Fig. S6b. Each of the western blottings was repeated 3 times and the error bars show the SE.
Figure 9
Figure 9
Hypothesized mechanism of acute stress-induced polySia decrease. (a) In the OB, microglia are activated by acute stress. These activated microglia released sialidase probably from exosomes and sialidase cleaves polySia immediately based on the observation that DANA and Mino suppressed the acute stress-induced polySia decrease. (b) In PFC, polySia was cleaved, however, the cleavage was only inhibited by sialidase inhibitor, but not microglia inhibitor, indicating that other cells like activated astrocyte may be involved in this phenomenon.

Similar articles

Cited by

References

    1. Prince M, et al. No health without mental health. Lancet. 2007;370:859–877. doi: 10.1016/S0140-6736(07)61238-0. - DOI - PubMed
    1. Numakawa T, et al. Evidence of novel neuronal functions of dysbindin, a susceptibility gene for schizophrenia. Hum Mol Genet. 2004;13:2699–2708. doi: 10.1093/hmg/ddh280. - DOI - PubMed
    1. Joo E, et al. AKT1 Gene Polymorphisms and Obstetric Complications in the Patients with Schizophrenia. Psychiatry Investig. 2009;6:102–107. doi: 10.4306/pi.2009.6.2.102. - DOI - PMC - PubMed
    1. Nicodemus K, et al. Evidence for statistical epistasis between catechol-O-methyltransferase (COMT) and polymorphisms in RGS4, G72 (DAOA), GRM3, and DISC1: influence on risk of schizophrenia. Hum Genet. 2007;120:889–906. doi: 10.1007/s00439-006-0257-3. - DOI - PubMed
    1. Allen N, et al. Systematic meta-analyses and field synopsis of genetic association studies in schizophrenia: the SzGene database. Nat Genet. 2008;40:827–834. doi: 10.1038/ng.171. - DOI - PubMed

Publication types