. 2019 Jul 9;9(1):9919.
doi: 10.1038/s41598-019-46359-6.

Mitochondrial Akt Signaling Modulated Reprogramming of Somatic Cells

Affiliations

Mitochondrial Akt Signaling Modulated Reprogramming of Somatic Cells

Yu-Han Chen et al. Sci Rep. .

Abstract

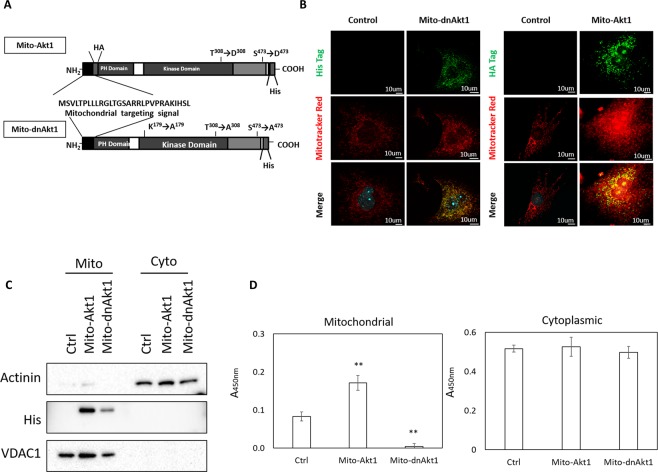
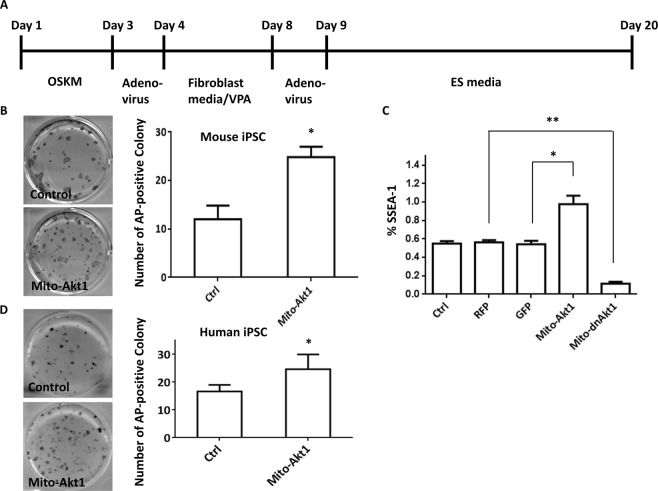
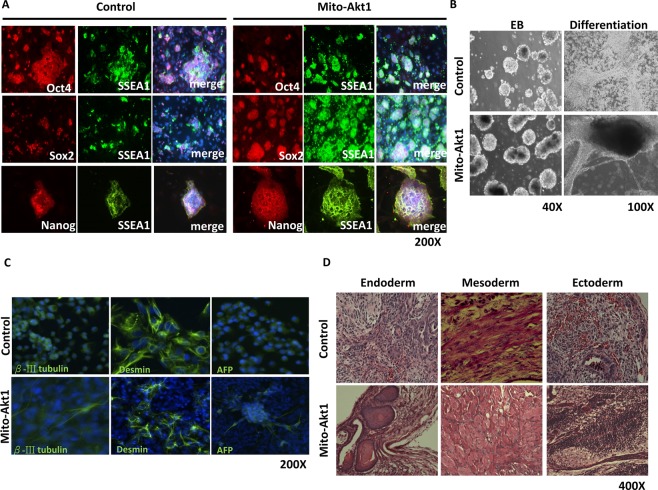
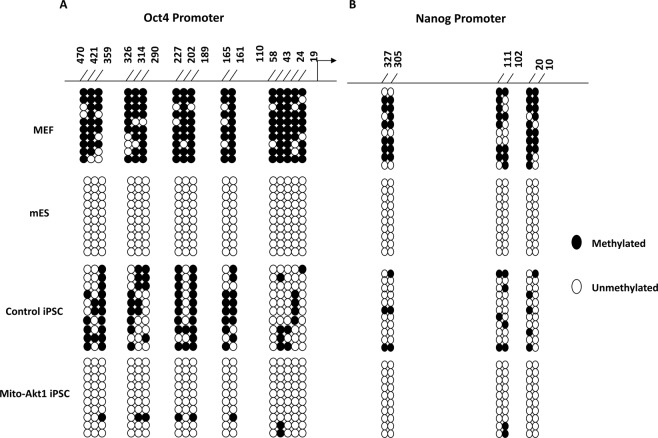
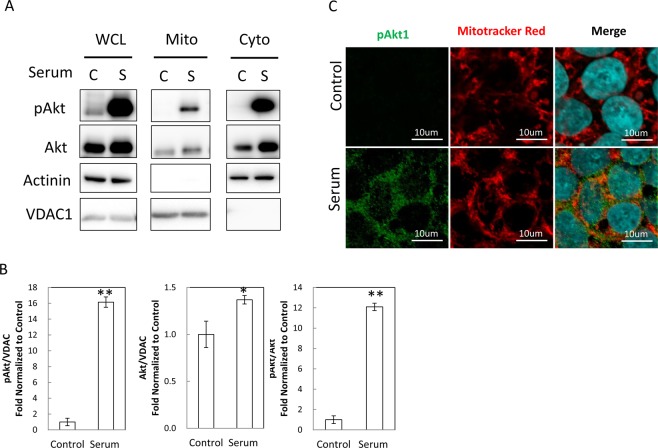
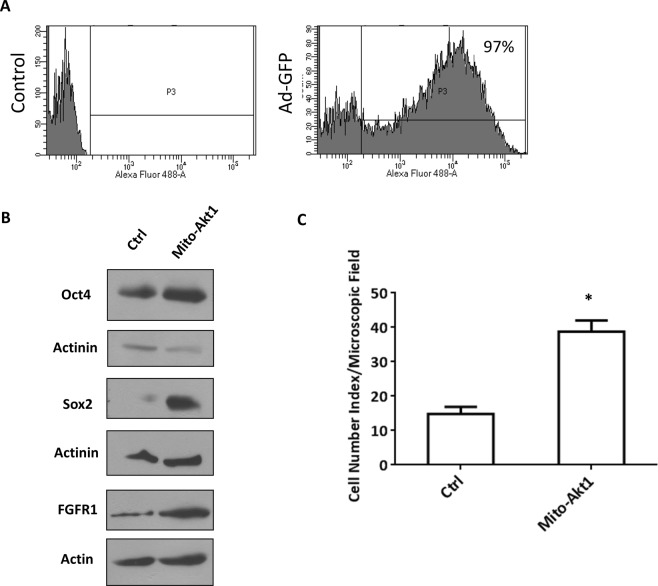
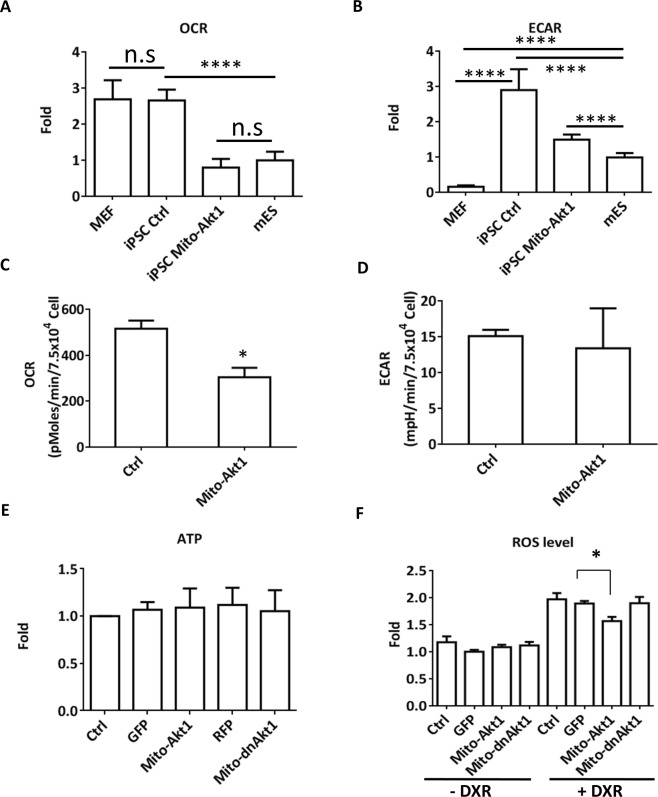
The signaling mechanisms controlling somatic cell reprogramming are not fully understood. In this study, we report a novel role for mitochondrial Akt1 signaling that enhanced somatic cell reprogramming efficiency. The role of mitochondrial Akt1 in somatic cell reprogramming was investigated by transducing fibroblasts with the four reprogramming factors (Oct4, Sox2, Klf4, c-Myc) in conjunction with Mito-Akt1, Mito-dnAkt1, or control virus. Mito-Akt1 enhanced reprogramming efficiency whereas Mito-dnAkt1 inhibited reprogramming. The resulting iPSCs formed embryoid bodies in vitro and teratomas in vivo. Moreover, Oct4 and Nanog promoter methylation was reduced in the iPSCs generated in the presence of Mito-Akt1. Akt1 was activated and translocated into mitochondria after growth factor stimulation in embryonic stem cells (ESCs). To study the effect of mitochondrial Akt in ESCs, a mitochondria-targeting constitutively active Akt1 (Mito-Akt1) was expressed in ESCs. Gene expression profiling showed upregulation of genes that promote stem cell proliferation and survival and down-regulation of genes that promote differentiation. Analysis of cellular respiration indicated similar metabolic profile in the resulting iPSCs and ESCs, suggesting comparable bioenergetics. These findings showed that activation of mitochondrial Akt1 signaling was required during somatic cell reprogramming.


Conflict of interest statement

The authors declare no competing interests.

Figures

Figure 1
Figure 1
Mitochondria-targeting adenoviral vectors. (A) Constructs of adenoviral vectors expressing mitochondria-targeting constitutively active and dominant negative Akt. The constructs were tagged with either HA or His. (B) Mitochondria-targeting was achieved in murine fibroblasts (MEF). The cells were transduced with the control adenovirus, Mito-dnAkt1 or Mito-Akt1 and the protein products of transgene was stained with anti-His tag or anti-HA tag antibodies, and mitochondria stained with Mitotracker Red. Scale bar −10 um. (C) Distribution of mutant Akt in MEF mitochondria and cytoplasmic fractions. MEFs were transduced with adenoviral vectors and harvested 48 hours post transduction. Mitochondria and cytoplasmic fractions were subfractionated as described in the method section. Both Mito-Akt1 and Mito-dnAkt1 were His-tag labelled. Actinin was used as cytoplasmic marker, while VDAC1 was used as mitochondrial marker. The mutant Akts specifically localized to mitochondria. (D) Akt activity assays. Protein lysates from mitochondria (20 ug) and cytoplasmic fractions (60 ug) were used to determine Akt kinase activity assay as described in the Methods section. Bar graph represents the results summarized from 3 independent experiments in duplicates. **p ≤ 0.01.
Figure 2
Figure 2
Mitochondrial Akt1 enhanced reprogramming of murine and human fibroblasts. (A) The scheme of iPSC induction procedure. O: Oct4. S: SOX2. K: Klf4. M: c-Myc. VPA: valporic acid. Detailed reprogramming protocol is described in the Materials and Methods. (B) The number of mouse iPSC colonies was determined by counting the number of alkaline phosphatase-positive colonies on day 20. Photos were taken from a 6 well plate from each group. Representative photo of AP staining is shown here. Bar graph represents the results summarized from 3 independent experiments in triplicates. *p < 0.0001. (C) Reprogramming efficiency analyzed by SSEA1 positive cells. Mito-Akt1 significantly increased the number of cells stained positive for SSEA1, while Mito-dnAkt1 reduced SSEA1 staining to background level. Ctrl: control media. RFP: lenti-RFP virus. GFP: Ad-GFP virus. The percentage of SSEA1-positive cell was determined by flow cytometry on day 21. Bar graph represents the results summarized from 3 independent experiments in triplicates. *p < 0.005, **p < 0.0001. (D) The number of human iPSC colonies was determined by counting the number of alkaline phosphatase-positive colonies in each well on day 20. Representative photo of AP staining is shown here. Bar graph represents the results summarized from 3 independent experiments in triplicates. *p < 0.01.
Figure 3
Figure 3
Characterization of iPSC pluripotency. (A) The iPSCs expressed embryonic stem cell surface markers. iPSC colonies derived from both groups were stained for SSEA1, Sox2, and Nanog. (B) In vitro differentiation assay. iPSCs from both groups were subjected to embryoid body formation. Embryoid bodies were plated onto 6 well plates, various cell types emerged from embryoid bodies. (C) The resulting tissues from EB were subjected to immunostaining with lineage markers of three germ layers. βIII tubulin for ectoderm, Desmin for mesoderm and α-fetoprotein (AFP) for endoderm. Representative pictures were taken at 200X magnification. (D) In vivo differentiation assay. iPSC from both groups injected to SCID mice for teratoma formation. After 6 weeks, teratomas were sectioned and stained with Hematoxylin and Eosin. Representative photos of three germ layers are shown.
Figure 4
Figure 4
Methylation of Oct4 and Nanog promoters in mouse iPSCs. (A) Bisulfite sequencing of the promoter region of Oct4. (B) Bisulfite sequencing of the promoter region of Nanog. Genomic DNA were extracted from MEF, mouse ESC and iPSCs for bisulfite sequencing to determine the methylation status of the CpG islets at Oct4 and Nanog promoters. 10 random colonies from each group were used for this assay.
Figure 5
Figure 5
Akt translocation to mitochondria in human embryonic stem cells. (A) Akt1 was activated and translocated into mitochondria following growth factor stimulation in H9 hESC. H9 cells were serum deprived with E8 basal medium for 8 hours, stimulated with E8 full medium for 10 min, and collected for mitochondria subfractionation. Whole cell lysate (WCL), mitochondria fraction (Mito), and cytosolic fraction (Cyto) were solubilized and resolved with SDS-PAGE for immunoblots with anti-Akt1, anti-pAkt, anti-Actinin, or anti-VDAC1 antibodies. C: Control. S: Serum stimulation. The presence of VDAC indicated mitochondria fraction. (B) Quantitation of pAkt in mitochondria. Western blots from 3–4 independent experiments were analyzed for the content of pAkt, Akt, and pAkt/Akt ratio in hESC in response to growth factor stimulation. The contents of pAkt and Akt were determined by densitometry and normalized with the content of VDAC in each sample. **p < 0.01, *p < 0.05. (C) Mitochondrial translocation of pAkt in H9 cells. H9 cells were serum-deprived for 8 hours and then stimulated with full medium for 10 minutes when indicated. The cells were fixed for immunofluorescence study, pAkt1 were stained with anti-pAkt1 antibodies and mitochondria were stained with Mitotracker Red. Significant proportions of pAkt localized to mitochondria upon serum stimulation. Nuclei were stained with DAPI in blue. Scale bar −10 um.
Figure 6
Figure 6
The effect of mitochondrial Akt in human embryonic stem cells. (A) Transduction efficiency of adenoviral vector in H9 cells. H9 cells were transduced with Ad-GFP (control) for 72 h. After viral transduction, the cells were washed and analyzed with FACS. 97% of cells were positive for GFP expression. (B) Mitochondrial Akt1 enhanced stem cell pluripotency marker expression in hESC. H9 cells were transduced with Mito-Akt1 or Ad-GFP (control) in hES media without bFGF for 72 hours. Protein lysates were resolved with SDS-PAGE and immunoblotted with specific antibodies. The abundance of Oct4, Sox2, and FGFR1 was increased in the cells transduced with Mito-Akt1 (full size western blot image in Supplementary Information), actinin and actin served as loading control. (C) Activation of mitochondrial Akt1 increased cell proliferation in hESC. H9 cells were transduced with Mito-Akt1 or control virus for 65 hours and the cell number per microscopic field was counted in 10 random fields on each plate. The bar graph represents the results from 4 independent experiments in triplicates. *P < 0.01.
Figure 7
Figure 7
Mitochondrial Akt1 modulated cellular respiration. iPSCs at passage 10 were used for these studies. (A) Basal oxygen consumption rate (OCR) in MEF, mESC, and iPSC. (B) Basal extracellular acidification rate (ECAR) in MEF, mESC, and iPSC. (C) The effect of mitochondrial Akt1 activation on OCR. MEFs were transduced with Ad-Mito-Akt1 (Mito-Akt1) or Ad-GFP (control). 72 hours after transduction, the cells were analyzed with a Seahorse XF24 analyzer. Bar graph represents the results summarized from 3 independent experiments in triplicates. *p < 0.005 (D) The effect of mitochondrial Akt1 activation on ECAR in MEF. The cells were transduced with Ad-Mito-Akt1 (Mito-Akt1) or Ad-GFP (control). 72 hours after transduction, cells were studied with a Seahorse XF24 analyzer. (E) Cellular ATP contents in MEF. ATP level was quantified by mass spectrometry. (F) The effect of Mito-Akt1 on oxidative stress in MEF. Mitochondrial ROS was analyzed with MitoSOX Red and quantified by flow cytometry. Bar graph represents the results summarized from 3 independent experiments in triplicates. *p < 0.005. DXR: Stress induction with doxorubicin.

References

    1. Mason C, Dunnill P. A brief definition of regenerative medicine. Regenerative Medicine. 2008;3:1–5. doi: 10.2217/17460751.3.1.1. - DOI - PubMed
    1. Jin Z, Esther N, George D. Metabolic Regulation in Pluripotent Stem Cells during Reprogramming and Self-Renewal. Cell stem cell. 2012;11:589–595. doi: 10.1016/j.stem.2012.10.005. - DOI - PMC - PubMed
    1. Burgess RJ, Agathocleous M, Morrison SJ. Metabolic regulation of stem cell function. J. Intern Med. 2014;276:12–24. doi: 10.1111/joim.12247. - DOI - PMC - PubMed
    1. Chandrasekaran S, et al. Comprehensive Mapping of Pluripotent Stem Cell Metabolism Using Dynamic Genome-Scale Network Modeling. Cell Rep. 2017;21:2965–2977. doi: 10.1016/j.celrep.2017.07.048. - DOI - PMC - PubMed
    1. Zhang J, et al. Metabolism in Pluripotent Stem Cells and Early Mammalian Development. Cell Metab. 2018;27:332–338. doi: 10.1016/j.cmet.2018.01.008. - DOI - PubMed

Publication types