

Patterns of protist diversity associated with raw sewage in New York City
- PMID: 31289345
- PMCID: PMC6794324
- DOI: 10.1038/s41396-019-0467-z
Patterns of protist diversity associated with raw sewage in New York City
Abstract
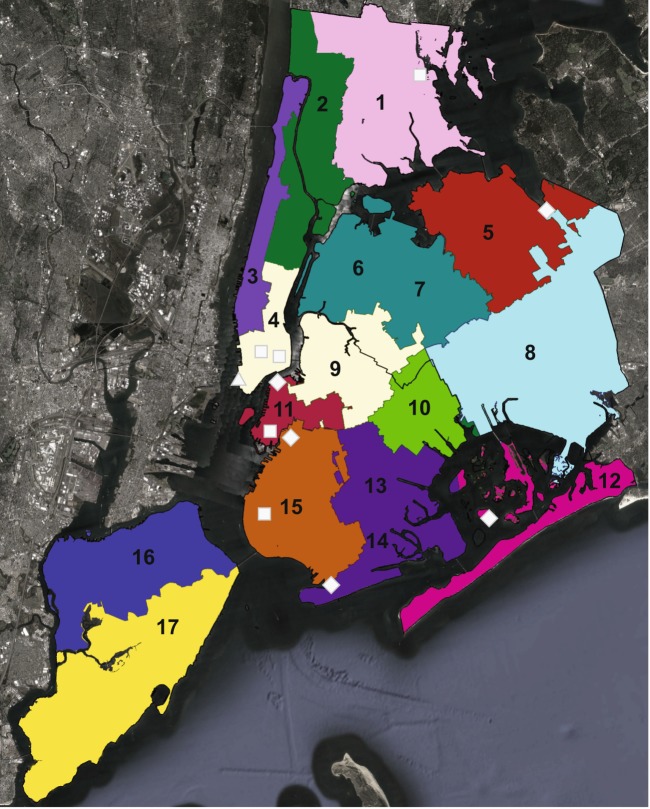
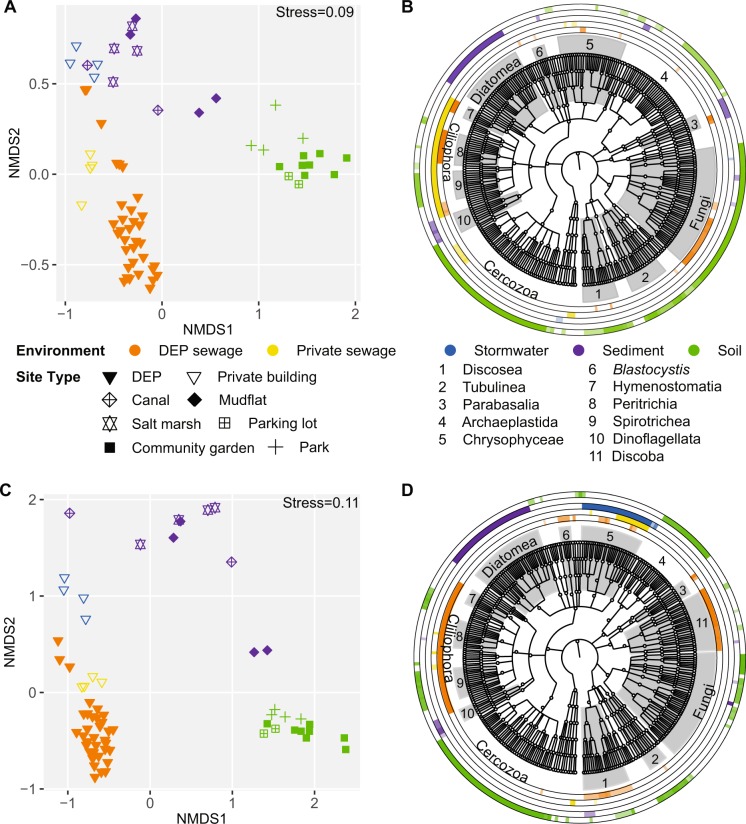
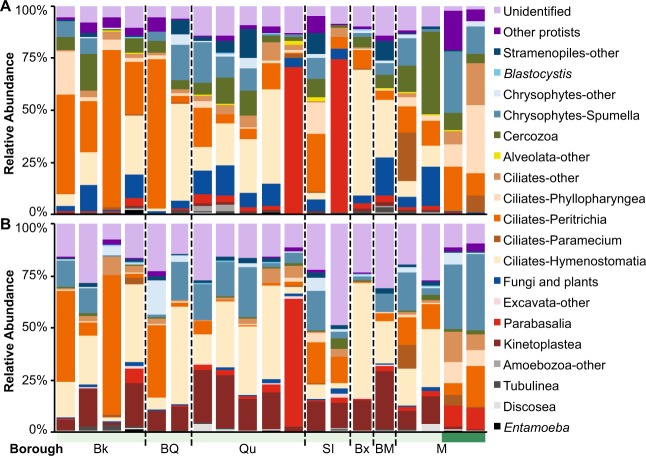
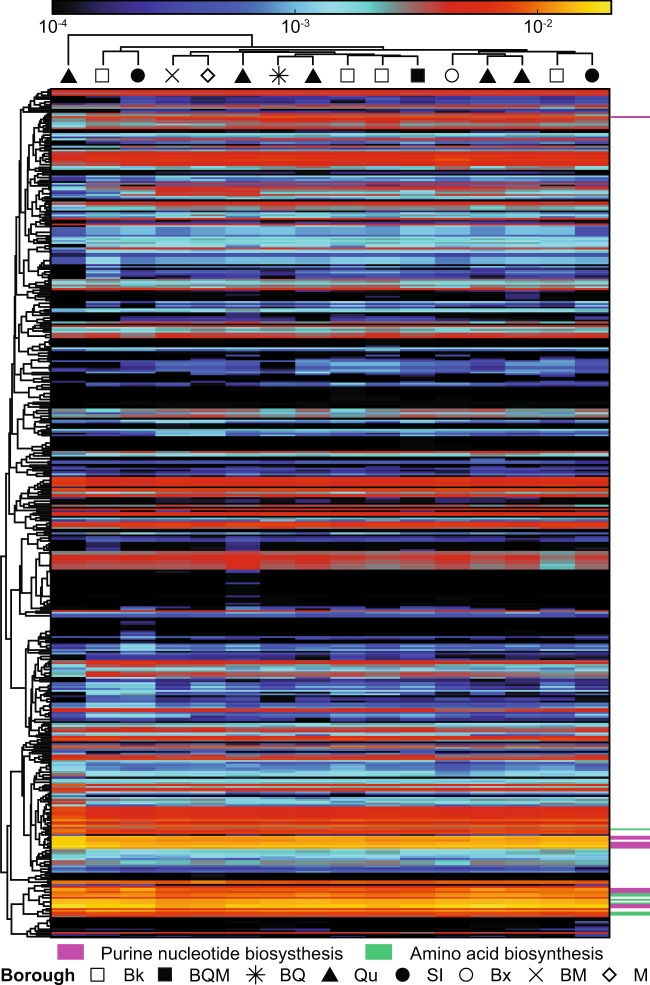
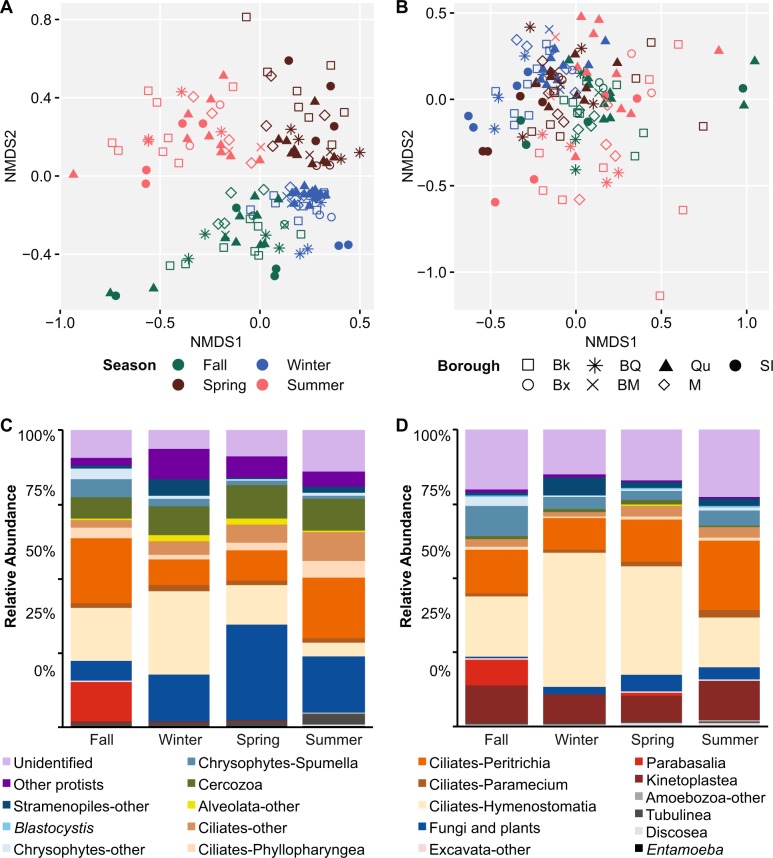
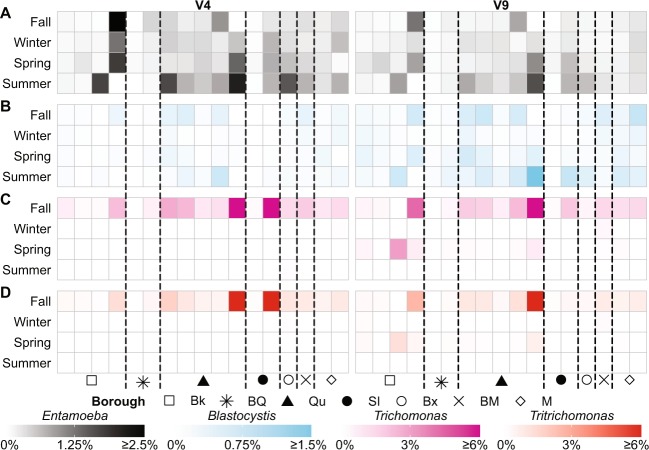
Protists are ubiquitous components of terrestrial and aquatic environments, as well as animal and human microbiomes. Despite this, little is known about protists in urban environments. The ~7400-mile sewer system of New York City (NYC) collects human waste from ~8 million human inhabitants as well as from animals, street runoff, and groundwater, providing an ideal system to study these microbes. We used 18S rRNA amplicon sequencing and shotgun metagenomic sequencing to profile raw sewage microbial communities. Raw sewage samples were collected over a 12-month period from 14 treatment plants of the five NYC boroughs, and compared with samples from other environments including soil, stormwater, and sediment. Sewage contained a diverse protist community dominated by free-living clades, and communities were highly differentiated across environments. Seasonal differences in protist composition were observed; however, network analysis and functional profiling demonstrated that sewage communities were robust and functionally consistent. Protists typically associated with human and animal guts or feces were frequently detected. Abundance of these parasites varied significantly both spatially and temporally, suggesting that spikes could reflect trends in the source population. This underscores sewage as a valuable model system for monitoring patterns in urban microbes and provides a baseline protist metagenome of NYC.
Conflict of interest statement
JMM is now an employee of Merck Research Laboratories. TAT is now an employee of Agilent Technologies.
Figures
Similar articles
-
An 18S rRNA Workflow for Characterizing Protists in Sewage, with a Focus on Zoonotic Trichomonads.Microb Ecol. 2017 Nov;74(4):923-936. doi: 10.1007/s00248-017-0996-9. Epub 2017 May 24. Microb Ecol. 2017. PMID: 28540488 Free PMC article.
-
Measurements of soil protist richness and community composition are influenced by primer pair, annealing temperature, and bioinformatics choices.Appl Environ Microbiol. 2024 Jul 24;90(7):e0080024. doi: 10.1128/aem.00800-24. Epub 2024 Jun 26. Appl Environ Microbiol. 2024. PMID: 38920364 Free PMC article.
-
Longitudinal Comparison of Bacterial Diversity and Antibiotic Resistance Genes in New York City Sewage.mSystems. 2019 Aug 6;4(4):e00327-19. doi: 10.1128/mSystems.00327-19. mSystems. 2019. PMID: 31387933 Free PMC article.
-
Protist metabarcoding and environmental biomonitoring: Time for change.Eur J Protistol. 2016 Aug;55(Pt A):12-25. doi: 10.1016/j.ejop.2016.02.003. Epub 2016 Feb 22. Eur J Protistol. 2016. PMID: 27004417 Review.
-
The unexpected habitat in sewer pipes for the propagation of microbial communities and their imprint on urban waters.Curr Opin Biotechnol. 2019 Jun;57:34-41. doi: 10.1016/j.copbio.2018.12.010. Epub 2019 Jan 22. Curr Opin Biotechnol. 2019. PMID: 30682717 Free PMC article. Review.
Cited by
-
MicrobiomeCensus estimates human population sizes from wastewater samples based on inter-individual variability in gut microbiomes.PLoS Comput Biol. 2022 Sep 23;18(9):e1010472. doi: 10.1371/journal.pcbi.1010472. eCollection 2022 Sep. PLoS Comput Biol. 2022. PMID: 36149894 Free PMC article.
-
Does filter pore size introduce bias in DNA sequence-based plankton community studies?Front Microbiol. 2022 Sep 26;13:969799. doi: 10.3389/fmicb.2022.969799. eCollection 2022. Front Microbiol. 2022. PMID: 36225356 Free PMC article.
-
Cross-Cutting Approach for the Characterization of Microbial Emerging Hazards in Agriculture Settings from Circular Economy-Driven Wastewater Streams.Environ Health (Wash). 2023 Dec 21;2(2):68-75. doi: 10.1021/envhealth.3c00070. eCollection 2024 Feb 16. Environ Health (Wash). 2023. PMID: 39474102 Free PMC article. Review.
-
Molecular Prevalence and Subtypes Distribution of Blastocystis spp. in Humans of Latin America: A Systematic Review.Trop Med Infect Dis. 2024 Feb 1;9(2):38. doi: 10.3390/tropicalmed9020038. Trop Med Infect Dis. 2024. PMID: 38393127 Free PMC article. Review.
-
Unravelling the temporal dynamics of community functions in protists induced by treated wastewater exposure using metatranscriptomics.Sci Rep. 2025 Jul 4;15(1):23957. doi: 10.1038/s41598-025-10083-1. Sci Rep. 2025. PMID: 40615598 Free PMC article.
