

NLRC3 expression in dendritic cells attenuates CD4+ T cell response and autoimmunity
- PMID: 31290162
- PMCID: PMC6694220
- DOI: 10.15252/embj.2018101397
NLRC3 expression in dendritic cells attenuates CD4+ T cell response and autoimmunity
Abstract
NOD-like receptor (NLR) family CARD domain containing 3 (NLRC3), an intracellular member of NLR family, is a negative regulator of inflammatory signaling pathways in innate and adaptive immune cells. Previous reports have shown that NLRC3 is expressed in dendritic cells (DCs). However, the role of NLRC3 in DC activation and immunogenicity is unclear. In the present study, we find that NLRC3 attenuates the antigen-presenting function of DCs and their ability to activate and polarize CD4+ T cells into Th1 and Th17 subsets. Loss of NLRC3 promotes pathogenic Th1 and Th17 responses and enhanced experimental autoimmune encephalomyelitis (EAE) development. NLRC3 negatively regulates the antigen-presenting function of DCs via p38 signaling pathway. Vaccination with NLRC3-overexpressed DCs reduces EAE progression. Our findings support that NLRC3 serves as a potential target for treating adaptive immune responses driving multiple sclerosis and other autoimmune disorders.
Keywords: NLRC3; autoimmunity; dendritic cells; p38; vaccination.
© 2019 The Authors.
Conflict of interest statement
The authors declare that they have no conflict of interest.
Figures

- A
Representative flow cytometry data showing surface phenotypes of DCs sorted from spleens of wild‐type (WT) or Nlrc3 −/− mice and treated with LPS (100 ng/ml) for 48 h.
- B
ELISA of cytokines in culture supernatants of DCs treated as in (A).
- C–F
The intracellular production of IFN‐γ and IL‐17 by CD4+ T cells (C), cytokines in culture supernatants (D), thymidine incorporation proliferation assay (E), and CFSE proliferation assay (F) among naive 2D2 CD4+ T cells stimulated with MOG(35–55) plus DCs treated as in (A).

Mean clinical scores of EAE in immunized WT (n = 10) and Nlrc3 −/− mice (n = 10).
Representative flow cytometry data showing intracellular production of IFN‐γ and IL‐17A by CD4+ T cells from the spinal cord and brain of WT or Nlrc3 −/− mice 26 days after EAE induction after restimulation with MOG(35–55) peptide. Pooled data are presented in the right panel.
Representative flow cytometry data showing surface phenotypes of DCs from spleens of WT or Nlrc3 −/− mice 26 days after EAE induction.
Expression of Nlrc3, Il12, Il6, Il23, and Il27 mRNA in DCs sorted from WT and Nlrc3 −/− mice 26 days after EAE induction, presented relative to that of Gapdh.

- A
Mean clinical scores of EAE in immunized DC(WT) (n = 5) and DC(NLRC3‐KO) mice (n = 5).
- B
Representative flow cytometry data showing intracellular production of IFN‐γ and IL‐17A by CD4+ T cells in the spinal cord and brain from DC(WT) and DC(NLRC3‐KO) mice 26 days after EAE induction after restimulation with MOG(35–55) peptide.
- C
Recall response to MOG(35–55) by splenocytes isolated from DC(WT) and DC(NLRC3‐KO) mice 26 days after EAE induction.
- D
Expression of Il12, Il6, Il23, and Il27 mRNA in DCs sorted from DC(WT) and DC(NLRC3‐KO) mice 26 days after EAE induction, presented relative to that of Gapdh.
- E, F
CFSE proliferation assay (E) and cytokine secretion (F) of naive 2D2 CD4+ T cells stimulated with MOG(35–55) plus DCs sorted from DC(WT) and DC(NLRC3‐KO) mice 26 days after EAE induction.
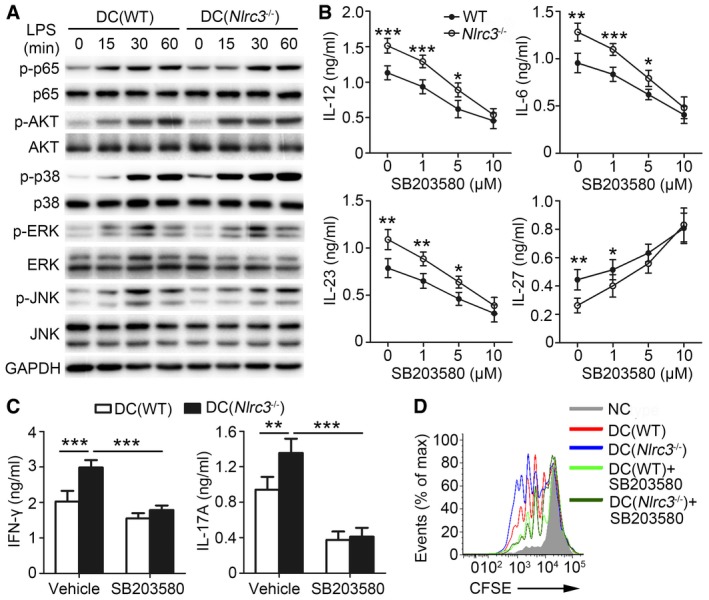
- A
Purified DCs were treated with LPS (100 ng/ml) for specified time. DC lysates were probed for phosphorylated p65 (p‐p65), total p65, p‐AKT, AKT, p‐p38, p38, p‐ERK, ERK, p‐JNK, JNK, and GAPDH.
- B–D
Purified DCs were treated for 48 h with LPS (100 ng/ml) in the presence or absence of the p38 inhibitor SB203580 (10 μM or indicated concentrations). (B) Concentrations of IL‐12, IL‐6, IL‐23, and IL‐27 in supernatants were detected by ELISA. Cytokines in culture supernatants (C) and CFSE proliferation assay (D) among naive 2D2 CD4+ T cells stimulated with MOG(35–55) plus DCs. NC: negative control.

- A
Activity phosphorylation of p38 was detected in DCs in the spleens from DC(WT) and DC(NLRC3‐KO) mice 26 days after EAE induction. Pooled data are presented in the right panel.
- B–D
DC(p38‐KO) and DC(p38 + NLRC3‐KO) mice were immunized with MOG(35–55) peptide in CFA adjuvant and pertussis toxin to induce EAE. (B) Mean clinical scores of EAE in immunized DC(WT) (n = 5) and DC(NLRC3‐KO) mice (n = 5). (C) Frequencies of CD4+ T cells that express IFN‐γ and IL‐17A in the spinal cord and brain from DC(WT) and DC(NLRC3‐KO) mice 26 days after EAE induction after restimulation with MOG(35–55) peptide. Pooled data are presented in the right panel. (D) Expression of Il12, Il6, and Il23 mRNA in DCs sorted from spleens of DC(WT), DC(NLRC3‐KO), DC(p38‐KO), and DC(p38 + NLRC3‐KO) mice 26 days after EAE induction, presented relative to that of Gapdh.

- A
DC lysates were probed for p‐p38, p38, NLRC3, and GAPDH. Densitometry quantification of band intensity was presented in the right panel.
- B
Enzyme‐linked immunosorbent assay of cytokines in culture supernatants of DCs treated with LPS for 48 h.
- C, D
Cytokines in culture supernatants (C) and CFSE proliferation assay (D) among naive 2D2 CD4+ T cells stimulated with MOG(35–55) plus DCs treated with LPS for 48 h.

- A
Mean clinical scores of EAE (n = 5 mice per group). Arrows indicate DC vaccine administration.
- B
Effects of therapeutic DC vaccination on B6 EAE. The maximum score: Mean of the maximum scores per mouse in each group. Data shown are the mean ± SD. Determination of statistical differences was performed using by a one‐way ANOVA test.
- C, D
Recall proliferative (C) and cytokine response (D) to MOG(35–55) in splenocytes taken from DCs‐treated mice 26 days after EAE induction.
References
-
- Conti BJ, Davis BK, Zhang J, O'Connor W Jr, Williams KL, Ting JP (2005) CATERPILLER 16.2 (CLR16.2), a novel NBD/LRR family member that negatively regulates T cell function. J Biol Chem 280: 18375–18385 - PubMed
-
- Cooney R, Baker J, Brain O, Danis B, Pichulik T, Allan P, Ferguson DJ, Campbell BJ, Jewell D, Simmons A (2010) NOD2 stimulation induces autophagy in dendritic cells influencing bacterial handling and antigen presentation. Nat Med 16: 90–97 - PubMed
Publication types
MeSH terms
Substances
Grants and funding
- A2017073/Medical Scientific Research Foundation of Guangdong Province/International
- 17ykpy33/Fundamental Research Funds for the Central Universities/International
- 81602691/National Natural Science Foundation of China/International
- 81602416/National Natural Science Foundation of China/International
- 2017A030310268/Guangdong Natural Science Foundation/International
LinkOut - more resources
Full Text Sources
Molecular Biology Databases
Research Materials
