. 2019 Sep 20;38(21):4146-4158.
doi: 10.1002/sim.8290. Epub 2019 Jul 9.

Estimation and prediction for a mechanistic model of measles transmission using particle filtering and maximum likelihood estimation

Affiliations

Estimation and prediction for a mechanistic model of measles transmission using particle filtering and maximum likelihood estimation

Kirsten E Eilertson et al. Stat Med. .

Abstract

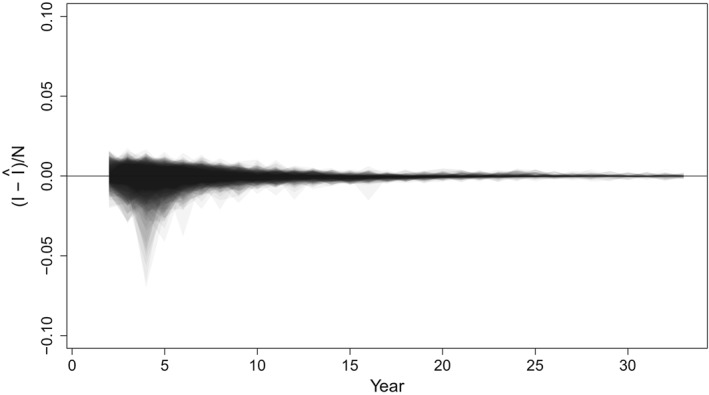
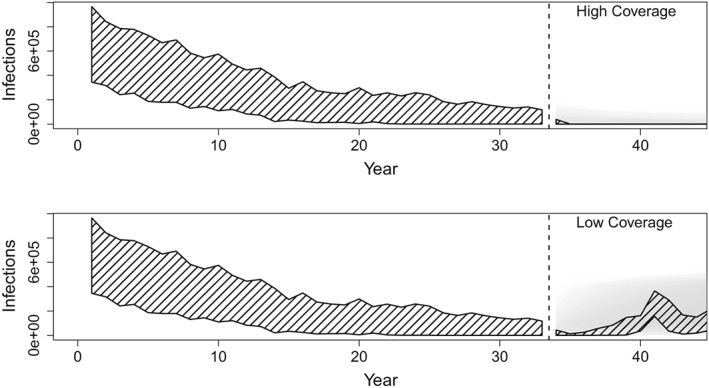
Disease incidence reported directly within health systems frequently reflects a partial observation relative to the true incidence in the population. State-space models present a general framework for inferring both the dynamics of infectious disease processes and the unobserved burden of disease in the population. Here, we present a state-space model of measles transmission and vaccine-based interventions at the country-level and a particle filter-based estimation procedure. Our dynamic transmission model builds on previous work by incorporating population age-structure to allow explicit representation of age-targeted vaccine interventions. We illustrate the performance of estimators of model parameters and predictions of unobserved states on simulated data from two dynamic models: one on the annual time-scale of observations and one on the biweekly time-scale of the epidemiological dynamics. We show that our model results in approximately unbiased estimates of unobserved burden and the underreporting rate. We further illustrate the performance of the fitted model for prediction of future disease burden in the next one to 15 years.

Keywords: measles; particle filter; stochastic model; time series; under-reporting.


Conflict of interest statement

We report no conflicts of interest.

Figures

Figure 1
Figure 1
An example curve that illustrates the attack rate function for the annual model. The points illustrate the attack rate variation, σe2
Figure 2
Figure 2
Coverage of nominal 95% intervals for the states generated from the filtering density as a function of the level of attack rate variation, σ e, used in the simulation. Vertical black lines indicate the level of σ e used to simulate the observed data
Figure 3
Figure 3
Left: The range of phenomenological annual attack rate functions used in the simulation experiment. Each line represents a sampled parameter set of β 0 and β 1 used to generate a data set. Red lines indicate two examples in the range of possible variation. Right: Time series of unobserved incidence cases over time from each of our 100 parameter combinations. The trends in red correspond to two highlighted attack rate curves highlighted in the figure on the left [Colour figure can be viewed at wileyonlinelibrary.com]
Figure 4
Figure 4
Estimates of parameter values from 100 simulated data sets from the annual model as a function of the true value used to simulate the data. A, The intercept of the attack rate function β 0; B, The slope of the attack rate function β 1; C, The reporting rate p r. The gray bars indicate the 95% CI based on the parametric bootstrap generated sampling distributions
Figure 5
Figure 5
Estimates of the reporting rate, p r from 100 simulated data sets from the Susceptible‐Infected‐Recovered model as a function of the true value used to simulate the data. The gray bars indicate the 95% CI based on the parametric bootstrap generated sampling distributions
Figure 6
Figure 6
Normalized prediction intervals over 33 years of data from 100 simulations from the annual model simulated data sets. The y‐axis reflects the true incidence, minus the predicted incidence, as a fraction of population size to remove trends in individual time series. Shaded regions including the zero line indicate that the prediction interval captures the true value
Figure 7
Figure 7
Normalized prediction intervals over 33 years of data from 100 simulations from the SIR model simulated data sets. The y‐axis reflects the true incidence, minus the predicted incidence, as a fraction of population size to remove trends in individual time series. Shaded regions including the zero line indicate that the prediction interval captures the true value
Figure 8
Figure 8
Infections, which are the total number of measles cases, are shown across years. Forward predictions of the unobserved number of infections from fitted model for the optimistic (top) and pessimistic (bottom) future vaccination scenarios. Hatched shading illustrates the central 95% of simulated incidence for 33 years of observed data (left of dashed line) and 15 years of future simulation (right of dashed line) from 100 simulations. Gray shading illustrates the central 95% of the prediction interval for 15 years of forward prediction for each of the 100 fitted models. Darker shading indicates higher density of predicted incidence

References

    1. Simons E, Ferrari M, Fricks J, et al. Assessment of the 2010 global measles mortality reduction goal: results from a model of surveillance data. The Lancet. 2012;379(9832):2173‐2178. 10.1016/S0140-6736(12)60522-4 - DOI - PubMed
    1. Ozawa S, Clark S, Portnoy A, et al. Estimated economic impact of vaccinations in 73 low‐ and middle‐income countries, 2001‐2020. Bull World Health Organ. 2017;95(9):629‐638. 10.2471/BLT.16.178475 - DOI - PMC - PubMed
    1. Grenfell BT, Anderson RM. The estimation of age‐related rates of infection from case notifications and serological data. Epidemiol Infect. 1985;95(2):419‐436. 10.1017/S0022172400062859 - DOI - PMC - PubMed
    1. Dabbagh A, Patel MK, Dumolard L, et al. Progress toward regional measles elimination—worldwide, 2000‐2016. MMWR Morb Mortal Wkly Rep. 2017;66(42):1148‐1153. 10.15585/mmwr.mm6642a6 - DOI - PMC - PubMed
    1. Chen S, Fricks J, Ferrari MJ. Tracking measles infection through non‐linear state space models. J R Stat Soc Ser C Appl Stat. 2012;61(1):117‐134. 10.1111/j.1467-9876.2011.01001.x - DOI

Publication types

LinkOut - more resources