. 2019 Oct;21(10):e13084.
doi: 10.1111/cmi.13084. Epub 2019 Jul 17.

Toxoplasma gondii induces prolonged host epidermal growth factor receptor signalling to prevent parasite elimination by autophagy: Perspectives for in vivo control of the parasite

Affiliations

Toxoplasma gondii induces prolonged host epidermal growth factor receptor signalling to prevent parasite elimination by autophagy: Perspectives for in vivo control of the parasite

Yalitza Lopez Corcino et al. Cell Microbiol. 2019 Oct.

Abstract

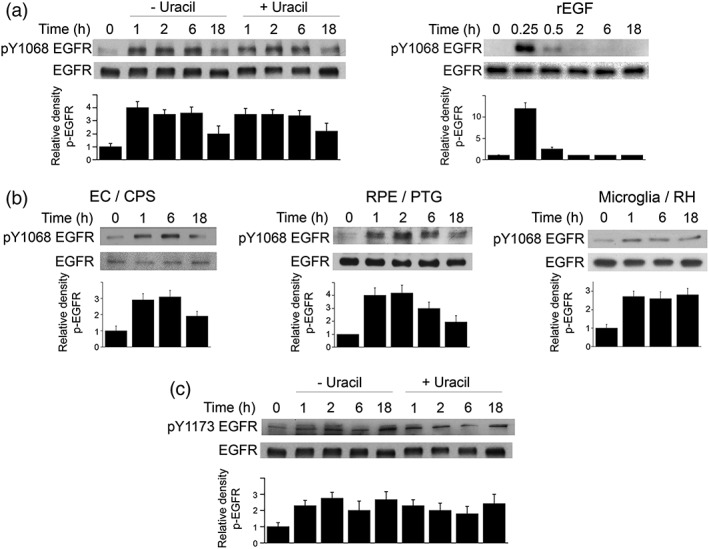
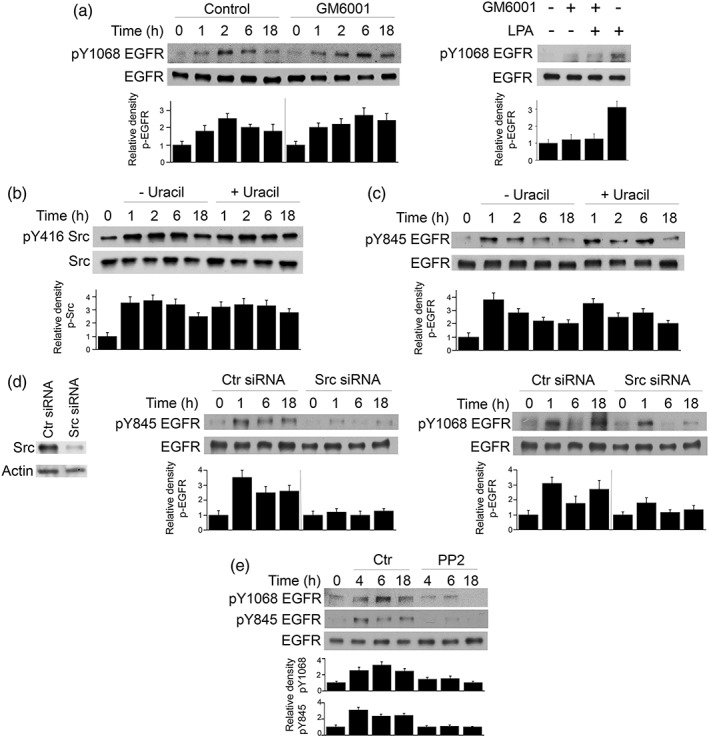
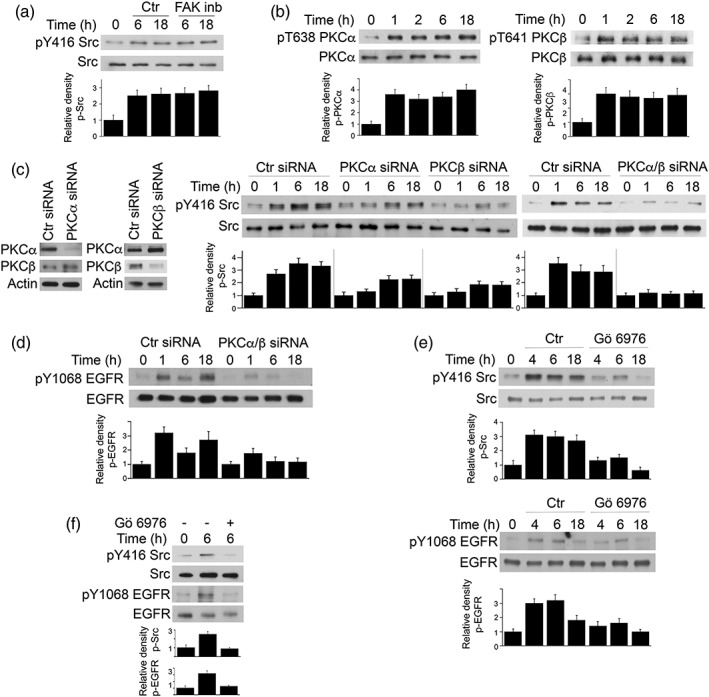
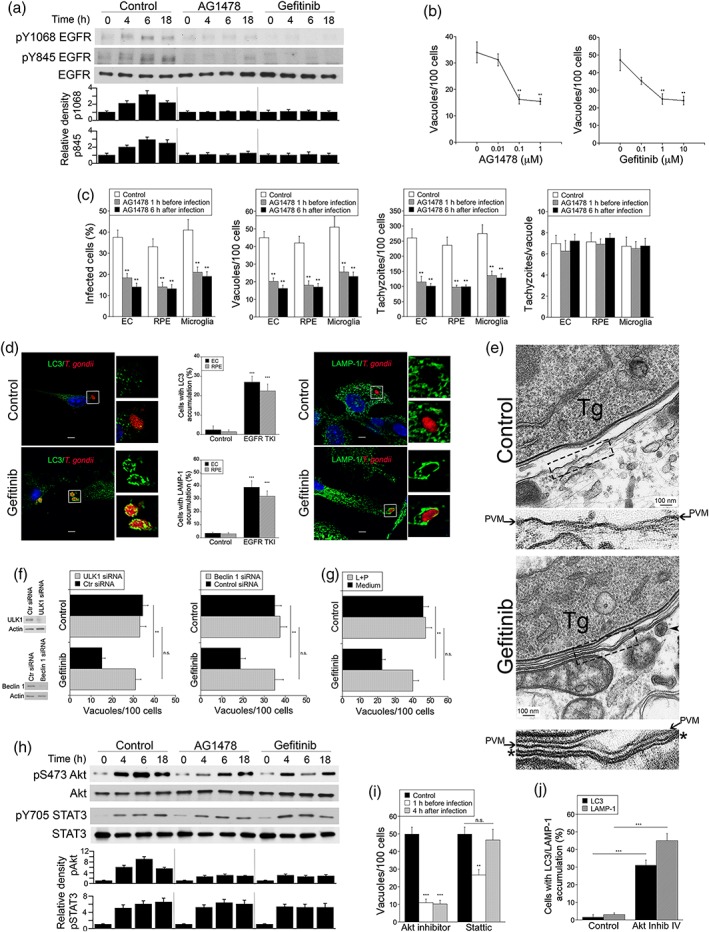
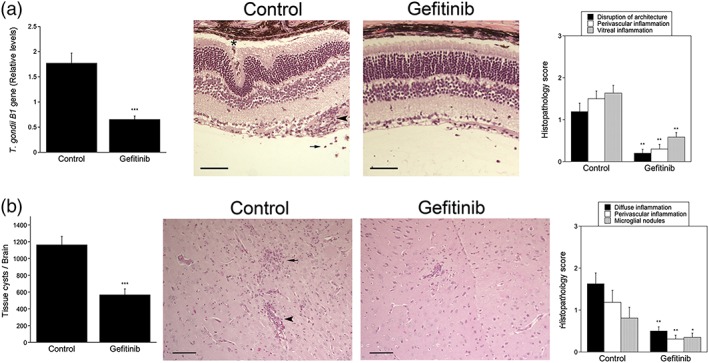
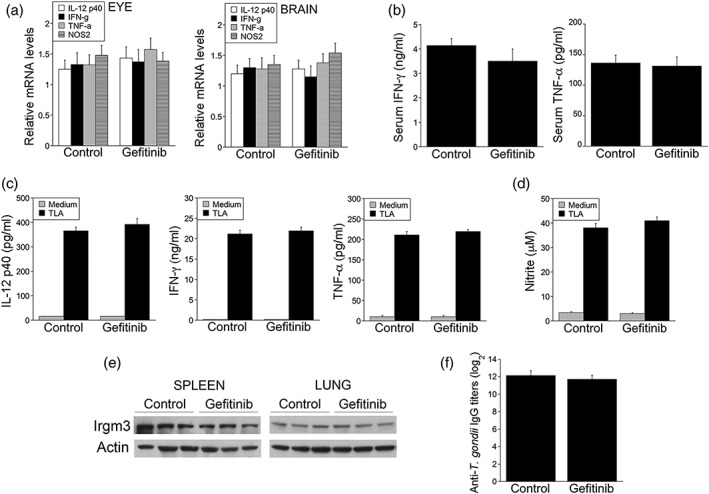
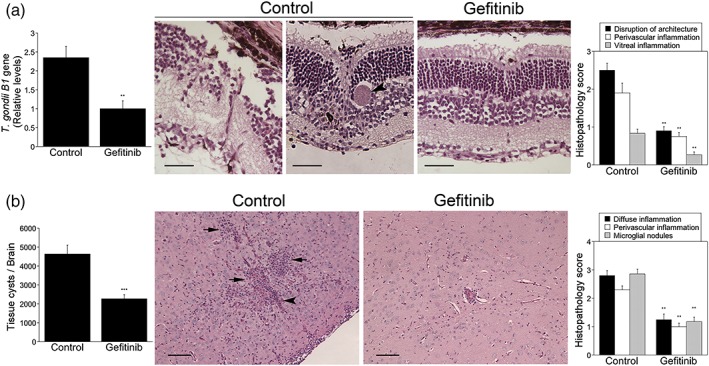
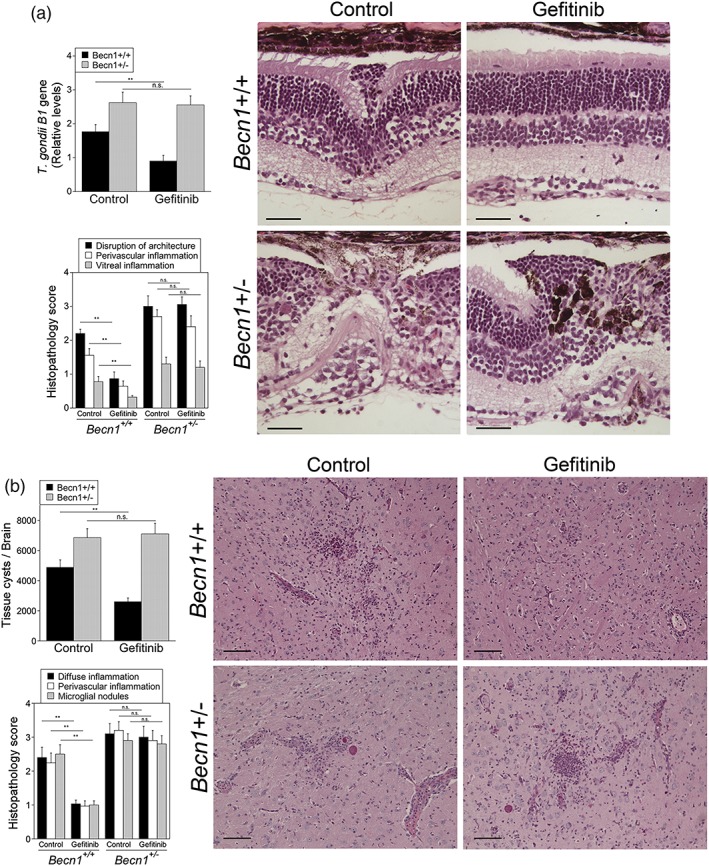
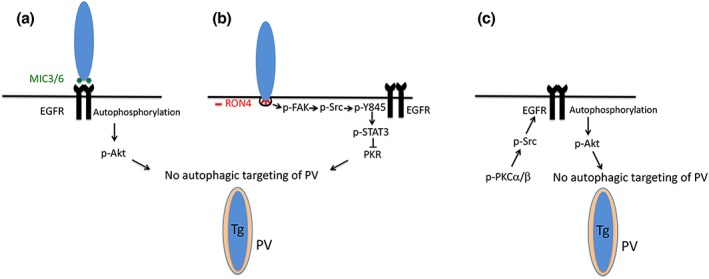
Toxoplasma gondii causes retinitis and encephalitis. Avoiding targeting by autophagosomes is key for its survival because T. gondii cannot withstand lysosomal degradation. During invasion of host cells, T. gondii triggers epidermal growth factor receptor (EGFR) signalling enabling the parasite to avoid initial autophagic targeting. However, autophagy is a constitutive process indicating that the parasite may also use a strategy operative beyond invasion to maintain blockade of autophagic targeting. Finding that such a strategy exists would be important because it could lead to inhibition of host cell signalling as a novel approach to kill the parasite in previously infected cells and treat toxoplasmosis. We report that T. gondii induced prolonged EGFR autophosphorylation. This effect was mediated by PKCα/PKCβ ➔ Src because T. gondii caused prolonged activation of these molecules and their knockdown or incubation with inhibitors of PKCα/PKCβ or Src after host cell invasion impaired sustained EGFR autophosphorylation. Addition of EGFR tyrosine kinase inhibitor (TKI) to previously infected cells led to parasite entrapment by LC3 and LAMP-1 and pathogen killing dependent on the autophagy proteins ULK1 and Beclin 1 as well as lysosomal enzymes. Administration of gefitinib (EGFR TKI) to mice with ocular and cerebral toxoplasmosis resulted in disease control that was dependent on Beclin 1. Thus, T. gondii promotes its survival through sustained EGFR signalling driven by PKCα/β ➔ Src, and inhibition of EGFR controls pre-established toxoplasmosis.

Keywords: infection; microbial-cell interaction; protozoa.


Conflict of interest statement

The authors declare no conflicts of interest.

Figures

Figure 1
Figure 1
Toxoplasma gondii induces prolonged EGFR autophosphorylation in mammalian cells. (a) Human retinal pigment epithelial (RPE) cells were challenged with tachyzoites of the cps strain of T. gondii and cultured in the absence or presence of uracil. RPE cells were also incubated with recombinant human EGF. Cell lysates were obtained at the indicated time points and used to probe for total EGFR and phospho‐Y1068 EGFR. Relative density of phospho‐EGFR signal was obtained by normalisation to total EGFR signal followed by normalisation relative to the uninfected control samples (0‐min time point). Relative density of phospho‐EGFR for uninfected samples was given a value of 1. (b) Mouse endothelial cells (mHEVc), RPE cells, and microglia (BV‐2) were challenged with tachyzoites of cps, PTG (type II strain), or RH (type I strain) T. gondii as indicated. Cell lysates were analysed as above. (c) Lysates from RPE cells challenged with cps T. gondii were probed for total EGFR and phospho‐Y1173 EGFR. Data shown are representative of three to four independent experiments. Densitometry data represent mean + SEM of three to four independent experiments
Figure 2
Figure 2
Src promotes prolonged EGFR autophosphorylation during Toxoplasma gondii infection. (a) RPE cells were treated with or without the ADAM inhibitor GM6001 beginning 1 hr before challenge with cps T. gondii. Cell lysates were obtained at the indicated time points and used to examine total EGFR and phospho‐Y1068 EGFR by immunoblot. A vertical line was inserted between densitometry data from control and GM6001‐treated cells to indicate that band densities from infected cells treated with or without GM6001 were compared with bands from their respective uninfected cells, which were given an arbitrary number of 1. RPE cells were also treated with or without lysophosphatidic acid in the presence or absence of GM6001. Cell lysates were obtained at 15 min and subjected to immunoblotting. (b, c) RPE cells were challenged with cps T. gondii, cultured with or without uracil and lysed at the indicated time points. Cell lysates were used to examine expression of total Src and phospho‐Y416 Src by immunoblot (b) or total EGFR and phospho‐Y845 EGFR (c). Relative densities of phospho‐Src and phospho‐EGFR for uninfected samples were given a value of 1. (d) RPE cells transfected with control or Src siRNA were incubated with cps T. gondii. Expression of total EGFR, phospho‐Y845 EGFR, and phospho‐Y1068 was assessed by immunoblot. A vertical line was inserted between densitometry data of lysates from control and Src siRNA‐treated cells to indicate that relative densities of phospho‐EGFR from infected cells transfected with control or Src siRNA were compared with bands from their respective uninfected cells. Relative density of phospho‐EGFR for uninfected samples was given a value of 1. (e) RPE cells were incubated with PP2 or vehicle 2 hr after challenge with cps T. gondii. Cell lysates were obtained and used to probe for total EGFR, phospho‐Y845 EGFR, and phospho‐Y1068. Data shown are representative of three to four independent experiments. Densitometry data represent mean + SEM of three to four experiments
Figure 3
Figure 3
PKCα and PKCβ mediate prolonged Src and EGFR activation in Toxoplasma gondii‐infected cell. (a) RPE cells were incubated with FAK inhibitor PF‐573228 or vehicle 2 hr after challenge with cps T. gondii. Cell lysates were obtained and used to probe for total Src and phospho‐Y416 Src. Relative density of phospho‐Src for uninfected samples was given a value of 1. (b) RPE cells were challenged with cps T. gondii. Total PKCα, phospho‐T638 PKCα, total PKCβ, and phospho‐T641 PKCβ were assessed by immunoblot. Relative density of phospho‐PKC for uninfected samples was assessed as above. (c, d) RPE cells transfected with control, PKCα, and/or PKCβ siRNA were incubated with cps T. gondii. Expression of total Src and phospho‐Y416 Src (c) and total EGFR and phospho‐Y1068 EGFR (d) was assessed by immunoblot. (e, f) RPE cells were incubated with Gö 6976 or vehicle 2 hr after challenge with cps (e) or PTG T. gondii (f). Cell lysates were obtained and used to probe for total Src and phospho‐Y416 Src, total EGFR, and phospho‐Y1068 EGFR. Data shown are representative of three to four independent experiments. Densitometry data represent mean + SEM of three to four independent experiments
Figure 4
Figure 4
EGFR TKI added after infection with Toxoplasma gondii inhibit parasite‐induced Akt activation and trigger parasite killing. (a) RPE cells were challenged with cps T. gondii. AG1478, gefitinib, or vehicle were added 2 hr after infection. Cell lysates were probed for total EGFR, phospho‐Y1068, and phospho‐Y845 EGFR. Relative densities for uninfected samples were given a value of 1. (b) RPE cells were challenged with RH T. gondii. Different concentrations of AG1478 or gefitinib were added 2 hr after challenge with T. gondii. Monolayers were examined at 24 hr to determine the numbers of T. gondii‐containing vacuoles per 100 cells. (c) Human brain microvascular endothelial cells (EC), RPE, and the microglia cell line BV‐2 were challenged with RH T. gondii. AG1478 (0.1 μM) or vehicle were added either 1 hr prior or 6 hr after challenge with T. gondii as indicated. Monolayers were examined at 24 hr to determine the percentages of infected cells, the numbers of T. gondii‐containing vacuoles, and tachyzoites per 100 cells as well as the numbers of parasites per vacuole. (d) Human brain microvascular endothelial cells and RPE cells were challenged with T. gondii‐RFP (RH) and incubated with or without gefitinib beginning at 2 hr postchallenge. Expression of LC3 and LAMP‐1 was examined by immunofluorescence 6 and 8 hr after addition of gefitinib, respectively. Original magnification 600×. Bar, 5 μm. Images shown represent endothelial cells. Bar graphs depict the percentages of vacuoles in endothelial cells and RPE cells that were surrounded by LC3 or LAMP‐1. (e) Human brain microvascular endothelial cells were treated with or without gefitinib beginning 2 hr after challenge with T. gondii (Tg) and processed for electron microscopy after 6 hr. Areas within the boxes are magnified at the bottom. Arrows indicate the PVM; asterisk (*) indicates the double membrane structure around the vacuole. Arrowhead indicates a likely lysosome. Bar, 100 nm. (f) RPE cells were transfected with control siRNA, ULK1 siRNA, or Beclin siRNA followed by treatment with or without gefitinib starting 2 hr postchallenge with RH T. gondii. Monolayers were examined by light microscopy 24 hr postinfection. (g) RPE cells were infected with RH T. gondii. Gefitinib with or without leupeptin plus pepstatin (L + P) were added postinfection, and monolayers were examined microscopically 24 hr postchallenge. (h) RPE cells were challenged with RH T. gondii. AG1478, gefitinib, or vehicle were added 2 hr after infection. Cell lysates were probed for total Akt, phospho‐S473 Akt, total STAT3, and phospho Y705 STAT3. Relative densities for uninfected samples were given a value of 1. (i) RPE cells were challenged with RH T. gondii. Akt inhibitor IV, Stattic, or vehicle were added either 1 hr prior or 2 hr after challenge with T. gondii as indicated. Monolayers were examined as above. (j) RPE cells were challenged with T. gondii‐RFP (RH) and incubated with or without Akt inhibitor IV beginning at 2 hr postchallenge. Accumulation of LC3 and LAMP‐1 around the parasite was assessed as above. Results are shown as the mean + SEM of a representative experiment out of two to three independent experiments. **P < .01; ***P < .001
Figure 5
Figure 5
Gefitinib diminishes Toxoplasma gondii load in the eye and brain and enhances resistance to ocular and cerebral toxoplasmosis. B6 mice were infected with T. gondii tissue cysts i.p. Beginning at day 6 postinfection, mice were treated with gefitinib (10 mg kg−1 i.p. 5 days week−1) or vehicle for 14 days. The eyes and brains were collected 20 days postinfection. (a) T. gondii B1 gene was examined using qPCR. Levels were compared with those of one control mouse that was given an arbitrary value of 1. Bar graph represents mean + SEM of nine to 10 mice pooled from two experiments. The eye from infected control mouse shows more prominent disruption of retinal architecture including the formation of folds and invasion by RPE (asterisk), as well as perivascular (arrowhead) and vitreal inflammation (arrow). H&E; 200×. Bar, 50 μm. Histopathology scores are shown in a bar graph as mean + SEM of nine to 10 mice. (b) Number of T. gondii tissue cysts per brain. The brain from control mouse shows more prominent parenchymal (arrow) and perivascular inflammation (arrowhead). Periodic acid Schiff haematoxylin original magnification 200×. Bar, 50 μm. Bar graphs represent mean + SEM of nine to 10 mice. *P < .05; **P < .01; ***P < .001
Figure 6
Figure 6
Effect of gefitinib on expression of IL‐12, IFN‐γ, TNF‐α, and NOS2 in the eye and brain as well as on the induction of systemic cellular and humoral immunity. (a) B6 mice were infected with ME49 Toxoplasma gondii, treated for 14 days with gefitinib or vehicle beginning on day 6 postinfection. Levels of IL‐12 p40, IFN‐γ, TNF‐α, and NOS2 mRNA in the eyes and brains were examined using qPCR. Each group contained nine to 10 mice pooled from two experiments. Results are shown as the mean + SEM. (b) Serum levels of IFN‐γ and TNF‐α at day 14 postinfection. (c, d) Splenocytes collected at day 14 postinfection were incubated with or without T. gondii lysate antigens (TLA), and supernatants were collected to measure IL‐12 p40, IFN‐γ, and TNF‐α (c) or measure nitric oxide by Griess reaction (d). Bars are mean + SEM of nine to 10 samples per group. (e) Spleen and lung lysates were subjected to immunoblot using Ab to IRGM3 and actin. (f) Serum titres of anti‐T. gondii IgG were measured by ELISA. Bars are mean + SEM of nine to 10 samples per group
Figure 7
Figure 7
Gefitinib enhances resistance to ocular and cerebral toxoplasmosis in mice with pre‐established disease. B6 mice were infected with Toxoplasma gondii tissue cysts i.p. (a, b) Beginning at 4 weeks postinfection, mice were treated with gefitinib (10 mg kg−1 i.p. 5 days week−1) or vehicle and were euthanised after 14 days. The eyes and brains were collected 6 weeks postinfection. (a) T. gondii B1 gene was examined in the eye by using qPCR. Bar graph represents mean + SEM of 12 mice pooled from three experiments. The eyes from infected control mouse show marked disruption of retinal architecture, as well as occasional tissue cysts (arrowhead in the image to the right). The eye from the gefitinib‐treated mouse shows reduced disruption in retinal architecture. H&E; 200×. Bar, 50 μm. Histopathology scores are shown in a bar graph as mean + SEM of 12 samples per group pooled from three experiments. (b) Numbers of T. gondii tissue cysts per brain. The brain from control mouse shows more prominent parenchymal (arrows) and perivascular inflammation (arrowhead). Periodic acid Schiff haematoxylin original magnification 200×. Bar, 50 μm. Histopathology scores are shown in bar graph as mean + SEM of 12 samples per group pooled from three experiments. Bar graphs represent mean + SEM of nine mice pooled from two experiments. ** P < .01; *** P < .001
Figure 8
Figure 8
Gefitinib fails to control ocular and cerebral toxoplasmosis in Beclin 1‐deficient mice. Becn1 +/+ and Becn1 +/ mice were infected with T. gondii tissue cysts i.p., and at 2 weeks postinfection, they were treated with gefitinib or vehicle for 2 weeks. The eyes and brains were collected 4 weeks postinfection. (a) Toxoplasma gondii B1 gene was examined in the eye by using qPCR. Bar graph represents mean + SEM of nine mice pooled from two experiments. Image from gefitinib‐treated Becn1 +/+ mouse shows better preservation in retinal architecture. Gefitinib does not improve retinitis in Becn1 +/ mice. Retina from gefitinib‐treated mouse shows invasion by retinal pigment epithelial cells (arrowhead). H&E; 200×. Bar, 50 μm. Histopathology scores are shown in a bar graph as mean + SEM of nine samples per group pooled from two experiments. (b) Numbers of T. gondii tissue cysts per brain. Gefitinib does not improve encephalitis in Becn1 +/ mice. Periodic acid Schiff haematoxylin original magnification 200×. Bar, 50 μm. Bar graphs represent mean + SEM of nine mice pooled from two experiments. **P < .01; n.s., not significant
Figure 9
Figure 9
Toxoplasma gondii activates signalling cascades both during invasion of host cells and during its intracellular stage that enable the parasite to avoid autophagic targeting. (a) Parasite adhesins with EGF‐like domains (MIC3 and MIC6) induce phosphorylation in tyrosine residues in the C‐terminal end of EGFR (autophosphorylation) and activation of Akt, an inhibitor of autophagy. (b) During penetration of mammalian cells, the formation of the moving junction (characterised by the presence of rhoptry neck proteins including RON4) is accompanied by activation of FAK that leads to Src signalling. Src transactivates EGFR (Y845 phosphorylation) triggering early STAT3 signalling. This prevents activation of PKR, thus inhibiting autophagic targeting of the parasite. (c) During its intracellular stage, T. gondii causes activation of PKCα/PKCβ–Src signalling that sustains EGFR autophosphorylation maintaining blockade of autophagic targeting, an effect that appears to be mediated via Akt

References

    1. Andrade, R. M. , Wessendarp, M. , Gubbels, M. J. , Striepen, B. , & Subauste, C. S. (2006). CD40 induces macrophage anti‐Toxoplasma gondii activity by triggering autophagy‐dependent fusion of pathogen‐containing vacuoles and lysosomes. The Journal of Clinical Investigation, 116, 2366–2377. 10.1172/JCI28796 - DOI - PMC - PubMed
    1. Basu, M. , Biswas, R. , & Das, M. (1984). 42,000‐molecular weight EGF receptor has protein kinase activity. Nature, 311, 477–480. 10.1038/311477a0 - DOI - PubMed
    1. Besteiro, S. , Dubremetz, J. F. , & Lebrun, M. (2011). The moving junction of apicomplexan parasites: A key structure for invasion. Cellular Microbiology, 13, 797–805. 10.1111/j.1462-5822.2011.01597.x - DOI - PubMed
    1. Biscardi, J. S. , Maa, M. C. , Tice, D. A. , Cox, M. E. , Leu, T. H. , & Parsons, J. T. (1999). c‐Src‐mediated phosphorylation of the epidermal growth factor receptor on Tyr845 and Tyr1101 is associated with modulation of receptor function. The Journal of Biological Chemistry, 274, 8335–8343. 10.1074/jbc.274.12.8335 - DOI - PubMed
    1. Bosch‐Driessen, L. E. H. , Berrendschot, T. T. J. M. , Ongkosuwito, J. V. , & Rothova, A. (2002). Ocular toxoplasmosis. Clinical features and prognosis of 154 patents. Ophthalmology, 109, 869–878. 10.1016/S0161-6420(02)00990-9 - DOI - PubMed

Publication types

MeSH terms