

MicroRNA expression in the hippocampal CA1 region under deep hypothermic circulatory arrest
- PMID: 31290459
- PMCID: PMC6676878
- DOI: 10.4103/1673-5374.253174
MicroRNA expression in the hippocampal CA1 region under deep hypothermic circulatory arrest
Abstract
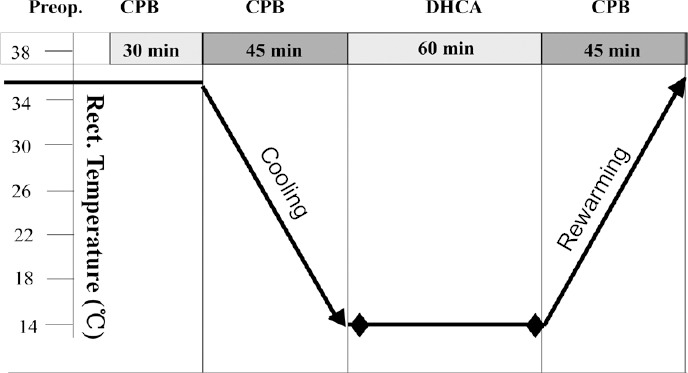
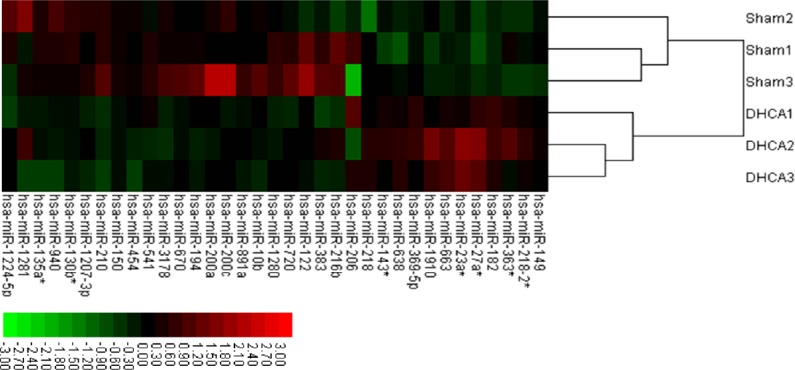
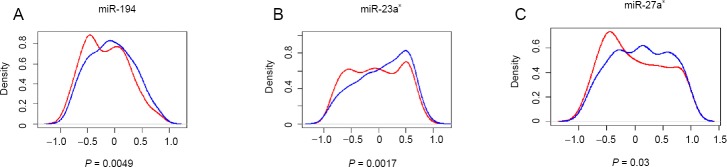
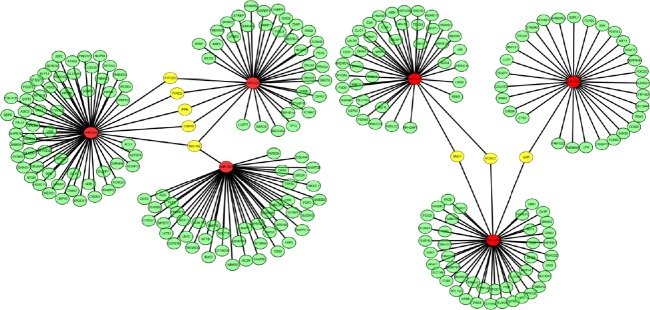
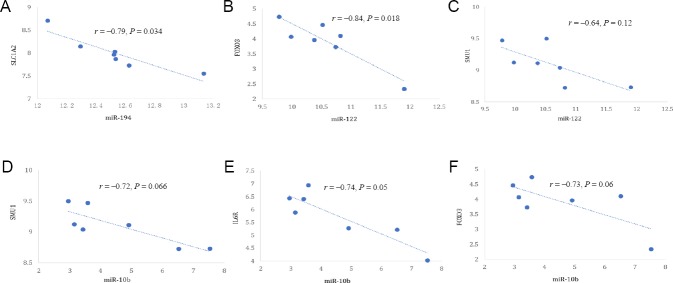
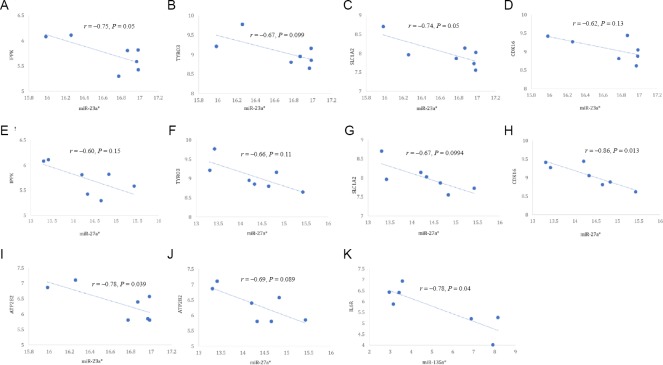
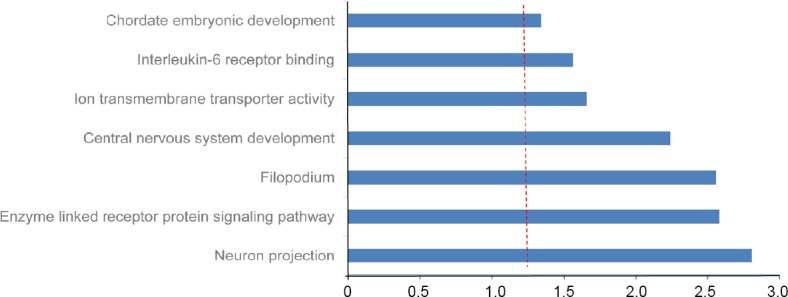
Using deep hypothermic circulatory arrest, thoracic aorta diseases and complex heart diseases can be subjected to corrective procedures. However, mechanisms underlying brain protection during deep hypothermic circulatory arrest are unclear. After piglet models underwent 60 minutes of deep hypothermic circulatory arrest at 14°C, expression of microRNAs (miRNAs) was analyzed in the hippocampus by microarray. Subsequently, TargetScan 6.2, RNA22 v2.0, miRWalk 2.0, and miRanda were used to predict potential targets, and gene ontology enrichment analysis was carried out to identify functional pathways involved. Quantitative reverse transcription-polymerase chain reaction was conducted to verify miRNA changes. Deep hypothermic circulatory arrest altered the expression of 35 miRNAs. Twenty-two miRNAs were significantly downregulated and thirteen miRNAs were significantly upregulated in the hippocampus after deep hypothermic circulatory arrest. Six out of eight targets among the differentially expressed miRNAs were enriched for neuronal projection (cyclin dependent kinase, CDK16 and SLC1A2), central nervous system development (FOXO3, TYRO3, and SLC1A2), ion transmembrane transporter activity (ATP2B2 and SLC1A2), and interleukin-6 receptor binding (IL6R) - these are the key functional pathways involved in cerebral protection during deep hypothermic circulatory arrest. Quantitative reverse transcription-polymerase chain reaction confirmed the results of microarray analysis. Our experimental results illustrate a new role for transcriptional regulation in deep hypothermic circulatory arrest, and provide significant insight for the development of miRNAs to treat brain injuries. All procedures were approved by the Animal Care Committee of Xuanwu Hospital, Capital Medical University, China on March 1, 2017 (approval No. XW-INI-AD2017-0112).
Keywords: bioinformatics; cerebral protection; deep hypothermic circulatory arrest; gene ontology enrichment analysis; hippocampus; microRNA; microarray; nerve regeneration; neural regeneration; post-transcriptional expression.
Conflict of interest statement
None
Figures

Similar articles
-
Inhibition of long noncoding RNA growth arrest-specific 5 attenuates cerebral injury induced by deep hypothermic circulatory arrest in rats.J Thorac Cardiovasc Surg. 2020 Jan;159(1):50-59. doi: 10.1016/j.jtcvs.2019.01.050. Epub 2019 Jan 25. J Thorac Cardiovasc Surg. 2020. PMID: 30824348
-
Dysregulation of renal microRNA expression after deep hypothermic circulatory arrest in rats.Eur J Cardiothorac Surg. 2016 Jun;49(6):1725-31. doi: 10.1093/ejcts/ezv460. Epub 2016 Jan 21. Eur J Cardiothorac Surg. 2016. PMID: 26802145
-
Transcriptome profiling reveals activation of inflammation and apoptosis in the neonatal striatum after deep hypothermic circulatory arrest.J Thorac Cardiovasc Surg. 2019 Sep;158(3):882-890.e4. doi: 10.1016/j.jtcvs.2019.02.091. Epub 2019 Mar 6. J Thorac Cardiovasc Surg. 2019. PMID: 31005300
-
Adjunct retrograde cerebral perfusion provides superior outcomes compared with hypothermic circulatory arrest alone: A meta-analysis.J Thorac Cardiovasc Surg. 2018 Oct;156(4):1339-1348.e7. doi: 10.1016/j.jtcvs.2018.04.063. Epub 2018 Apr 21. J Thorac Cardiovasc Surg. 2018. PMID: 29789153
-
Is moderate hypothermic circulatory arrest with selective antegrade cerebral perfusion superior to deep hypothermic circulatory arrest in elective aortic arch surgery?Interact Cardiovasc Thorac Surg. 2016 Sep;23(3):462-8. doi: 10.1093/icvts/ivw124. Epub 2016 May 21. Interact Cardiovasc Thorac Surg. 2016. PMID: 27209532 Review.
Cited by
-
Dynamic changes of behaviors, dentate gyrus neurogenesis and hippocampal miR-124 expression in rats with depression induced by chronic unpredictable mild stress.Neural Regen Res. 2020 Jun;15(6):1150-1159. doi: 10.4103/1673-5374.270414. Neural Regen Res. 2020. PMID: 31823896 Free PMC article.
-
Transcriptomic Profiling of circRNAs in rat Hippocampus after Deep Hypothermic Circulatory Arrest.Int J Med Sci. 2023 Apr 1;20(5):627-638. doi: 10.7150/ijms.82503. eCollection 2023. Int J Med Sci. 2023. PMID: 37082735 Free PMC article.
-
Diagnostic model of combined ceRNA and DNA methylation related genes in esophageal carcinoma.PeerJ. 2020 Mar 31;8:e8831. doi: 10.7717/peerj.8831. eCollection 2020. PeerJ. 2020. PMID: 32266120 Free PMC article.
References
-
- Allen JG, Weiss ES, Wilson MA, Arnaoutakis GJ, Blue ME, Talbot CC, Jr, Jie C, Lange MS, Troncoso JC, Johnston MV, Baumgartner WA. Hawley H. Seiler Resident Award. Transcriptional profile of brain injury in hypothermic circulatory arrest and cardiopulmonary bypass. Ann Thorac Surg. 2010;89:1965–1971. - PMC - PubMed
-
- Amir G, Ramamoorthy C, Riemer RK, Reddy VM, Hanley FL. Neonatal brain protection and deep hypothermic circulatory arrest: pathophysiology of ischemic neuronal injury and protective strategies. Ann Thorac Surg. 2005;80:1955–1964. - PubMed
-
- Borze I, Scheinin I, Siitonen S, Elonen E, Juvonen E, Knuutila S. miRNA expression profiles in myelodysplastic syndromes reveal Epstein-Barr virus miR-BART13 dysregulation. Leuk Lymphoma. 2011;52:1567–1573. - PubMed
-
- Bourguignon LY, Wong G, Earle C, Krueger K, Spevak CC. Hyaluronan-CD44 interaction promotes c-Src-mediated twist signaling, microRNA-10b expression, and RhoA/RhoC up-regulation, leading to Rho-kinase-associated cytoskeleton activation and breast tumor cell invasion. J Biol Chem. 2010;285:36721–36735. - PMC - PubMed
LinkOut - more resources
Full Text Sources
Research Materials
Miscellaneous
