. 2019 Jul 10:8:e47454.
doi: 10.7554/eLife.47454.

The mechanosensitive Piezo1 channel is required for bone formation

Affiliations

The mechanosensitive Piezo1 channel is required for bone formation

Weijia Sun et al. Elife. .

Abstract

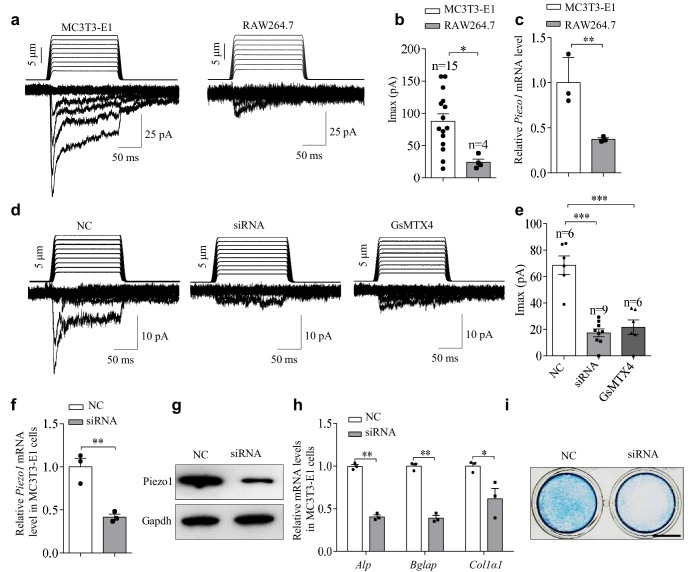
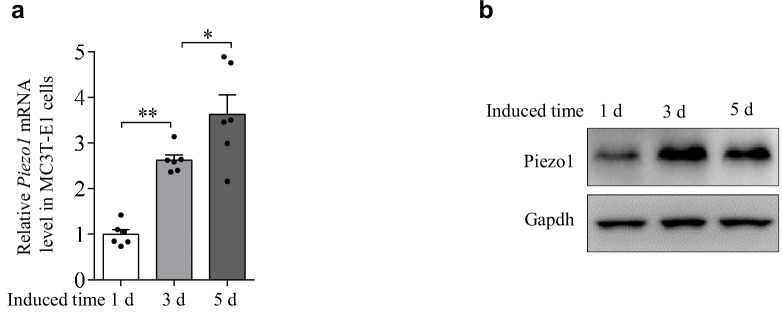
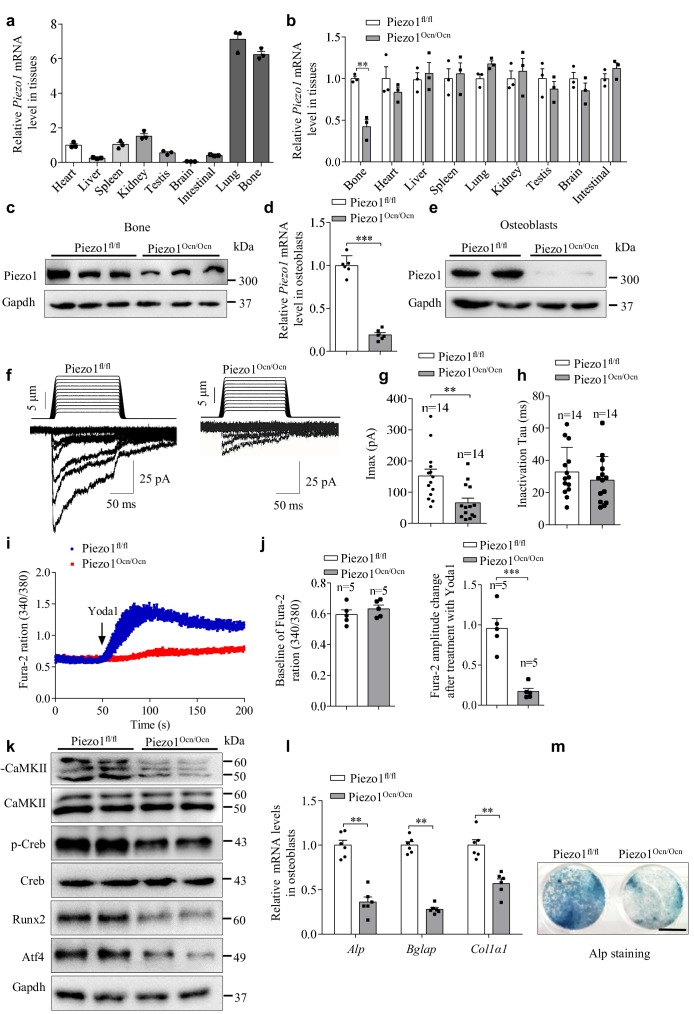
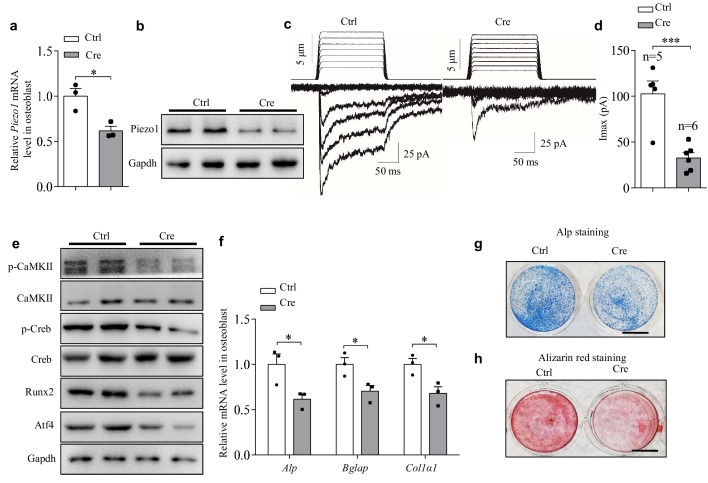
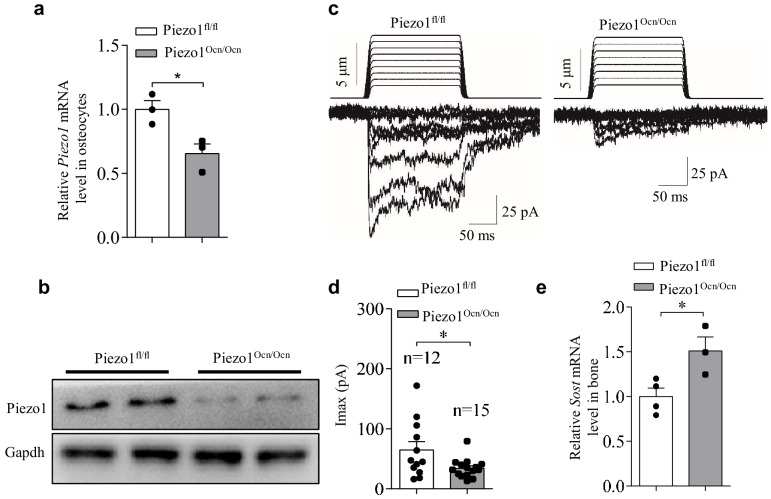
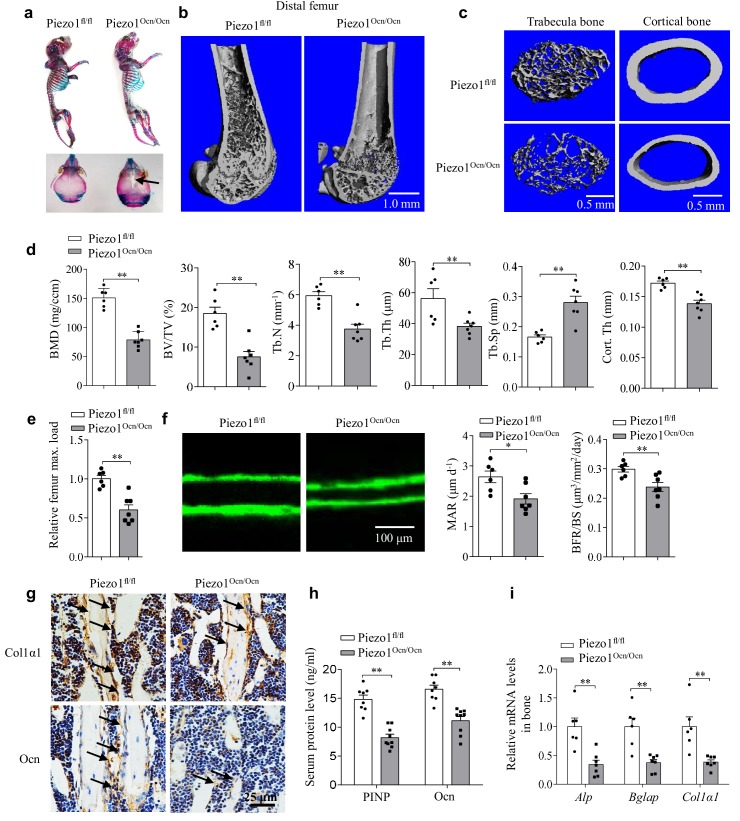
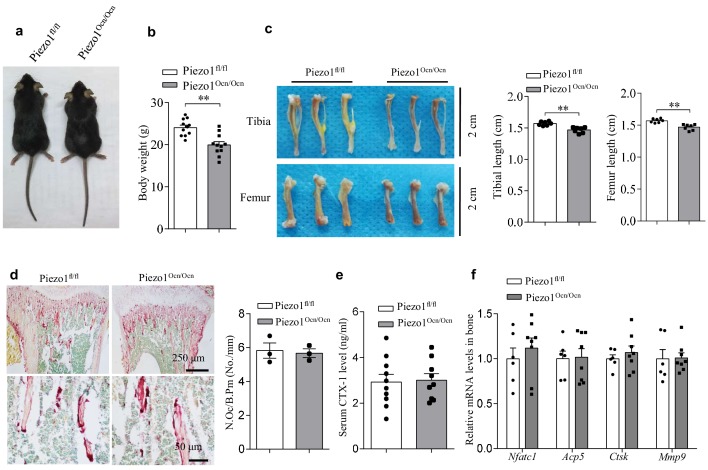
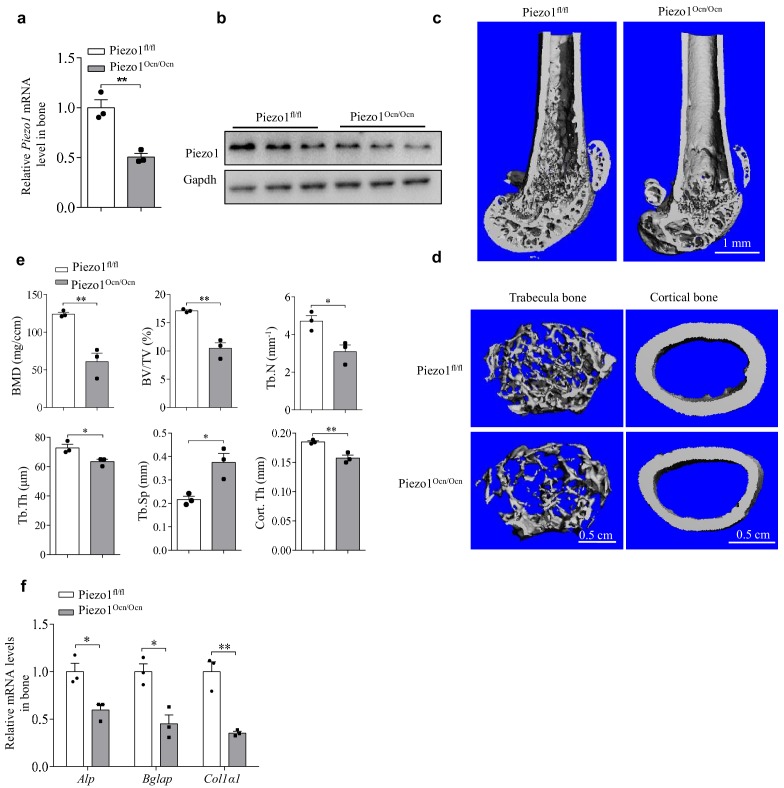
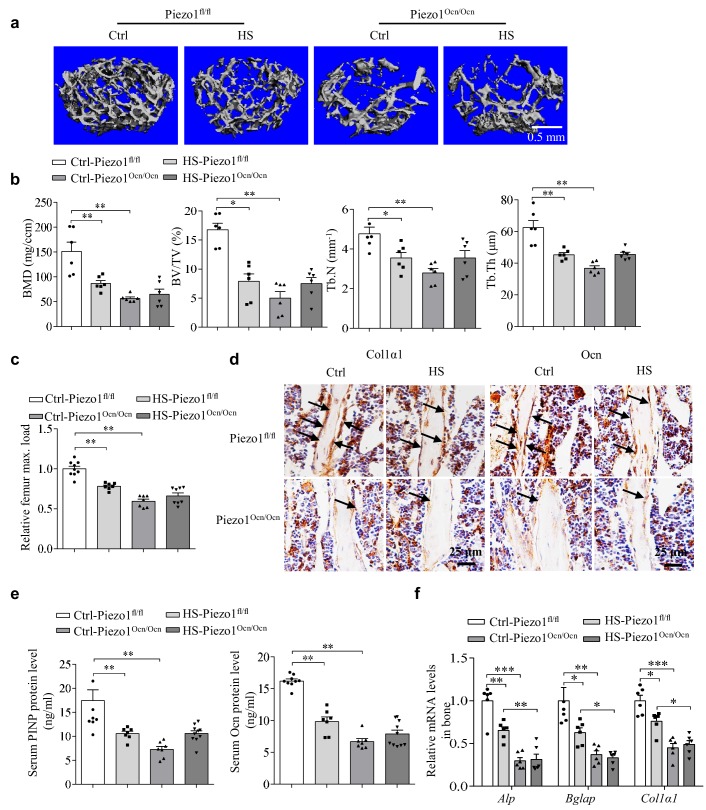
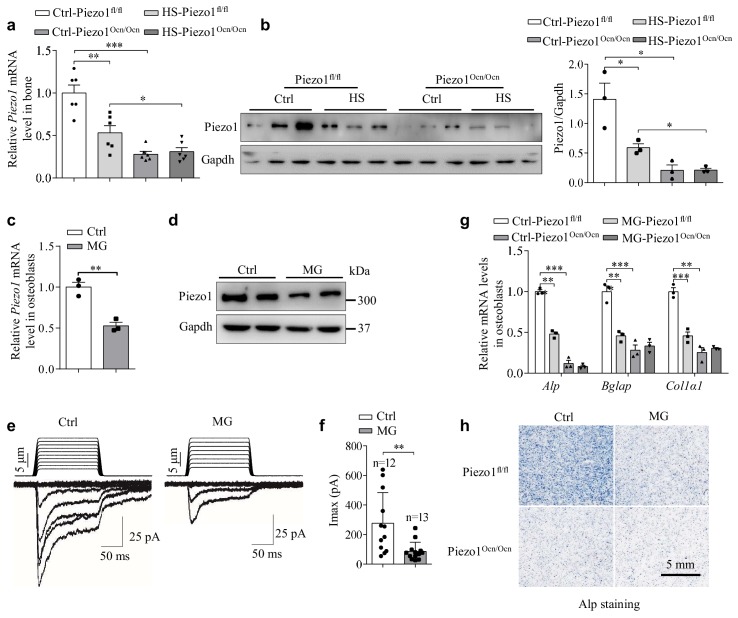
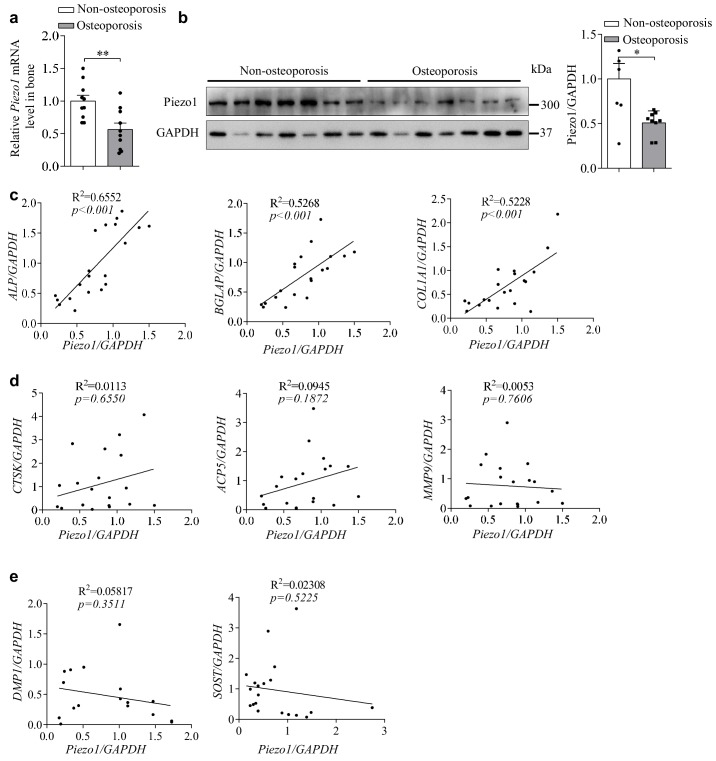
Mechanical load of the skeleton system is essential for the development, growth, and maintenance of bone. However, the molecular mechanism by which mechanical stimuli are converted into osteogenesis and bone formation remains unclear. Here we report that Piezo1, a bona fide mechanotransducer that is critical for various biological processes, plays a critical role in bone formation. Knockout of Piezo1 in osteoblast lineage cells disrupts the osteogenesis of osteoblasts and severely impairs bone structure and strength. Bone loss that is induced by mechanical unloading is blunted in knockout mice. Intriguingly, simulated microgravity treatment reduced the function of osteoblasts by suppressing the expression of Piezo1. Furthermore, osteoporosis patients show reduced expression of Piezo1, which is closely correlated with osteoblast dysfunction. These data collectively suggest that Piezo1 functions as a key mechanotransducer for conferring mechanosensitivity to osteoblasts and determining mechanical-load-dependent bone formation, and represents a novel therapeutic target for treating osteoporosis or mechanical unloading-induced severe bone loss.

Keywords: Piezo1; bone formation; cell biology; human; mechanosensitive ion channel; mechanotransduction; mouse; osteoblast; unloading.


Conflict of interest statement

WS, SC, YL, SL, YT, YX, FJ, JL, CL, GZ, DC, XJ, DZ, XG, ZL, BX, YL No competing interests declared

Figures

Figure 1.
Figure 1.. The expression and function of Piezo1 in the pre-osteoblast cell line MC3T3-E1.
(a) Representative traces of poking-induced inward currents recorded at −60 mV in the indicated cell lines. (b) Scatter plots of the maximal poking-induced currents in the indicated cell lines. (c) QRT-PCR analysis of Piezo1 mRNA level in the indicated cell lines. (d) Representative traces of poking-induced inward currents recorded at −60 mV in MC3T3-E1 under the indicated conditions. 'siRNA' indicates the siRNA-mediated knockdown of Piezo1. NC, Piezo1 negative-control siRNA. GsMTX4 is a relatively specific blocker of the Piezo channel family. (e) Scatter plots of the maximal poking-induced currents in MC3T3-E1 cells under the indicated conditions. (f, g) QRT-PCR analysis of Piezo1 mRNA level (f) and western blot analysis of Piezo1 protein level (g) in MC3T3-E1 cells transfected with control or Piezo1 siRNA for 48 hr. (h) QRT-PCR analysis of Alp, Bglap, and Col1α1 mRNA levels in MC3T3-E1 cells transfected with control or Piezo1 siRNA for 48 hr. (i) Representative images of Alp staining in MC3T3-E1 cells transfected with control or Piezo1 siRNA for 48 hr. Scale bar, 5 mm. *, p<0.05; **, p<0.01; ***, p<0.001.
Figure 1—figure supplement 1.
Figure 1—figure supplement 1.. Osteogenic-induced expression of Piezo1 in the pre-osteoblast cell line MC3T3-E1.
QRT-PCR analysis of Piezo1 mRNA level. (a) QRT-PCR analysis of Piezo1 mRNA level and (b) western blot analysis of Piezo1 protein level in the osteoblasts cultured with osteogenic medium for 1 day, 3 days and 5 days. All data are the mean ± s.e.m. from three independent experiments. *, p<0.05; **, p<0.01.
Figure 2.
Figure 2.. Expression and function of Piezo1 in primary osteoblasts isolated from Piezo1fl/fl and Piezo1Ocn/Ocn mice.
(a) QRT-PCR analysis of Piezo1 mRNA level in bone and other tissues from WT mice. (b) QRT-PCR analysis of Piezo1 mRNA level in different tissues from Piezo1fl/fl or Piezo1Ocn/Ocn mice. The Piezo1 mRNA level in all tissues from Piezo1Ocn/Ocn mice was normalized to that in Piezo1fl/fl mice. (c) Western blot analysis of Piezo1 protein level in bone tissues from Piezo1fl/fl and Piezo1Ocn/Ocn mice. (d) QRT-PCR analysis of Piezo1 mRNA level in primary osteoblasts isolated from Piezo1fl/fl or Piezo1Ocn/Ocn mice and cultured with osteogenic medium for 5 days. (e) Western blot analysis of Piezo1 protein level in primary osteoblasts cultured with osteogenic medium for 5 days. (f) Representative traces of poking-induced inward currents recorded at −60 mV in primary osteoblasts isolated from Piezo1fl/fl or Piezo1Ocn/Ocn mice. (g, h) Scatter plots of the maximal poking-induced currents (g) and inactivation tau (h) in primary osteoblasts isolated from Piezo1fl/fl or Piezo1Ocn/Ocn mice. (i) Average single-cell Ca2+ imaging traces of Piezo1fl/fl or Piezo1Ocn/Ocn osteoblasts showing the 340/380 ratio of the Ca2+-sensitive Fura-2 dye in response to the application of 30 μM Yoda1. (j) Scatter plot of baseline and Yoda1-induced Fura-2 amplitude changes in Piezo1fl/fl or Piezo1Ocn/Ocn osteoblasts. (k) Western blot analysis of p-CaMKII, CaMKII, p-Creb, Creb, Runx2 and Atf4 proteins in primary osteoblasts cultured with osteogenic medium for 5 days. (l) QRT-PCR analysis of Alp, Bglap and Col1α1 mRNA levels in primary osteoblasts cultured with osteogenic medium for 5 days. (m) Representative images of Alp staining in primary osteoblasts cultured with osteogenic medium for 5 days. Scale bar, 5 mm. The staining data were confirmed by three repeated tests. All data are the mean ± s.e.m. from three independent experiments. **, p<0.01; ***, p<0.001.
Figure 2—figure supplement 1.
Figure 2—figure supplement 1.. Characterizations of primary osteoblasts derived from Piezo1fl/fl mice with or without ectopic expression of the Cre recombinase.
(a, b) QRT-PCR analysis of Piezo1 mRNA level (a) and western blot analysis of Piezo1 protein level (b) in osteoblasts derived from Piezo1fl/fl mice after transfection with pIRES-EGFP (Ctrl) or pCAG-Cre-IRES2-GFP (Cre) plasmid. (c) Representative traces of poking-induced inward currents recorded at −60 mV in an osteoblast from Piezo1fl/fl mice after transfection with Ctrl or Cre plasmid. Cells with green fluorescence were used to record current. (d) Scatter plots of the maximal poking-induced currents in osteoblasts from Piezo1fl/fl mice after transfection with Ctrl or Cre plasmid. (e) Western blot analysis of p-CaMKII, CaMKII, p-Creb, Creb, Runx2 and Atf4 proteins in osteoblasts from Piezo1fl/fl mice after transfection with Ctrl or Cre. (f) QRT-PCR analysis of Alp, Bglap and Col1α1 mRNA levels in osteoblasts from Piezo1fl/fl mice after transfection with Ctrl or Cre plasmid. (g) Representative images of Alp staining in osteoblasts from Piezo1fl/fl mice after transfection with Ctrl or Cre plasmid in osteogenic medium for 5 days. Scale bar, 5 mm. (h) Staining of calcium deposition by Alizarin red in osteoblasts derived from Piezo1fl/fl mice after transfection with Ctrl or Cre plasmid in osteogenic medium for 14 days. Scale bar, 5 mm. All data are the mean ± s.e.m. from three independent experiments. *, p<0.05; ***, p<0.001.
Figure 2—figure supplement 2.
Figure 2—figure supplement 2.. Expression and function of Piezo1 in osteocytes isolated from Piezo1fl/fl and Piezo1Ocn/Ocn mice.
(a, b) QRT-PCR analysis of Piezo1 mRNA level (a) and western blot analysis of Piezo1 protein level (b) in osteocytes from Piezo1fl/fl and Piezo1Ocn/Ocn mice. (c) Representative traces of poking-induced inward currents recorded at −60 mV in osteocytes from Piezo1fl/fl and Piezo1Ocn/Ocn mice. (d) Scatter plots of the maximal poking-induced currents in osteocytes from Piezo1fl/fl and Piezo1Ocn/Ocn mice. (e) QRT-PCR analysis of Sost mRNA levels in bone tissues from Piezo1fl/fl and Piezo1Ocn/Ocn mice. All data are the mean ± s.e.m. from three independent experiments. *, p<0.05; **, p<0.01.
Figure 3.
Figure 3.. Piezo1Ocn/Ocn mice show severely impaired bone formation.
(a) Alcian blue and Alizarin red staining of the skeletons of Piezo1fl/fl or Piezo1Ocn/Ocn mice at 7 days old. (b, c) Representative images showing the three-dimensional cortical bone and trabecular architecture as shown by micro-CT reconstruction at the distal femurs from Piezo1fl/fl or Piezo1Ocn/Ocn mice at 2 months old. Scale bars: (b) 1.0 mm, (c) 0.5 mm. (d) Micro-CT measurements for bone mineral density (BMD), trabecular bone volume fraction (BV/TV), trabecular number (Tb.N), trabecular thickness (Tb.Th), trabecular separation (Tb.Sp) and cortical thickness (Cort.Th) at the distal femurs from Piezo1fl/fl (n = 6) or Piezo1Ocn/Ocn (n = 7) mice. (e) Relative maximal (max.) load at failure determined by three-point bending of femurs from Piezo1fl/fl (n = 6) and Piezo1Ocn/Ocn mice (n = 7). (f) Representative images showing new bone formation assessed by double calcein labeling in Piezo1fl/fl mice (n = 6) and Piezo1Ocn/Ocn mice (n = 7). MAR, mineral apposition rate. BFR/BS, bone formation rate/bone surface. Scale bar, 100 μm. (g) Histology images for Col1α1 and Ocn staining of the proximal tibia from Piezo1fl/fl and Piezo1Ocn/Ocn mice. Scale bar, 25 μm. (h) ELISA analysis of the levels of PINP and Ocn protein levels in the serum from Piezo1fl/fl (n = 8) and Piezo1Ocn/Ocn mice (n = 9). (i) QRT-PCR analysis of Alp, Bglap and Col1α1 mRNA levels in bone tissues collected from Piezo1fl/fl (n = 6) and Piezo1Ocn/Ocn mice (n = 7). All data are the mean ± s.e.m. *, p<0.05; **, p<0.01.
Figure 3—figure supplement 1.
Figure 3—figure supplement 1.. The phenotypes of Piezo1fl/fl and Piezo1Ocn/Ocn mice.
(a) The appearance and body length of 2-month-old Piezo1fl/fl and Piezo1Ocn/Ocn mice. (b) The body weight of Piezo1fl/fl (n = 11) and Piezo1Ocn/Ocn mice (n = 11). (c) The appearance and the length of femurs and tibias from Piezo1fl/fl (n = 7) and Piezo1Ocn/Ocn mice (n = 7). (d) Representative images of Trap staining in bone tissue from Piezo1fl/fl and Piezo1Ocn/Ocn mice. N.Oc/B.Pm, osteoclast number/bone perimeter. (e) ELISA analysis of the levels of CTX-1 protein level in the serum from Piezo1fl/fl (n = 10) and Piezo1Ocn/Ocn mice (n = 9). (f) QRT-PCR analysis of Nfatc1, Acp5, Ctsk and Mmp9 mRNA levels in bone tissue from Piezo1fl/fl (n = 6) and Piezo1Ocn/Ocn mice (n = 8). All data are the mean ± s.e.m. **, p<0.01.
Figure 3—figure supplement 2.
Figure 3—figure supplement 2.. The phenotypes of female Piezo1fl/fl and Piezo1Ocn/Ocn mice.
(a) QRT-PCR analysis of Piezo1 mRNA level in bone tissue from Piezo1fl/fl or Piezo1Ocn/Ocn female mice at 2 months. (b) Western blot analysis of Piezo1 protein level in bone tissue from Piezo1fl/fl and Piezo1Ocn/Ocn female mice at 2 months. (c, d) Representative images showing three-dimensional cortical bone and trabecular architecture as determined by micro-CT reconstruction at the distal femurs of Piezo1fl/fl or Piezo1 Ocn/Ocn female mice at 2 months old. Scale bars: 1.0 mm (c), 0.5 mm (d). (e) Micro-CT measurements for BMD, BV/TV, Tb.N, Tb.Th, Tb.Sp and Cort.Th in the distal femurs of Piezo1fl/fl or Piezo1Ocn/Ocn female mice. (f) QRT-PCR analysis of Alp, Bglap and Col1α1 mRNA levels in bone tissues collected from Piezo1fl/fl and Piezo1Ocn/Ocn female mice. Each group, n = 3. All data are the mean ± s.e.m. *, p<0.05; **, p<0.01.
Figure 4.
Figure 4.. The effect of mechanical unloading on bone remodeling and osteoblast function in Piezo1fl/fl and Piezo1Ocn/Ocn mice.
(a) Representative images showing three-dimensional trabecular architecture as determined by micro-CT reconstruction of the distal femurs from the groups of mice indicated. Scale bar, 0.5 mm. (b) Micro-CT measurements for BMD, BV/TV, Tb.N and Tb.Th in the distal femurs from the groups of mice indicated. n = 6 in each group. (c) Relative maximal (max.) load at failure determined by three-point bending of femurs from the groups of mice indicated. Ctrl-Piezo1fl/fl group, n = 9; HS-Piezo1fl/fl group, n = 7; Ctrl- Piezo1Ocn/Ocn group, n = 7; HS-Piezo1Ocn/Ocn group, n = 8. (d) Histology images for Col1α1 and Ocn staining of the proximal tibia from the groups of mice indicated. Scale bar: 25 μm. (e) ELISA analysis of the levels of PINP and Ocn proteins in serum from the groups of mice indicated. Ctrl- Piezo1fl/fl group, n = 9; HS-Piezo1fl/fl group, n = 7; Ctrl-Piezo1Ocn/Ocn group, n = 7; HS-Piezo1Ocn/Ocn group, n = 10. (f) QRT-PCR analysis of Alp, Bglap and Col1α1 mRNA levels in bone tissues collected from the groups of mice indicated. n = 6 in each group. All data are the mean ± s.e.m. *, p<0.05; **, p<0.01; ***, p<0.001.
Figure 5.
Figure 5.. Mechanical unloading suppresses Piezo1 expression in Piezo1Ocn/Ocn mice and osteoblasts.
(a, b) QRT-PCR analysis of Piezo1 mRNA level (a) and western blot analysis of Piezo1 protein level (b) in bone tissues from the groups of mice with the indicated treatment conditions. (c, d) QRT-PCR analysis of Piezo1 mRNA level and western blot analysis of Piezo1 protein level in osteoblasts under control (Ctrl) and simulated microgravity (MG) conditions. (e) Representative traces of poking-induced inward currents recorded at −60 mV in osteoblasts under Ctrl and MG conditions. (f) Scatter plots of the maximal poking-induced currents in osteoblasts under Ctrl and MG conditions. (g) QRT-PCR analysis of Alp, Bglap and Col1α1 mRNA levels in primary osteoblasts isolated from Piezo1fl/fl and Piezo1Ocn/Ocn mice under Ctrl and MG conditions. (h) Representative images of Alp staining in osteoblasts isolated from the indicated mice under Ctrl and MG conditions. Scale bar: 5 mm. All data are the mean ± s.e.m. from three independent experiments. **, p<0.01; ***, p<0.001.
Figure 6.
Figure 6.. Mechanical loading promotes Piezo1 expression in osteoblasts.
(a, b) QRT-PCR analysis of Piezo1 mRNA level (a) and Western blotting analysis of Piezo1 protein level (b) in bone tissues from the groups of mice with the indicated treatment conditions. Ex, Exercise. Ctrl-Piezo1fl/fl group, n = 4; Ex-Piezo1fl/fl group, n = 5; Ctrl-Piezo1Ocn/Ocn group, n = 3; Ex-Piezo1Ocn/Ocn group, n = 4. (c) QRT-PCR analysis of Alp, Bglap and Col1α1 mRNA levels in bone tissues collected from the groups of mice as indicated above. (d, e) QRT-PCR analysis of Piezo1 mRNA level (d) and Western blotting analysis of Piezo1 protein level (e) in osteoblasts isolated from Piezo1fl/fl and Piezo1Ocn/Ocn mice under control (Ctrl) and fluid shear stress (FSS) conditions. (f) QRT-PCR analysis of Alp, Bglap and Col1α1 mRNA levels in osteoblasts isolated from the indicated mice under Ctrl and FSS conditions. (g) Representative images of Alp staining in osteoblasts isolated from the indicated mice under Ctrl and FSS conditions. Scale bar: 1 cm. All data are the mean ± s.e.m. from three independent experiments. *, p<0.05; **, p<0.01; ***, p<0.001.
Figure 7.
Figure 7.. Osteoporosis bone specimens have decreased Piezo1 expression and correlated defective osteoblast function.
(a) QRT-PCR analysis of Piezo1 mRNA level in bone specimens from two T-score groups. T > −2.5 group, n = 10, and T ≤ −2.5 group, n = 10. (b) Western blot analysis of Piezo1 protein level in bone specimens from two T-score groups. T > −2.5 group, n = 7, and T≤- 2.5 group, n = 7. Quantification of Piezo1 protein level was normalized to GAPDH. (c) Correlation analysis between Piezo1 level and the levels of ALP, BGLAP or COL1α1. T > −2.5 group, n = 10, and T ≤ −2.5 group, n = 10. (d) Correlation analysis between Piezo1 levels and the levels of CTSK (cathepsin K), ACP5 (acid phosphatase 5) or MMP9 (matrix metallopeptidase 9). T > −2.5 group, n = 10, and T ≤ −2.5 group, n = 10. (e) Correlation analysis between Piezo1 levels and the level of DMP1 (dentin matrix acidic phosphoprotein 1 ) or SOST (sclerostin). All data are the mean ± s.e.m. *, p<0.05; **, p<0.01; ***, p<0.001.

Comment in

  • Sensing the load.
    Haelterman N, Lim J. Haelterman N, et al. Elife. 2019 Oct 7;8:e50210. doi: 10.7554/eLife.50210. Elife. 2019. PMID: 31588900 Free PMC article.

References

    1. Bae C, Sachs F, Gottlieb PA. The mechanosensitive ion channel Piezo1 is inhibited by the peptide GsMTx4. Biochemistry. 2011;50:6295–6300. doi: 10.1021/bi200770q. - DOI - PMC - PubMed
    1. Cahalan SM, Lukacs V, Ranade SS, Chien S, Bandell M, Patapoutian A. Piezo1 links mechanical forces to red blood cell volume. eLife. 2015;4:e07370. doi: 10.7554/eLife.07370. - DOI - PMC - PubMed
    1. Carmeliet G, Bouillon R. Space flight: a challenge for normal bone homeostasis. Critical Reviews in Eukaryotic Gene Expression. 2001;11:14–144. doi: 10.1615/CritRevEukarGeneExpr.v11.i1-3.70. - DOI - PubMed
    1. Chen X, Wanggou S, Bodalia A, Zhu M, Dong W, Fan JJ, Yin WC, Min HK, Hu M, Draghici D, Dou W, Li F, Coutinho FJ, Whetstone H, Kushida MM, Dirks PB, Song Y, Hui CC, Sun Y, Wang LY, Li X, Huang X. A feedforward mechanism mediated by mechanosensitive ion channel PIEZO1 and tissue mechanics promotes glioma aggression. Neuron. 2018;100:799–815. doi: 10.1016/j.neuron.2018.09.046. - DOI - PubMed
    1. Choi YH, Choi JH, Oh JW, Lee KY. Calmodulin-dependent kinase II regulates osteoblast differentiation through regulation of osterix. Biochemical and Biophysical Research Communications. 2013;432:248–255. doi: 10.1016/j.bbrc.2013.02.005. - DOI - PubMed

Publication types