

Common Variants in Lipid Metabolism-Related Genes Associate with Fat Mass Changes in Response to Dietary Monounsaturated Fatty Acids in Adults with Abdominal Obesity
- PMID: 31291447
- PMCID: PMC7443768
- DOI: 10.1093/jn/nxz136
Common Variants in Lipid Metabolism-Related Genes Associate with Fat Mass Changes in Response to Dietary Monounsaturated Fatty Acids in Adults with Abdominal Obesity
Abstract
Background: Different fatty acids (FAs) can vary in their obesogenic effect, and genetic makeup can contribute to fat deposition in response to dietary FA composition. However, the antiobesogenic effects of the interactions between dietary MUFAs and genetics have scarcely been tested in intervention studies.
Objective: We evaluated the overall (primary outcome) and genetically modulated (secondary outcome) response in body weight and fat mass to different levels of MUFA consumption.
Methods: In the Canola Oil Multicenter Intervention Trial II, a randomized, crossover, isocaloric, controlled-feeding multicenter trial, 44 men and 71 women with a mean age of 44 y and an increased waist circumference (men ∼108 cm and women ∼102 cm) consumed each of 3 oils for 6 wk, separated by four 12-wk washout periods. Oils included 2 high-MUFA oils-conventional canola and high-oleic canola (<7% SFAs, >65% MUFAs)-and 1 low-MUFA/high-SFA oil blend (40.2% SFAs, 22.0% MUFAs). Body fat was measured using DXA. Five candidate single-nucleotide polymorphisms (SNPs) were genotyped using qualitative PCR. Data were analyzed using a repeated measures mixed model.
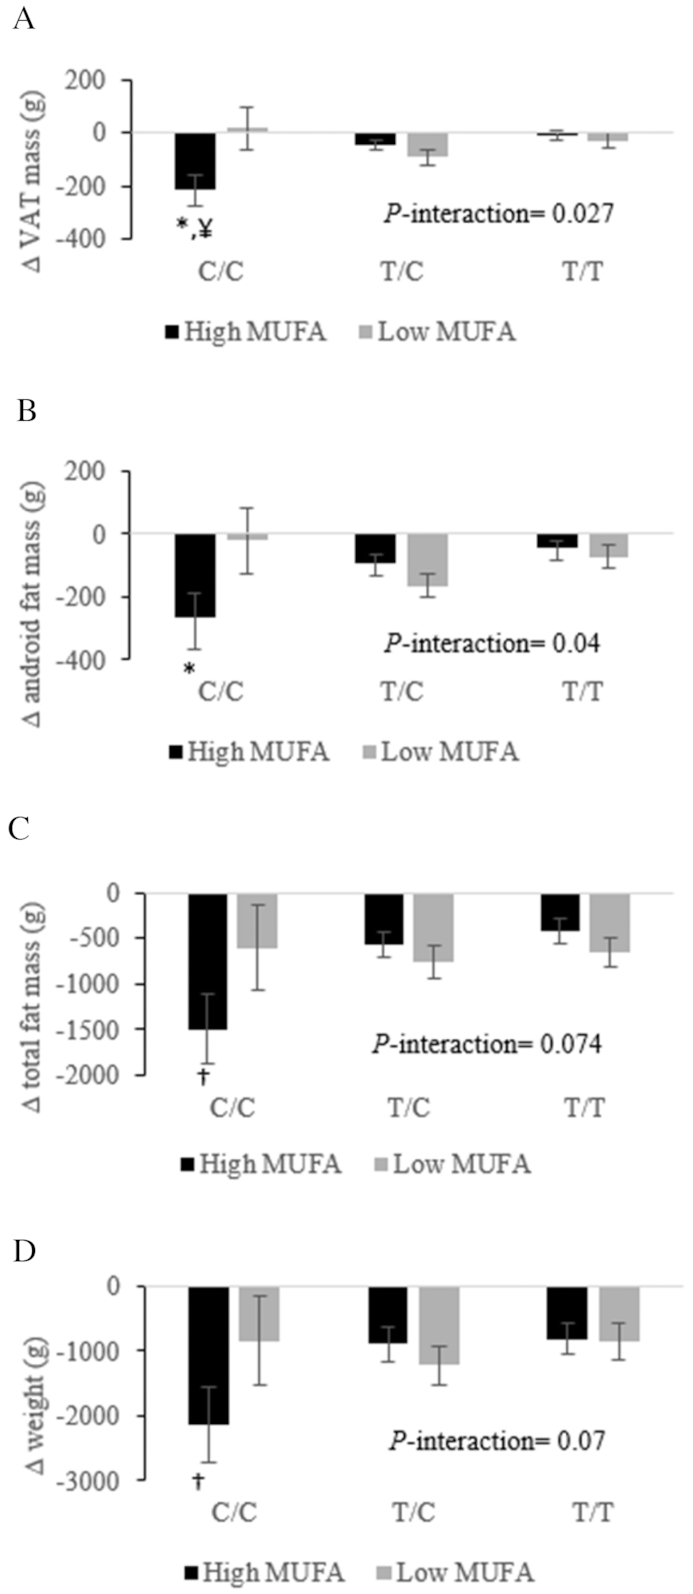
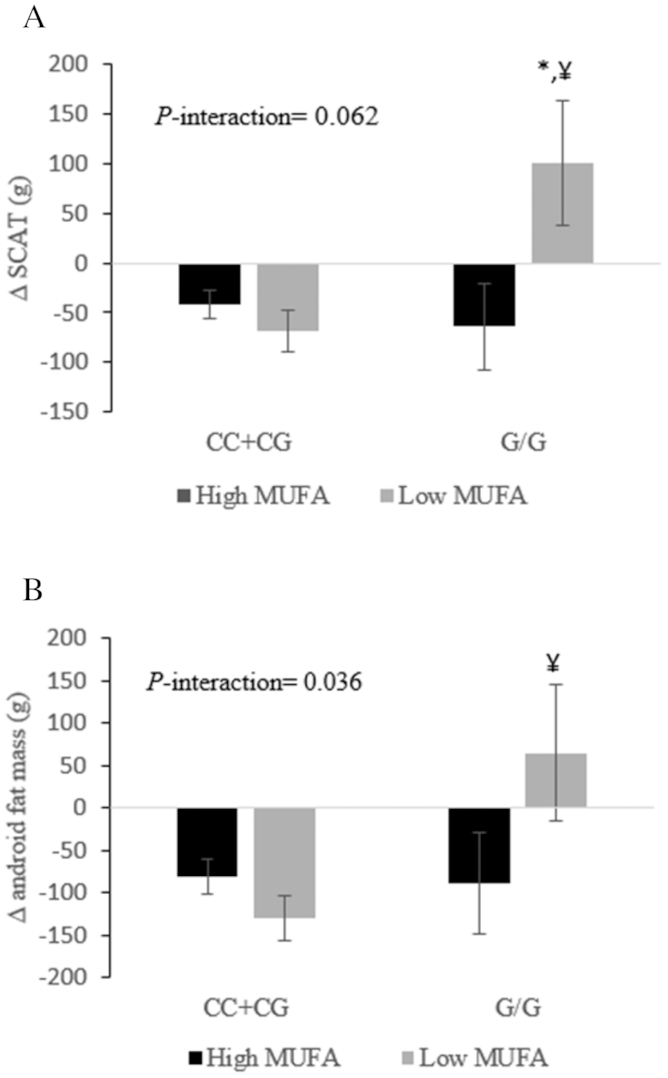
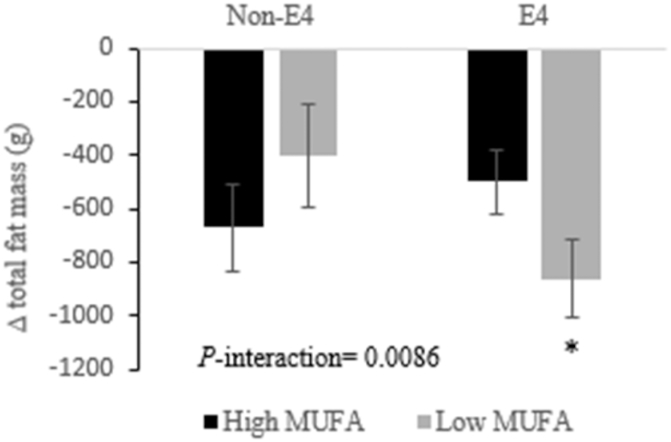
Results: No significant differences were observed in adiposity measures following the consumption of either high-MUFA diet compared with the low-MUFA/high-SFA treatment. However, when stratified by genotype, 3 SNPs within lipoprotein lipase (LPL), adiponectin, and apoE genes influenced, separately, fat mass changes in response to treatment (n = 101). Mainly, the LPL rs13702-CC genotype was associated with lower visceral fat (high-MUFA: -216.2 ± 58.6 g; low-MUFA: 17.2 ± 81.1 g; P = 0.017) and android fat mass (high-MUFA: -267.3 ± 76.4 g; low-MUFA: -21.7 ± 102.2 g; P = 0.037) following average consumption of the 2 high-MUFA diets.
Conclusions: Common variants in LPL, adiponectin, and apoE genes modulated body fat mass response to dietary MUFAs in an isocaloric diet in adults with abdominal obesity. These findings might eventually help in developing personalized dietary recommendations for weight control. The trial was registered at clinicaltrials.gov as NCT02029833 (https://www.clinicaltrials.gov/ct2/show/NCT02029833?cond=NCT02029833&rank=1).
Keywords: adiposity; dietary fatty acids; fat quality; fatness; gene–nutrient interaction; genotype.
Copyright © American Society for Nutrition 2019. All rights reserved.
Figures
References
-
- Alves RD, Moreira AP, Macedo VS, de Cassia Goncalves Alfenas R, Bressan J, Mattes R, Costa NM. Regular intake of high-oleic peanuts improves fat oxidation and body composition in overweight/obese men pursuing a energy-restricted diet. Obesity (Silver Spring). 2014;22:1422–9. - PubMed
-
- Summers LK, Fielding BA, Bradshaw HA, Ilic V, Beysen C, Clark ML, Moore NR, Frayn KN. Substituting dietary saturated fat with polyunsaturated fat changes abdominal fat distribution and improves insulin sensitivity. Diabetologia. 2002;45:369–77. - PubMed
-
- Mumme K, Stonehouse W.. Effects of medium-chain triglycerides on weight loss and body composition: a meta-analysis of randomized controlled trials. J Acad Nutr Diet. 2015;115:249–63. - PubMed
-
- Hammad SS, Jones PJ.. Dietary fatty acid composition modulates obesity and interacts with obesity-related genes. Lipids. 2017;52:803–22. - PubMed
Publication types
MeSH terms
Substances
Associated data
Grants and funding
LinkOut - more resources
Full Text Sources
Medical
Research Materials
Miscellaneous
