. 2019 Jul 9;28(2):352-367.e9.
doi: 10.1016/j.celrep.2019.06.037.

Three-Dimensional Genomic Structure and Cohesin Occupancy Correlate with Transcriptional Activity during Spermatogenesis

Affiliations

Three-Dimensional Genomic Structure and Cohesin Occupancy Correlate with Transcriptional Activity during Spermatogenesis

Covadonga Vara et al. Cell Rep. .

Abstract

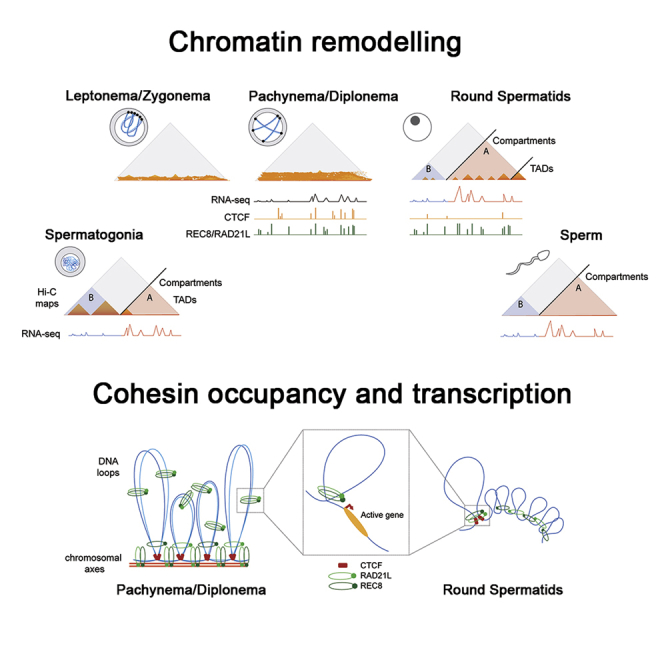
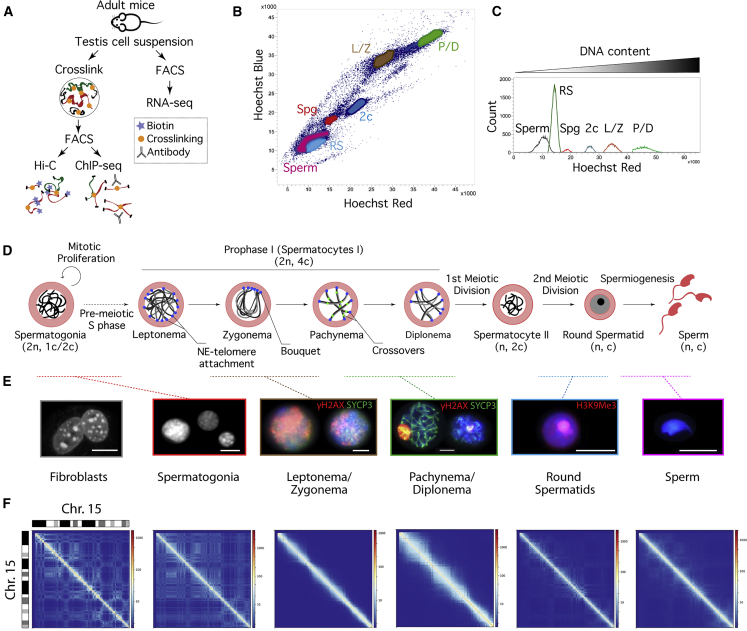
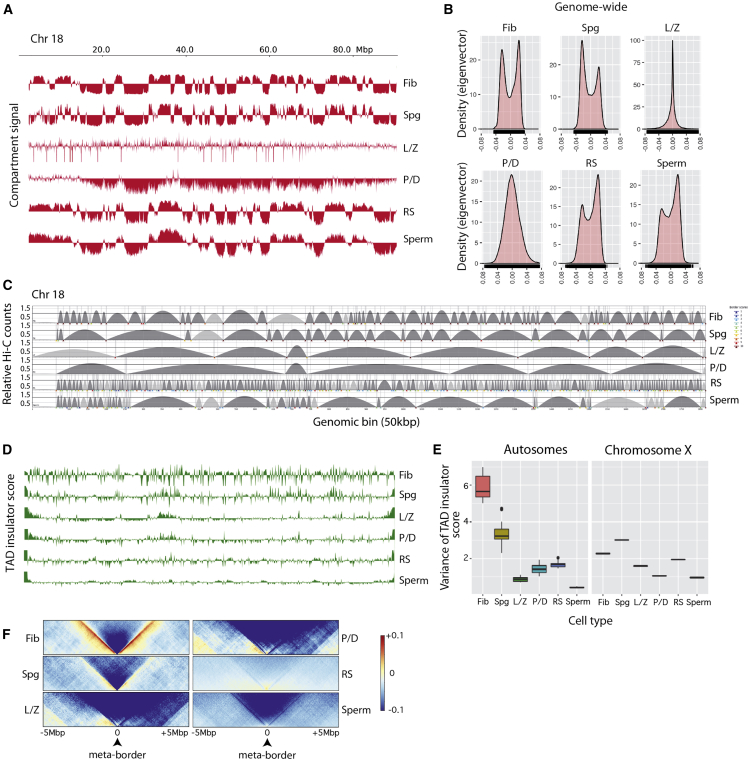
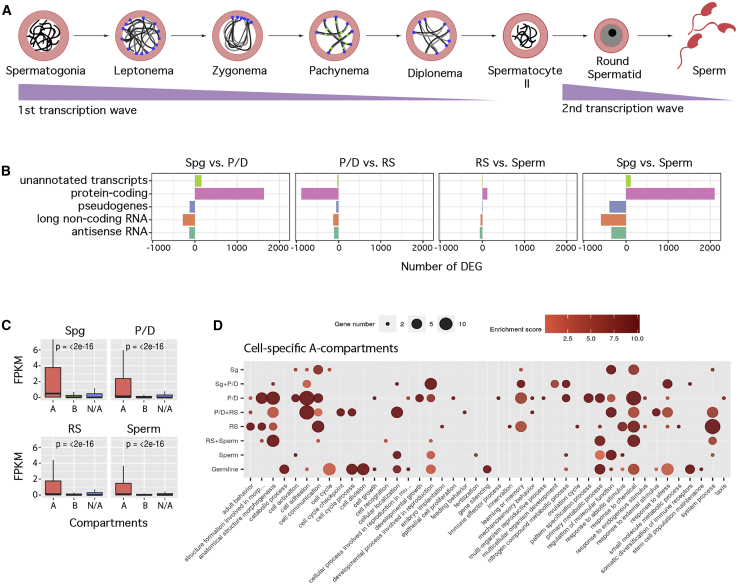
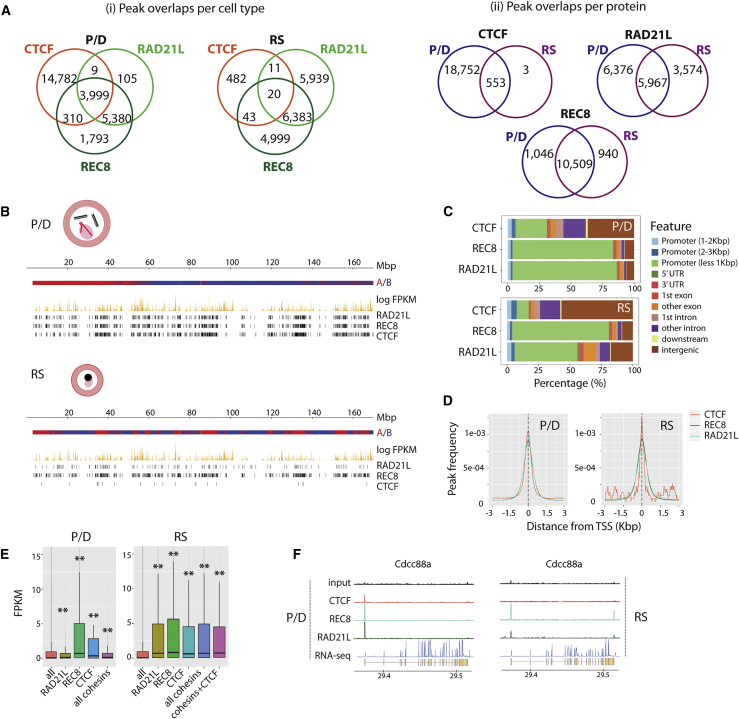
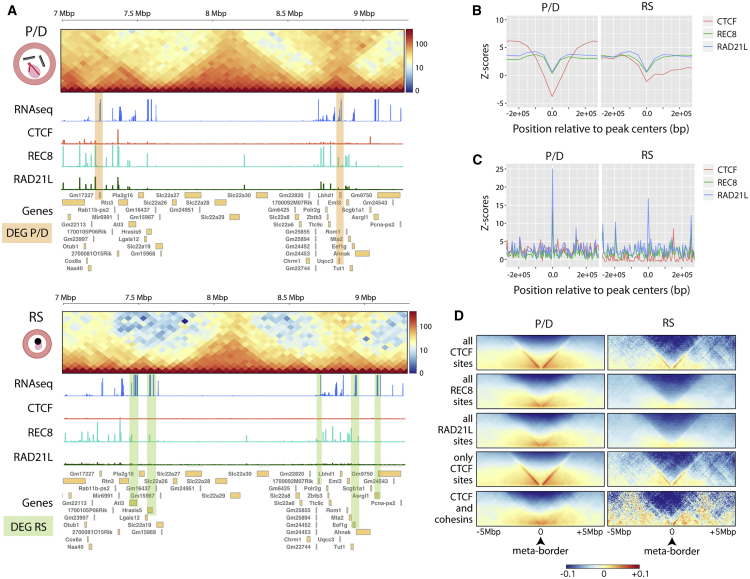
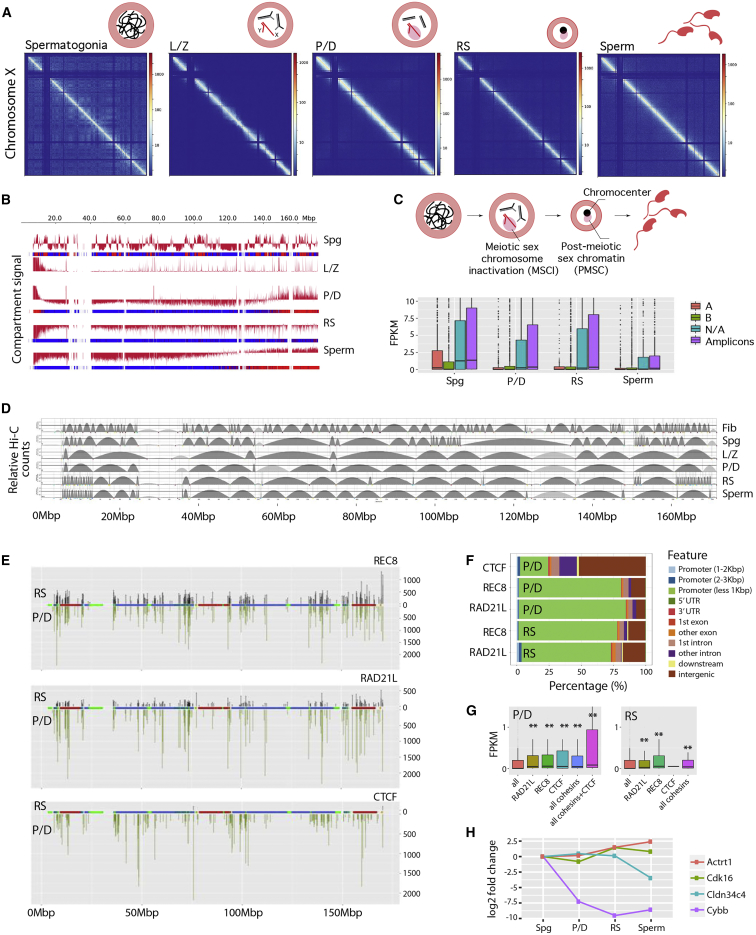
Mammalian gametogenesis involves dramatic and tightly regulated chromatin remodeling, whose regulatory pathways remain largely unexplored. Here, we generate a comprehensive high-resolution structural and functional atlas of mouse spermatogenesis by combining in situ chromosome conformation capture sequencing (Hi-C), RNA sequencing (RNA-seq), and chromatin immunoprecipitation sequencing (ChIP-seq) of CCCTC-binding factor (CTCF) and meiotic cohesins, coupled with confocal and super-resolution microscopy. Spermatogonia presents well-defined compartment patterns and topological domains. However, chromosome occupancy and compartmentalization are highly re-arranged during prophase I, with cohesins bound to active promoters in DNA loops out of the chromosomal axes. Compartment patterns re-emerge in round spermatids, where cohesin occupancy correlates with transcriptional activity of key developmental genes. The compact sperm genome contains compartments with actively transcribed genes but no fine-scale topological domains, concomitant with the presence of protamines. Overall, we demonstrate how genome-wide cohesin occupancy and transcriptional activity is associated with three-dimensional (3D) remodeling during spermatogenesis, ultimately reprogramming the genome for the next generation.


Conflict of interest statement

The authors declare no competing interests.

Figures

None
Graphical abstract
Figure 1
Figure 1
Higher-Order Chromatin Structure during Spermatogenesis (A) Experimental workflow: Hi-C, ChIP-seq, and RNA-seq on fluorescence-activated cell sorting (FACS)-enriched mouse germ cells. (B) Flow cytometry Hoechst Blue (UV355-460/50) and Hoechst Red (UV355-670/30) plot showing spermatogonia (Spg), leptonema-zygonema (L/Z), pachynema-diplonema (P/D), secondary spermatocytes (2c), round spermatids (RSs), and sperm. Recovered germ cell fractions presented the following average enrichment: 91% for Spg, 88.7% for L/Z, 89.2% for P/D, 92.9% for RS, and 90% for sperm. (C) Histogram of the differential DNA content showing cell events for each FACS-isolated germ cell population (Hoechst Red, UV355-670/30). (D) Overview of the spermatogenesis process (adapted from Reig-Viader et al., 2016). Numbers between parentheses indicate the diploid (2n) haploid (n) number for each cell type and the number of chromatids per chromosome (4c, 2c, or c). (E) Representative immunofluorescence images showing DAPI-stained DNA (gray/blue) and specific meiotic proteins for the different cell populations included in the present study. Fibroblasts and Spg have DAPI-stained DNA in gray. For L/Z and P/D, DAPI is shown in blue, SYCP3 in green, and γH2AX in red. The image represents a mosaic of two individual captured cells. In RSs, DAPI is blue, and H3K9me3 (marker for the constitutive heterochromatin at centromeres- chromocenters) is red. Scale bars, 10 um. (F) Iterative correction and eigenvector decomposition (ICE)-corrected Hi-C matrices for chromosome 15 at a 50-kbp resolution for the cell types analyzed. Deep blue lines indicate non-mapped bins. See also Figure S1.
Figure 2
Figure 2
Chromosomal Organization in Interphase, Pre-meiotic, Meiotic, and Post-meiotic Cells (A) Genome-wide ICE-corrected heatmaps at 500 kbp for the cell types analyzed. (B) Chromosome 18 region-specific ICE-corrected heatmaps at 50 kbp (from 20 Mbp to 60 Mbp), depicting compartment signal (first eigenvector) for all cell types. (C) Contact probability P(s) as a function of genomic distance in all cell types for autosomes (left panel) and the X chromosome (right panel). Discontinuous straight lines correspond to the fractal (green) and equilibrium (red) models (Lieberman-Aiden et al., 2009). Gray-shadowed area expands the genomic region from 0.5 to 7 Mbp. (D) Inter- and intra-chromosomal interaction ratios for each chromosome and cell type. Correlation values (∗∗p < 0.001) between the inter- and intra-chromosomal ratio and chromosomal size (autosomes only) are shown for each cell type. (E) Heatmaps showing normalized inter-chromosomal interactions between chromosomes 1 and 2 in all cell types. Red circles represent high-contact regions. (F) Left panel: boxplots depicting inter-chromosomal interactions per million at sub-centromeric regions (from the centromere up to 3.5 Mbp) for all cell types (Wilcoxon test, ∗∗∗∗ < 0.0001; n.s., not statistically significant when compared to fibroblasts). Right panel: schematic representation of chromosomes and centromeres and telomeres in L/Z, P/D, RSs, and sperm. Dots represent centromeres (pink) and telomeres (green). In RSs and sperm, all centromeres associate in the center of the cell forming the chromocenter. Fib, fibroblast; Spg, spermatogonia; L/Z, leptonema-zygonema; P/D, pachynema-diplonema; RS, round spermatids; cen, centromeres of acrocentric chromosomes; tel, telomeres of non-centromeric ends. See also Figures S2–S5.
Figure 3
Figure 3
Chromosome-specific A-B Compartment Profiles and TAD Signals (A) Compartment signal (first eigenvector) across chromosome 18. (B) Density plots of eigenvector values considering autosomes. (C) TAD border alignments along chromosome 18. Dark gray arches represent TADs with higher intra-TAD interactions than expected. TAD border robustness (from 1 to 10) is represented by a color gradient. (D) Representation of TAD insulator score in mouse chromosome 18. (E) Variance of the TAD insulation scores for autosomes (left panel) and the X chromosome (right panel). (F) Meta-plots for all TAD boundaries detected in fibroblasts (n = 2002), Spg (n = 834), L/Z (n = 305), P/D (n = 294), RSs (n = 4649), and sperm (n = 1042). Fib, fibroblast; Spg, spermatogonia; L/Z, leptonema-zygonema; P/D, pachynema-diplonema; SpII, spermatocytes II; RS, round spermatids. See also Figures S3–S5.
Figure 4
Figure 4
Dynamics of Gene Expression during Gametogenesis (A) Two extensive waves of transcription take place during spermatogenesis. (B) Differentially expressed genes (DEGs) for each pairwise comparison, including known nuclear protein-coding RNA (RefSeq), long noncoding RNA, antisense RNA, processed transcripts, and mitochondrial nuclear protein-coding RNA. (C) Boxplots representing genome-wide expression (as fragments per kilobase of transcript per million mapped reads [FPKM] values) according to A-B compartment assignment (N/A, not assigned compartments). (D) Gene Ontology (GO) analysis of expressed genes in cell-specific A compartments. Bubble size represents the number of genes assigned to each GO. Only GO terms with two or more genes are represented. Spg, spermatogonia; P/D, pachynema-diplonema; RS, round spermatids.
Figure 5
Figure 5
CTCF and Cohesin Profiles in Primary Spermatocytes and RSs (A) Venn diagrams for CTCF and cohesins in P/D and RSs considering peak overlaps per cell type and peak overlaps per protein. (B) Representative examples of CTCF and cohesins’ genomic distribution along chromosome 1 in P/D and RSs. For each cell type, A-B compartments, gene expression (represented as log FPKM), CTCF peaks, and cohesin peaks are displayed. (C) Genome-wide distribution of CTCF and cohesin-occupied sites in relation to TSSs and other genomic features in P/D and RSs. (D) Insulator peak frequencies relative to TSSs of genes in P/D and RSs. (E) Boxplots representing expression (FPKM values) of genes with CTCF and cohesin peaks located at the TSS. Asterisks represent statistically significant differential gene expression when compared with all genes in the mouse genome (p < 0.01). (F) Examples of CTCF and cohesion-occupied sites in P/D and RSs for the expressed gene Cdc88a. See also Figure S6.
Figure 6
Figure 6
Local Insulation, Cohesin Occupancy, and Gene Expression (A) Representative examples of CTCF and cohesins’ genomic distributions across a specific region of chromosome 19 (from 7 to 9.3 Mbp) in P/D and RSs. For each cell type, Hi-C interaction maps (50-Kbp bins), gene expression (represented as log FPKM), CTCF peaks, cohesin peaks, and genes from NCBI Ref Seq annotation are displayed. Green and orange highlights indicate differentially expressed genes (DEGs) in each cell type: Gm17227 and Uqcc3 for P/D and Atl3; Hrasls5, 1700092M07Rik, Eef1g, and Asrgl1 for RSs. (B) Distribution of CTCF and cohesin peaks at TAD borders. The y axes represent the TAD insulation Z-score relative to random genomic regions (based on 10,000 permutation tests with randomization, p < 0.01). (C) Distribution of gene expression for CTCF and cohesin peaks located at TAD borders. The y axes represent the TAD insulation Z-score relative to random genomic regions (based on 10,000 permutation tests with randomization, p < 0.01). (D) Meta-plots for all peaks detected in P/D and RSs. P/D, pachynema-diplonema; RS, round spermatids. See also Figure S6.
Figure 7
Figure 7
Higher-Order Chromatin Structure and Gene Expression in the X Chromosome (A) ICE-corrected Hi-C matrices for the X chromosome in mouse germ cells, at a 50-Kbp resolution. Plaid blue regions correspond to non-mapped bins. (B) Representation of compartment signal (first eigenvector) along the mouse’s X chromosome. (C) Upper panel: Overview of spermatogenesis with two pairs of autosomes (black and gray lines) and the sex chromosomes (X and Y as red lines). Meiotic sex chromosome inactivation (MSCI) characterizes prophase I (shown as a pink cloud; also known as the sex body). In RSs, all centromeres associate in the center of the cell forming the chromocenter, with the X adjacent, forming the post-meiotic sex chromatin (PMSC). Lower panel: Boxplots of expression (FPKM values) of X genes binned according to A-B compartment or ampliconic. N/A are not assigned to a compartment or amplicon. (D) X chromosome TAD alignments. Arches represent TADs with higher (darker gray) and lower (lighter gray) than expected intra-TAD interactions. (E) CTCF and cohesin distribution on the X in P/D (green) and RSs (black). Ampliconic regions are green, and evolutionary strata are displayed, with blue representing older strata and red representing newer strata (see Figure S7 for further details). (F) X chromosome distribution of CTCF and cohesins’ occupancy relative to TSSs and other genomic features in P/D and RS. (G) Expression (FPKM values) of genes with CTCF and cohesin peaks located at promoter regions (−2 kbp from TSS). Asterisks represent statistically significant differential gene expression when compared with all genes in the mouse genome (p < 0.01). Boxes represent first and third quartiles, whereas black bars in boxes represent the median values. (H) Expression changes (versus Spg) of representative X genes that reduce expression in P/D and maintain low levels during spermatogenesis (e.g., Cybb), genes that reduce expression in P/D and increase in RSs and sperm (i.e., Cdk16), genes that increase expression in RSs (e.g., Actr1), and genes that increase expression in P/D and then reduce (i.e., Cldn34c4). Fib, fibroblast; Spg, spermatogonia; L/Z, leptonema-zygonema; P/D, pachynema-diplonema; RS, round spermatids. See also Figure S7.

References

    1. Alavattam K.G., Maezawa S., Sakashita A., Khoury H., Barski A., Kaplan N., Namekawa S.H. Attenuated chromatin compartmentalization in meiosis and its maturation in sperm development. Nat. Struct. Mol. Biol. 2019;26:175–184. - PMC - PubMed
    1. Bannister L.A., Reinholdt L.G., Munroe R.J., Schimenti J.C. Positional cloning and characterization of mouse mei8, a disrupted allelle of the meiotic cohesin Rec8. Genesis. 2004;40:184–194. - PubMed
    1. Barral S., Morozumi Y., Tanaka H., Montellier E., Govin J., de Dieuleveult M., Charbonnier G., Couté Y., Puthier D., Buchou T. Histone Variant H2A.L.2 Guides Transition Protein-Dependent Protamine Assembly in Male Germ Cells. Mol. Cell. 2017;66:89–101.e8. - PubMed
    1. Brick K., Smagulova F., Khil P., Camerini-Otero R.D., Petukhova G.V. Genetic recombination is directed away from functional genomic elements in mice. Nature. 2012;485:642–645. - PMC - PubMed
    1. Bushnell B. Department of Energy; 2014. BBMap: A Fast, Accurate, Splice-Aware Aligner. Joint Genome Institute.

Publication types

Substances