. 2019 Jul 9;28(2):526-540.e6.
doi: 10.1016/j.celrep.2019.06.040.

Defining a Spinal Microcircuit that Gates Myelinated Afferent Input: Implications for Tactile Allodynia

Affiliations

Defining a Spinal Microcircuit that Gates Myelinated Afferent Input: Implications for Tactile Allodynia

Kieran A Boyle et al. Cell Rep. .

Abstract

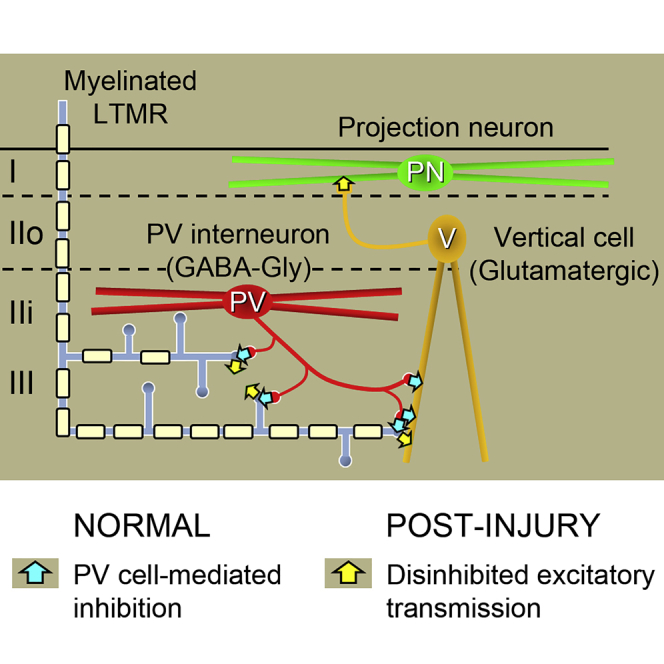
Chronic pain presents a major unmet clinical problem. The development of more effective treatments is hindered by our limited understanding of the neuronal circuits underlying sensory perception. Here, we show that parvalbumin (PV)-expressing dorsal horn interneurons modulate the passage of sensory information conveyed by low-threshold mechanoreceptors (LTMRs) directly via presynaptic inhibition and also gate the polysynaptic relay of LTMR input to pain circuits by inhibiting lamina II excitatory interneurons whose axons project into lamina I. We show changes in the functional properties of these PV interneurons following peripheral nerve injury and that silencing these cells unmasks a circuit that allows innocuous touch inputs to activate pain circuits by increasing network activity in laminae I-IV. Such changes are likely to result in the development of tactile allodynia and could be targeted for more effective treatment of mechanical pain.

Keywords: LTMRs; allodynia; dorsal horn; interneurons; parvalbumin; presynaptic inhibition; touch.


Conflict of interest statement

The authors declare no competing interests.

Figures

None
Graphical abstract
Figure 1
Figure 1
PV Cells in Laminae IIi and III Are a Source of Axoaxonic Contacts onto Myelinated Afferents (A) The expression of tdTom (PVCre;Ai9; red) in the spinal dorsal horn of the PVCre;Ai9 mouse mirrors the distribution of PV-immunoreactive cells. (B and C) All tdTom cells displayed either tonic firing or initial bursting AP discharge patterns in response to current injection (B, upper traces), as well as a high incidence of the Ih subthreshold current and associated voltage sag (B, lower traces). Numbers at the base of bars in (C) are the number of cells in each category. (D) NB labeling of recorded neurons shows that most cells displayed islet or central-cell-like morphology (82.3%; 14/17), with the remaining cells being of unclassified morphology. R-C denotes orientation of the rostrocaudal axis. (E) Demonstration of tdTom expression (red) in the cell body of the NB-filled islet cell shown in (D) (NB, green). (F) Several axon terminals in lamina IIi and III derived from this cell (green) contact boutons labeled with VGLUT1 (blue). (G) Table summarizing the incidence of NB-labeled boutons from morphologically defined tdTom-expressing cells in contact with VGLUT1-immunoreactive terminals. Scale bars represent 100 μm (A and D), 25 μm (E), and 5 μm (F).
Figure 2
Figure 2
Axoaxonic Contacts from PV Interneurons Target the Central Terminals of Several Classes of Myelinated Afferents (A) The central terminals of Aβ-hair afferents (labeled in the SplitCre; Ai34 mouse), Aδ-hair afferents (labeled in the TrkBCreER; Ai35 mouse), myelinated glabrous skin afferents (labeled with CTb), and C-LTMRs (labeled with antibodies to VGLUT3) each display distinctive patterns of arborization (green). (B) The central terminals of myelinated LTMRs overlap extensively with PV cells (red) in laminae IIi and III, whereas C-LTMRs only overlap with the more dorsal aspect of the PV plexus. (C) The central terminals of all classes of LTMRs receive multiple contacts from VGAT boutons (blue); however, only myelinated LTMRs receive extensive input from inhibitory PV terminals (double arrowheads). (D and E) The mean number of VGAT terminals (D) and PV-VGAT terminals (E), respectively, in contact with each class of LTMR afferent. (F and G) The mean percentage of axoaxonic contacts on to each class of afferent that are derived from PV cells (F) and of terminals from each afferent class that have at least one contact from a PV-VGAT bouton (G), respectively. Bars in graphs show means across all animals, and individual points are means of each animal (n = 3 animals per afferent group; 150 terminals analyzed per animal). Scale bars represent 100 μm (A), 20 μm (B), and 2 μm (C).
Figure 3
Figure 3
Myelinated Hair Afferents Are a Principal Source of Afferent Input to Inhibitory PV Cells in Laminae IIi and III (A and B) Representative examples of inhibitory PV cells in tissue from SplitCre; Ai34 (A) or TrkBCreER; Ai35 (B) mice. Higher magnification insets show the presence of Pax2-immunolabelling (gray) in the nuclei of these cells. (C and D) Reconstructions of the individual inhibitory PV interneurons shown in (A) and (B), respectively, showing the relative positions of contacts from VGLUT1-only (blue diamonds) and Aβ- (C) or Aδ-hair (D) afferent terminals (magenta circles) plotted onto their cell body and dendrites. (E and F) Examples of dendrites from these PV-expressing inhibitory interneurons receiving multiple contacts from axon terminals that either express only VGLUT1 (blue, arrows), tdTom-labeled boutons of Aβ-hair afferents (red; arrowheads in E) derived from SplitCre;Ai34 mice, or YFP-expressing Aδ-hair afferents (green; double arrowheads in F) from TrkBCreER;Ai35 mice. (G) Mean number of contacts from Aβ- and Aδ-hair afferent terminals per inhibitory PV soma. (H) Mean number of contacts from Aβ- and Aδ-hair afferent terminals per 100 μm of dendrite of inhibitory PV interneurons. (I) Relative proportion of all VGLUT1 terminals contacting the soma and dendrites of inhibitory PV cells that are derived from Aβ- and Aδ-hair afferents. Bars in (G)–(I) show means across all animals, and individual points show the means of each animal. n = 3 mice per afferent class, with three or four inhibitory PV cells analyzed per mouse. Scale bars represent 25 μm (A and B), 100 μm (C and D), and 5 μm (E and F).
Figure 4
Figure 4
PV Interneurons Are a Source of Inhibitory Inputs to the Dendrites of Vertical Cells and Axoaxonic Contacts to Myelinated Afferents Contacting Those Vertical Cells (A) An example of the characteristic morphology and physiology of vertical cells filled with NB (green) and analyzed in this study. These cells have their cell body in lamina IIo, and most of their dendritic arbor extends into deeper dorsal horn laminae. Only vertical cells that showed delayed- or gap-firing AP discharge patterns in response to current injection (inset) and with axon arborizing in lamina I (arrows) were included in this analysis. R-C denotes orientation of the rostrocaudal axis. (B and C) We assessed the incidence of contacts from VGAT axon terminals (blue) on to vertical cell dendrites in laminae IIi and III (green). In these laminae, the dendrites of vertical cells receive multiple contacts from both VGLUT1 axon terminals (gray, asterisk in C) and VGAT-IR boutons (blue; arrowhead in B). Many of the VGAT boutons are derived from PV cells (red; double arrowheads in B and C), and these inhibitory PV boutons often appose VGLUT1 axon terminals (gray, asterisk in C) that contact the same vertical cell and potentially form triadic synaptic arrangements. Scale bars represent 20 μm (A), 5 μm (B, D, and E), and 50 μm (C).
Figure 5
Figure 5
PV Cells in PVCre;Ai32 Mice Mediate Both Light-Evoked Presynaptic and Postsynaptic Inhibition (A) Schematic showing the recording setup. (B) PV-photostimulation-evoked oEPSCs (left) that were reduced and/or abolished at an elevated temperature (right; n = 15; 4 mice) as highlighted by group data plots. (C) PV-photostimulation-evoked oEPSCs (left) were abolished by a conditioning stimulus to fatigue primary afferent synapses (right, 1 s DR stimulation at 20 Hz) as highlighted by the group data plot (n = 18; 8 mice). (D) DR-eEPSC amplitude (left) is reduced after a conditioning photostimulation of PV cells (1 s photostimulation at 20 Hz) to fatigue the presynaptic inhibitory synapse (right). This effect was limited to cells that exhibited an oEPSC (left plot; n = 16; 8 mice), but not in cells where no oEPSC was observed (right plot; n = 6; 5 mice). (E) DR-eEPSCs recorded before (black trace) and after (red traces) preconditioning PV cell photostimulation delivered at varying intervals (1-ms pulse, −20 ms to −500 ms). DR-eEPSC amplitude is diminished at short preconditioning intervals (−20 ms to −100 ms) but approximates the baseline response in the preconditioning −500-ms trial. Data were fitted with a Boltzmann function, yielding a half recovery time of 62.5 ms (right; n = at least 5 for each time point; 2 mice). (F) Morphology of a recorded vertical cell (gray), filled with NB. Insets show examples of YFP-expressing PV terminals (green) making excitatory (Homer; gray) and inhibitory synapses (gephyrin; gray) on to the dendrites of the recorded cell (arrows). R-C denotes rostrocaudal axis orientation. Recorded vertical cell displayed delayed AP discharge during depolarizing current step injections (left; lower, 20-pA steps), and A-type potassium currents during a voltage step protocol (right; −100 mV to −40, −30, and −20 mV, respectively). (G and H) Representative PV-photostimulation evoked oIPSCs (G; strychnine and bicuculline sensitive) and oEPSCs (H; bicuculline sensitive) recorded from vertical cells (n = 5; 4 mice). (I) Plots show oIPSC latency and jitter are low, consistent with a monosynaptic connection, whereas longer latency and higher jitter for oEPSCs are consistent with a polysynaptic circuit. p < 0.05 by paired t test. Scale bars represent 50 μm (D) and 2 μm (insets).
Figure 6
Figure 6
Anatomical and Electrophysiological Features of PV Cells in Allodynic Mice (A) PVCre;Ai9 mice that have undergone unilateral SNI (n = 11) develop pronounced punctate tactile allodynia in the skin region innervated by the sural nerve during the first postoperative week, which persists throughout the test period (∗∗∗∗p < 0.0001 for contralateral versus ipsilateral at all post-surgery time points, two-way ANOVA with Sidak’s post-test of multiple comparisons). (B) CTb was injected into the glabrous skin region innervated by the sural nerve (ipsilateral to the nerve injury) to label the myelinated afferents that evoke the tactile allodynia (n = 3 animals). The central terminals of these afferents (green) overlap extensively with the plexus of tdTom-expressing PV cells (red) in laminae IIi and III, and receive multiple contacts from VGAT boutons (blue), many of which are derived from PV cells (arrow). (C) Targeted whole-cell patch-clamp recordings from tdTom cells (red) were made in spinal cord slices both ipsilateral (n = 20) and contralateral (n = 16) to the nerve injury and within the central territories of the tibial and common peroneal nerves. NB (green) was included in the recording electrode for post hoc confirmation of tdTom expression in recorded cells. (D) Plot of the relative positions of all cells recorded from the contra- and ipsilateral sides. (E) The incidence of AP firing patterns in tdTom cells is similar on both the contra- and ipsilateral sides, with the exception of two single-spiking neurons that are seen ipsilateral to the nerve injury. Numbers at the base of bars are number of cells in each category. (F) The tonic rheobase is significantly higher in tdTom neurons ipsilateral to nerve injury (p < 0.05 by unpaired Student’s t test; bars in graph are means from all cells, and individual data points from each cell are overlaid; n = 14 cells contralateral, 15 ipsilateral). (G) Example traces of AP output in response to current injection from tonic-firing cells on the contra- and ipsilateral sides. (H) Input and/or output relationship of tonic-firing tdTom neurons, demonstrating a significantly reduced firing frequency in response to 100 and 120pA current injection on the ipsilateral side (p < 0.05 by two-way ANOVA with Sidak’s post-test of multiple comparisons; data are shown as mean ± SEM; n = 14 cells contralateral, 15 ipsilateral). Scale bars represent 100 μm (B and C); insets, 10 and 2 μm, respectively.
Figure 7
Figure 7
Silencing PV Interneurons with AAV.flex.TeLC Results in Increased Network Activity in Laminae I–IV following Innocuous Tactile Stimulation (A–D) Plots of the distribution of cFOS-labeled cells in laminae I–IV following brush and punctate stimulation of hairy and glabrous skin over the hindpaw and lower limb of PVCre mice that had undergone unilateral intraspinal injections of AAV.flex.TeLC (TeLC; A) or AAV.flex.GFP (B) into lumbar segments L3–L5, naive PVCre mice (C) that had undergone the same hindpaw stimulation, and naive PVCre mice not subjected to the hindpaw stimulation protocol (D). The location of individual cFOS cells in representative sections from each experimental group is depicted, with cells in each lamina denoted by colored circles: lamina I (dark green); IIo (red), IIi (bright green); III and IV (blue). (E) Representative section from a TeLC-treated mouse following the stimulation protocol. Cells are widely distributed across the dorsal horn, with a high incidence of cells in superficial laminae. (F and G) The incidence of cFOS cells is significantly higher in TeLC animals (red) than in any of the control groups, both in the superficial (F) and deeper laminae (G). The incidence of cFOS labeling in control animals did not differ significantly between groups (n.s., p > 0.05; ∗∗p < 0.01; one-way ANOVA with Tukey’s post-test of multiple comparisons). Scale bars represent 187 μm (A–D), 100 μm (E), and 50 μm (F).

References

    1. Abraira V.E., Ginty D.D. The sensory neurons of touch. Neuron. 2013;79:618–639. - PMC - PubMed
    1. Abraira V.E., Kuehn E.D., Chirila A.M., Springel M.W., Toliver A.A., Zimmerman A.L., Orefice L.L., Boyle K.A., Bai L., Song B.J. The cellular and synaptic architecture of the mechanosensory dorsal horn. Cell. 2017;168:295–310.e19. - PMC - PubMed
    1. Ahmadi S., Lippross S., Neuhuber W.L., Zeilhofer H.U. PGE(2) selectively blocks inhibitory glycinergic neurotransmission onto rat superficial dorsal horn neurons. Nat. Neurosci. 2002;5:34–40. - PubMed
    1. Baba H., Ji R.-R., Kohno T., Moore K.A., Ataka T., Wakai A., Okamoto M., Woolf C.J. Removal of GABAergic inhibition facilitates polysynaptic A fiber-mediated excitatory transmission to the superficial spinal dorsal horn. Mol. Cell. Neurosci. 2003;24:818–830. - PubMed
    1. Bailey A.L., Ribeiro-da-Silva A. Transient loss of terminals from non-peptidergic nociceptive fibers in the substantia gelatinosa of spinal cord following chronic constriction injury of the sciatic nerve. Neuroscience. 2006;138:675–690. - PubMed

Publication types

LinkOut - more resources