. 2019 Jul 9;28(2):567-579.e4.
doi: 10.1016/j.celrep.2019.06.023.

Cryo-EM Studies of TMEM16F Calcium-Activated Ion Channel Suggest Features Important for Lipid Scrambling

Affiliations

Cryo-EM Studies of TMEM16F Calcium-Activated Ion Channel Suggest Features Important for Lipid Scrambling

Shengjie Feng et al. Cell Rep. .

Erratum in

Abstract

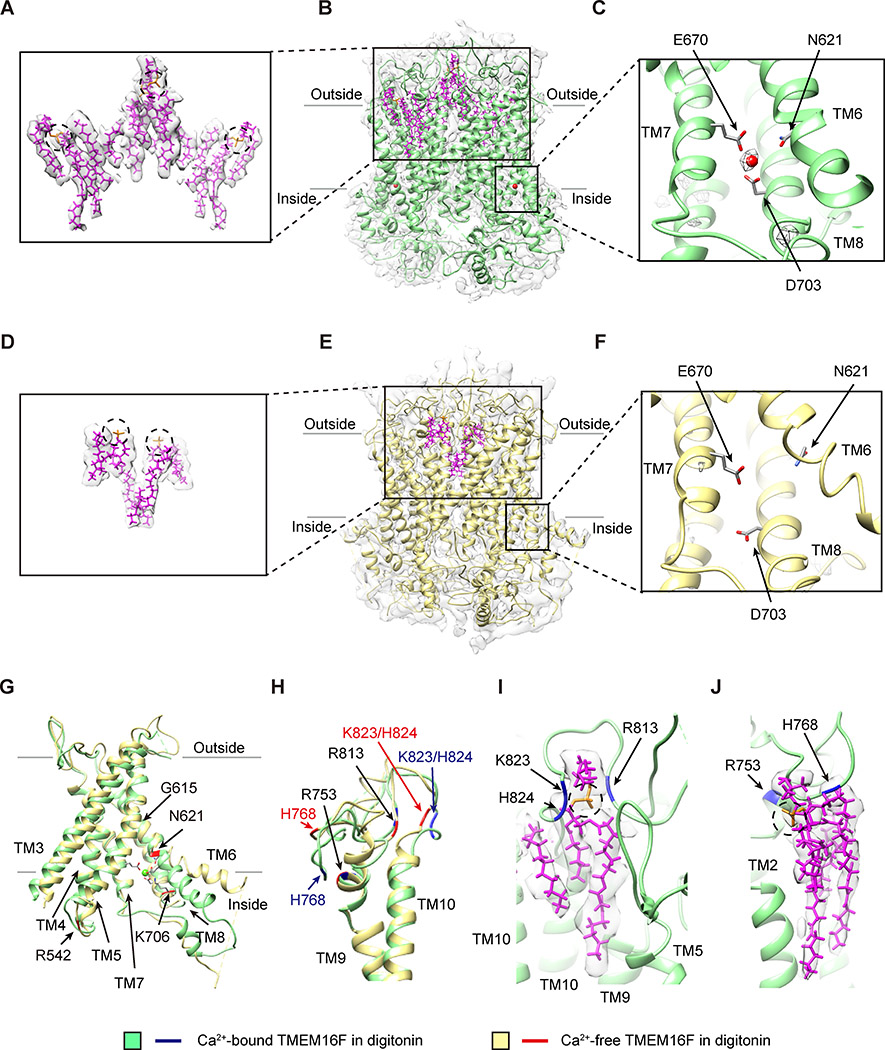
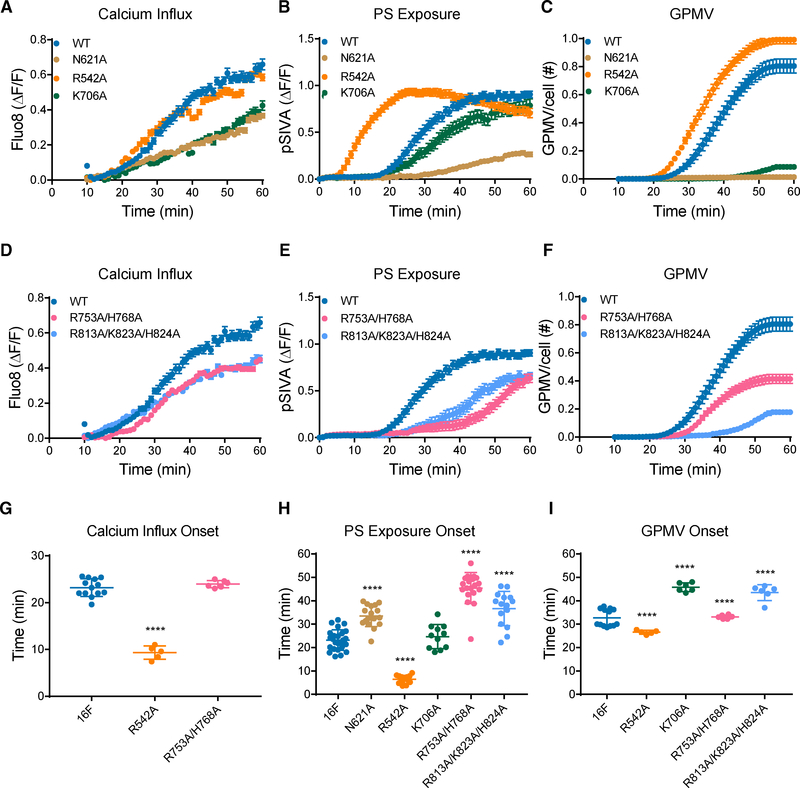
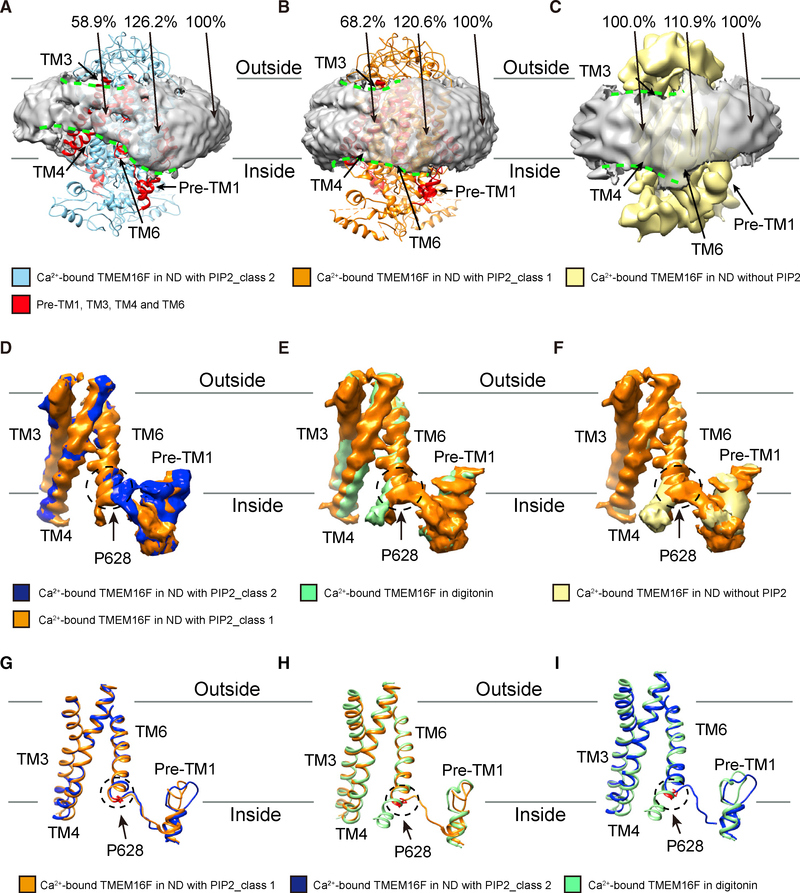
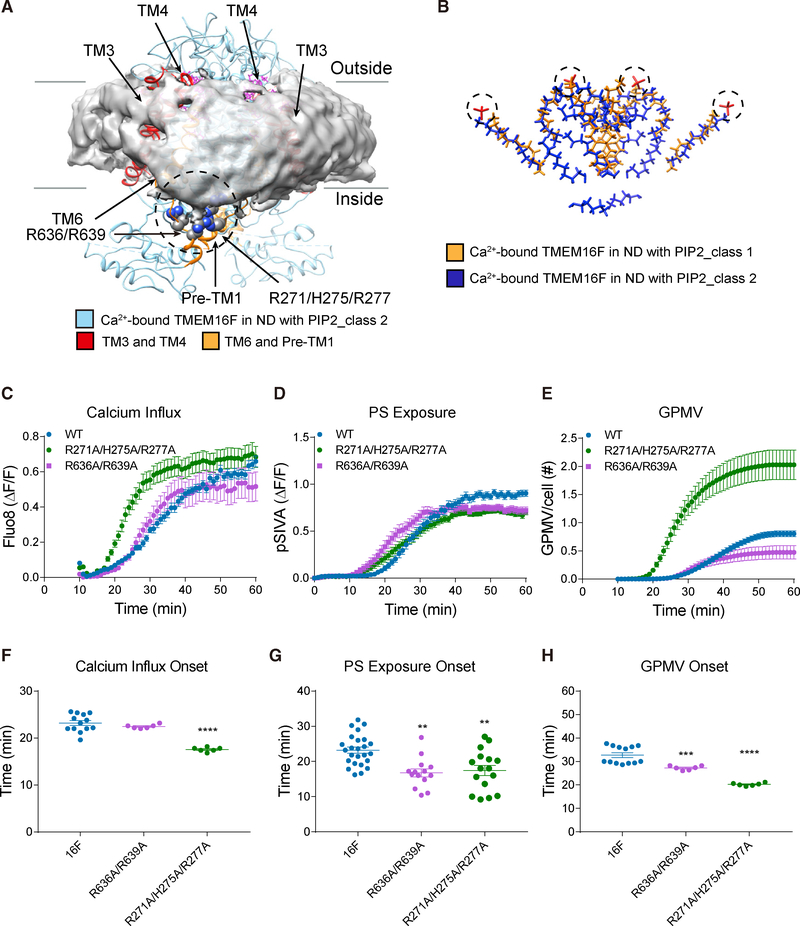
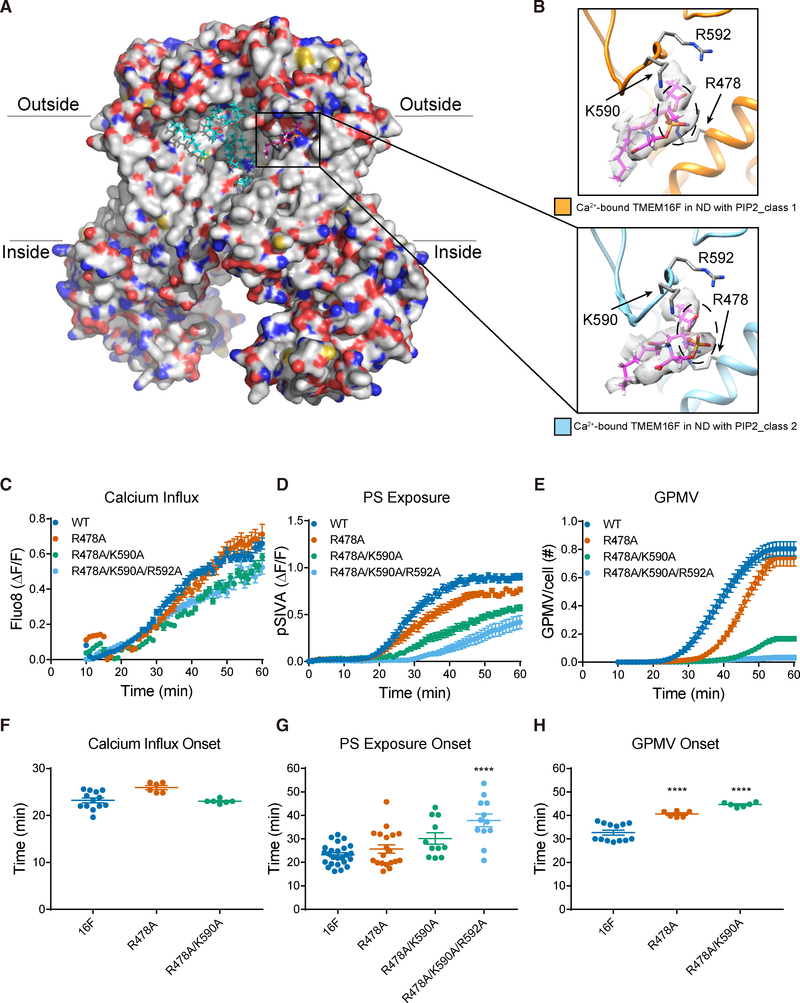
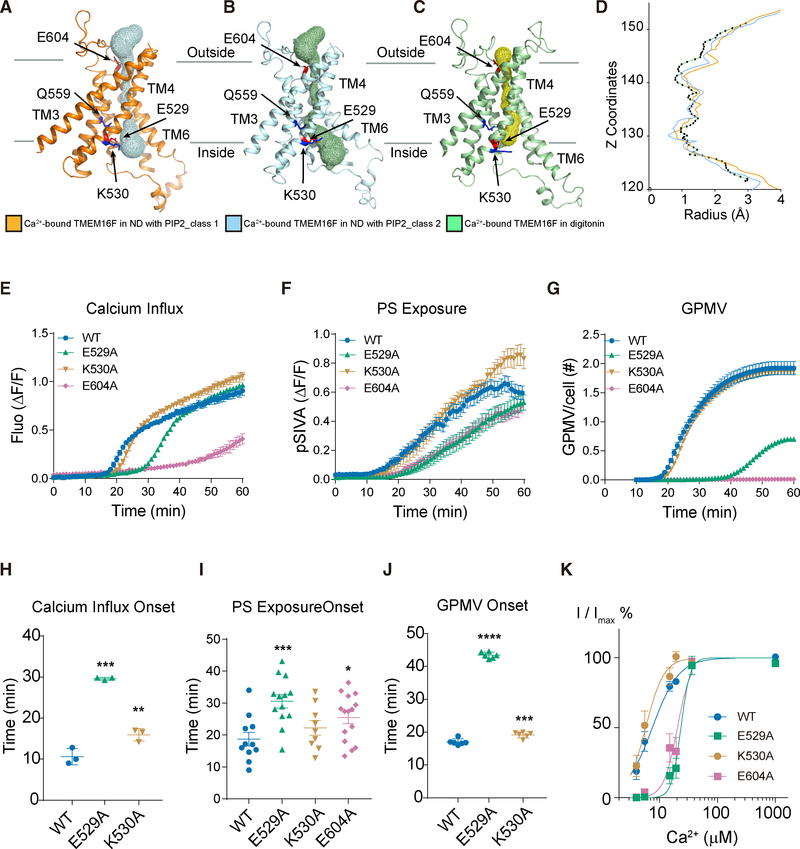
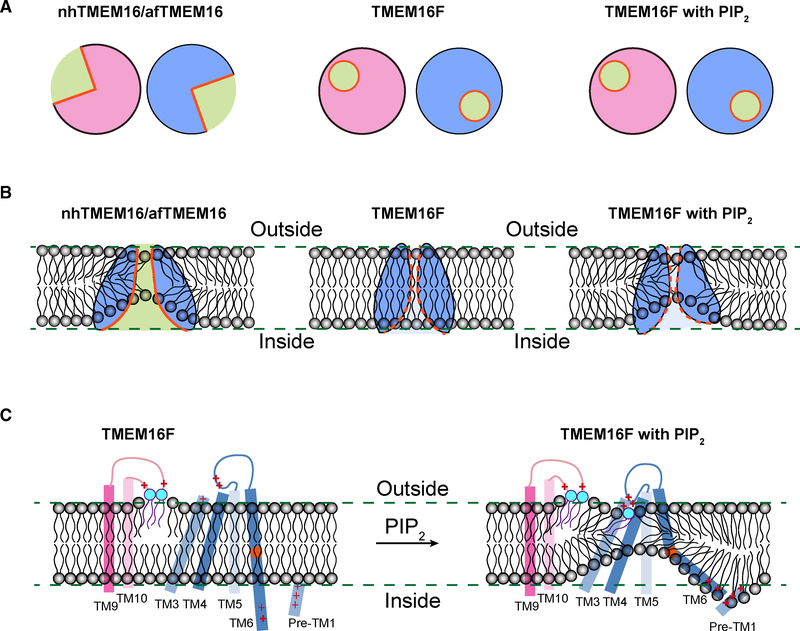
As a Ca2+-activated lipid scramblase and ion channel that mediates Ca2+ influx, TMEM16F relies on both functions to facilitate extracellular vesicle generation, blood coagulation, and bone formation. How a bona fide ion channel scrambles lipids remains elusive. Our structural analyses revealed the coexistence of an intact channel pore and PIP2-dependent protein conformation changes leading to membrane distortion. Correlated to the extent of membrane distortion, many tightly bound lipids are slanted. Structure-based mutagenesis studies further reveal that neutralization of some lipid-binding residues or those near membrane distortion specifically alters the onset of lipid scrambling, but not Ca2+ influx, thus identifying features outside of channel pore that are important for lipid scrambling. Together, our studies demonstrate that membrane distortion does not require open hydrophilic grooves facing the membrane interior and provide further evidence to suggest separate pathways for lipid scrambling and ion permeation.

Keywords: PIP(2) modulation; TMEM16F; calcium; cryo-EM; ion channel; lipid scramblase; membrane distortion.


Conflict of interest statement

DECLARATION OF INTERESTS

The authors declare no competing interests.

Figures

Figure 1.
Figure 1.. Ca2+-Dependent Conformation Changes and Lipid Binding to TMEM16F
(A–C) Lipids with slanted orientations (model in magenta, superimposed on the sharpened density map in light gray; A) are associated with Ca2+-bound TMEM16F in digitonin (green) with lipids (magenta) and one Ca2+ ion (red sphere) in each monomer, overlaid on the electron density map (sharpened, in light gray; B). The Ca2+ ion is coordinated by N621 on TM6, E670 on TM7, and D703 on TM8 (C). (D–F) Fewer lipids (model in magenta, superimposed on the sharpened electron density map in light gray; D) are associated with Ca2+-free TMEM16F in digitonin (yellow) with lipids (magenta) overlaid on the electron density map (sharpened, in light gray; E). TM6 remains close to TM7 and TM8 even without Ca2+ binding to the acidic residues on these transmembrane helices (F). (G) Superimposition of ribbon diagrams of Ca2+-bound (green) and Ca2+-free (yellow) TMEM16F in digitonin, showing a bend of TM6 at G615 in Ca2+-bound, but not Ca2+-free, TMEM16F and R542, N621, and K706 with Ca2+-dependent placements. (H) Superimposition of ribbon diagrams of Ca2+-bound (green) and Ca2+-free (yellow) TMEM16F in digitonin, showing different conformations of TM9-TM10 loop. (I) A lipid with its headgroup coordinated by R813, K823, and H824 on TM9-TM10 loop of Ca2+-bound TMEM16F in digitonin (green). (J) A lipid with its headgroup coordinated by R753 and H768 on TM9-TM10 loop of Ca2+-bound TMEM16F in digitonin (green). See also Figures S1 and S2 and Table S1.
Figure 2.
Figure 2.. Functional Tests of Lipid-Binding Residues on TM9-TM10 Loop and Other Residues with Ca2+-Dependent Placements
(A–F) Analysis of residues involved in Ca2+ binding is depicted (A)–(C), and (D)–(F) are for analysis of residues involved in lipid binding. Live imaging of TMEM16Fdependent Ca2+ influx (A and D), PS exposure (B and E), and GPMV generation (C and F) is shown. Time-lapse imaging of 500–1,000 cells with 10× magnification was performed to concurrently monitor GPMV formation and Ca2+ influx via Fluo-8 fluorescence. Time-lapse imaging of individual cells viewed with 603 magnification was performed to monitor PS exposure via pSIVA fluorescence. Data are represented as mean ± SEM. (G–I) Scattered dot plots of time of onset of TMEM16F-dependent Ca2+ influx (G), PS exposure (H), and GPMV generation (I). Time of onset, which is the maximum of the second derivative of the curve (maximal acceleration), could not be determined for those time courses with a linear rather than sigmoidal rise. Data are represented as mean ± SD. *p < 0.05; **p < 0.01; ***p < 0.001; ****p < 0.0001. Statistical significance of all mutants as compared to TMEM16F wild-type (WT) are determined by one-way ANOVA followed by Holm-Šídák multiple comparisons test. See also Figure S3 and Table S2.
Figure 3.
Figure 3.. Membrane Distortion Depends on the TMEM16F Conformation
(A) Ca2+-bound TMEM16F of class 2 (blue) in nanodiscs supplemented with PIP2 is associated with prominent distortion of the membrane (light gray, with border marked by dashed green lines) near TM3, TM4, TM6, and pre-TM1 elbow (red). Membrane distortion is quantified by measuring the membrane thickness, with the normalized values shown. (B) Ca2+-bound TMEM16F of class 1 (orange) in nanodiscs supplemented with PIP2 is associated with moderate distortion of the membrane (light gray, with border marked by dashed green lines) near TM3, TM4, TM6, and pre-TM1 elbow (red). Membrane distortion is quantified by measuring the membrane thickness, with the normalized values shown. (C) Ca2+-bound TMEM16F (yellow) in nanodiscs without PIP2 supplement is associated with minimal distortion of the membrane (light gray, with border marked by dashed green lines) as revealed by the membrane thickness measurements. (D–F) Pairwise superimposition of density maps of TM3, TM4, TM6, and pre-TM1 elbow, showing the kink of TM6 at P628 (encircled with dotted line) of Ca2+-bound TMEM16F in nanodiscs supplemented with PIP2(D; orange for class 1;blue for class 2), but not in digitonin (E; green) or nanodiscs without PIP2 supplement (F; yellow). (G–I) Pairwise superimposition of ribbon diagrams of TM3, TM4, TM6, and pre-TM1 elbow, Ca2+-bound TMEM16F in nanodiscs supplemented with PIP2 Class 1 (orange) vs Ca2+-bound TMEM16F in nanodiscs supplemented with PIP2 Class 2 (blue) (G) or Ca2+-bound TMEM16F in digitonin (green) (H), Ca2+-bound TMEM16F in nanodiscs supplemented with PIP2 Class 2 (blue) vs Ca2+-bound TMEM16F in digitonin (green) (I), showing the kink of TM6 at P628 (encircled with dotted line) of Ca2+-bound TMEM16F in nanodiscs supplemented with PIP2 (orange for class 1; blue for class 2), but not in digitonin (green). See also Figures S2, S4, and S5, Table S1, and Videos S1 and S2.
Figure 4.
Figure 4.. TMEM16F-Conformation-Dependent Orientation of Bound Lipids and Functional Tests of Basic Residues Associated with Membrane Distortion
(A) Transmembrane helices and loops in ribbon diagram for class 2 TMEM16F (blue) and bound lipids (magenta) shown with distorted membrane (gray). Membrane distortion is near TM3 and TM4 (red) and TM6 and pre-TM1 elbow (orange) with clusters of basic residues (encircled in dashed line) that are tested with mutagenesis. (B) Superimposition of lipids bound to class 1 (gold) and class 2 (blue) TMEM16F in PIP2-supplemented nanodiscs. Dotted circles mark the lipid headgroups that interact with extracellular loops. (C–E) Live imaging of TMEM16F-dependent Ca2+ influx (C), PS exposure (D), and GPMV generation (E). Time-lapse imaging of 500–1,000 cells with 10× magnification was performed to concurrently monitor GPMV formation and Ca2+ influx via Fluo-8 fluorescence. Time-lapse imaging of individual cells viewed with 603 magnification was performed to monitor PS exposure via pSIVA fluorescence. Data are represented as mean ± SEM. (F–H) Scattered dot plots of time of onset of TMEM16F-dependent Ca2+ influx (F), PS exposure (G), and GPMV generation (H). Time of onset could not be determined for those time courses with a linear rather than sigmoidal rise. Data are represented as mean ± SD. *p < 0.05; **p < 0.01; ***p < 0.001; ****p < 0.0001. Statistical significance of all mutants as compared to TMEM16F WT is determined by one-way ANOVA followed by Holm- Šídák multiple comparisons test. See also Figure S3, Table S2, and Videos S1 and S2.
Figure 5.
Figure 5.. PIP2-Dependent Lipid Binding Near Membrane Distortion and Functional Tests of Lipid-Binding Residues
(A) Ca2+-bound TMEM16F (class 2) in PIP2 supplemented nanodiscs. Bound lipids are in cyan, and the one shown in (B) is in magenta. (B) A phosphatidylserine (PS) (fatty acid tails in magenta and headgroup encircled with dashed line, superimposed on the sharpened electron density map in light gray) has its polar headgroup coordinated by R478 on TM3 and K590 and R592 on the TM5-TM6 loop. TMEM16Fs from class 1 (in orange, top panel) and class 2 (in blue, bottom panel) are shown with the same protein orientation. (C–E) Live imaging of TMEM16F-dependent Ca2+ influx (C), PS exposure (D), and GPMV generation (E). Time-lapse imaging of 500–1,000 cells with 10× magnification was performed to concurrently monitor GPMV formation and Ca2+ influx via Fluo-8 fluorescence. Time-lapse imaging of individual cells viewed with 603 magnification was performed to monitor PS exposure via pSIVA fluorescence. Data are represented as mean ± SEM. (F–H) Scattered dot plots of time of onset of TMEM16F-dependent Ca2+ influx (F), PS exposure (G), and GPMV generation (H). Time of onset could not be determined for those time courses with a linear rather than sigmoidal rise. Data are represented as mean ± SD. *p < 0.05; **p < 0.01; ***p < 0.001; ****p < 0.0001. Statistical significance of all mutants as compared to TMEM16F WT is determined by one-way ANOVA followed by Holm- Šídák multiple comparisons test. See also Figure S3 and Table S2.
Figure 6.
Figure 6.. The TMEM16F Channel Pore and Functional Tests of Pore-Lining Residues
(A–C) The solvent-accessible (mesh) pore of Ca2+-bound TMEM16F in PIP2-supplemented nanodiscs (orange for class 1; blue for class 2; A and B) or digitonin (green; C). (D) Pore radius along the z axis (green for TMEM16F in digitonin; orange and blue for class 1 and class 2 of TMEM16F in PIP2 supplemented nanodiscs, respectively). (E–G) Live imaging of TMEM16F-dependent Ca2+ influx (E), PS exposure (F), and GPMV generation (G). Time-lapse imaging of 500–1,000 cells with 10× magnification was performed to concurrently monitor GPMV formation and Ca2+ influx via Fluo-8 fluorescence. Time-lapse imaging of individual cells viewed with 603 magnification was performed to monitor PS exposure via pSIVA fluorescence. Data are represented as mean ± SEM. (H–J) Scattered dot plots of time of onset of TMEM16F-dependent Ca2+ influx (H), PS exposure (I), and GPMV generation (J). Time of onset could not be determined for those time courses with a linear rather than sigmoidal rise. Data are represented as mean ± SD. *p < 0.05; **p < 0.01; ***p < 0.001; ****p < 0.0001. Statistical significance of all mutants as compared to TMEM16F WT is determined by one-way ANOVA followed by Holm-Šídák multiple comparisons test. (K) Normalized currents fit to the Hill equation. The Hill coefficient is 2, and the EC50 values of E529A and E604 (24.0 ± 2.3 μM and 20.1 ± 2.2 μM, respectively) are significantly increased compared to the EC50 of wild-type control (7.4 ± 1.9 mM; p < 0.0001; corrected Dunnett test following one-way ANOVA). EC50 of K530A (6.5 ± 2.9 μM) is not significantly different from WT value (p = 0.99). See also Figures S2, S3, and S6, Table S2, and Videos S1 and S2.
Figure 7.
Figure 7.. Model for Lipid Scrambling
(A) Schematics showing the half-open subunit cavity of the fungal scramblases nhTMEM16 and afTMEM16 (left) and the intact enclosed channel pore ofTMEM16F, which has dual function of channel and scramblase, in the presence (right) or absence (middle) of PIP2 that causes changes of TMEM16F conformation. The cross section of dimeric TMEM16F in nanodiscs with or without PIP2 supplement is very similar. (B) Membrane distortion is associated with fungal scramblases with half-open subunit cavity (left). Whereas TMEM16F in nanodiscs without PIP2 supplementation is not associated with membrane distortion, PIP2-induced conformation changes of TMEM16F causes membrane distortion near the enclosed channel pore (right). (C) In addition to the two lipids stably bound to clusters of basic residues in the TM9-TM10 loop of Ca2+-bound TMEM16F, a lipid (likely PS) is bound to basic residues on TM4 and the TM4-TM5 loop of Ca2+-bound TMEM16F in PIP2-supplemented nanodiscs. PIP2 induces displacements of TM3, TM4, and TM6, which displays a kink to bring clusters of basic residues on TM6 and the pre-TM1 elbow together, thereby causing membrane distortion. Alanine substitutions of a subset of these basic residues involved in lipid binding and membrane distortion specifically affect PS exposure, indicating that lipid scrambling may proceed in a pathway separable from ion permeation. See also Figure S7 and Videos S1 and S2.

References

    1. Adams PD, Afonine PV, Bunkóczi G, Chen VB, Davis IW, Echols N, Headd JJ, Hung LW, Kapral GJ, Grosse-Kunstleve RW, et al. (2010). PHENIX: a comprehensive Python-based system for macromolecular structure solution. Acta Crystallogr. D Biol. Crystallogr 66, 213–221. - PMC - PubMed
    1. Alvadia C, Lim NK, Clerico Mosina V, Oostergetel GT, Dutzler R, and Paulino C (2019). Cryo-EM structures and functional characterization of the murine lipid scramblase TMEM16F. eLife 8, e44365. - PMC - PubMed
    1. Batti L, Sundukova M, Murana E, Pimpinella S, De Castro Reis F, Pagani F, Wang H, Pellegrino E, Perlas E, Di Angelantonio S, et al. (2016). TMEM16F regulates spinal microglial function in neuropathic pain states. Cell Rep. 15, 2608–2615. - PMC - PubMed
    1. Bethel NP, and Grabe M (2016). Atomistic insight into lipid translocation by a TMEM16 scramblase. Proc. Natl. Acad. Sci. USA 113, 14049–14054. - PMC - PubMed
    1. Boisseau P, Bene MC, Besnard T, Pachchek S, Giraud M, Talarmain P, Robillard N, Gourlaouen MA, Bezieau S, and Fouassier M (2018). A new mutation of ANO6 in two familial cases of Scott syndrome. Br. J. Haematol 180, 750–752. - PubMed

Publication types