Meta-Analysis
. 2019 Sep;30(9):1756-1769.
doi: 10.1681/ASN.2019010009. Epub 2019 Jul 10.

Performance of GFR Slope as a Surrogate End Point for Kidney Disease Progression in Clinical Trials: A Statistical Simulation

Affiliations
Meta-Analysis

Performance of GFR Slope as a Surrogate End Point for Kidney Disease Progression in Clinical Trials: A Statistical Simulation

Tom Greene et al. J Am Soc Nephrol. 2019 Sep.

Abstract

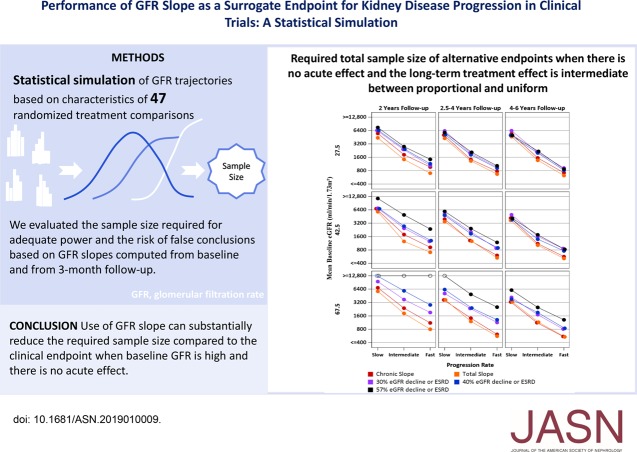
Background: Randomized trials of CKD treatments traditionally use clinical events late in CKD progression as end points. This requires costly studies with large sample sizes and long follow-up. Surrogate end points like GFR slope may speed up the evaluation of new therapies by enabling smaller studies with shorter follow-up.

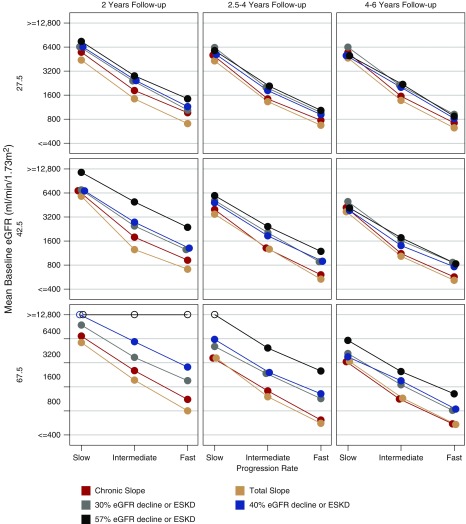
Methods: We used statistical simulations to identify trial situations where GFR slope provides increased statistical power compared with the clinical end point of doubling of serum creatinine or kidney failure. We simulated GFR trajectories based on data from 47 randomized treatment comparisons. We evaluated the sample size required for adequate statistical power based on GFR slopes calculated from baseline and from 3 months follow-up.

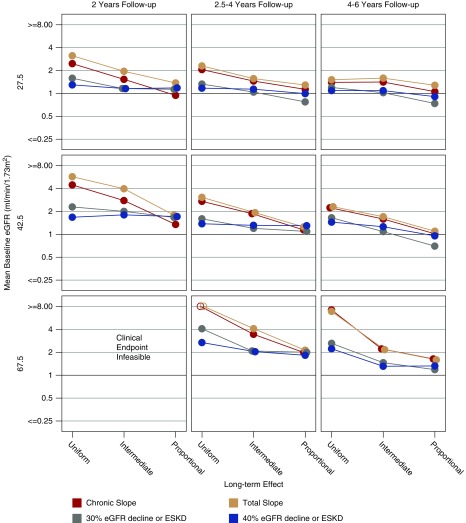
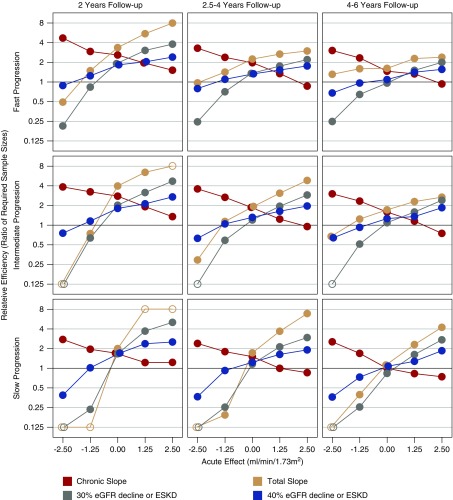
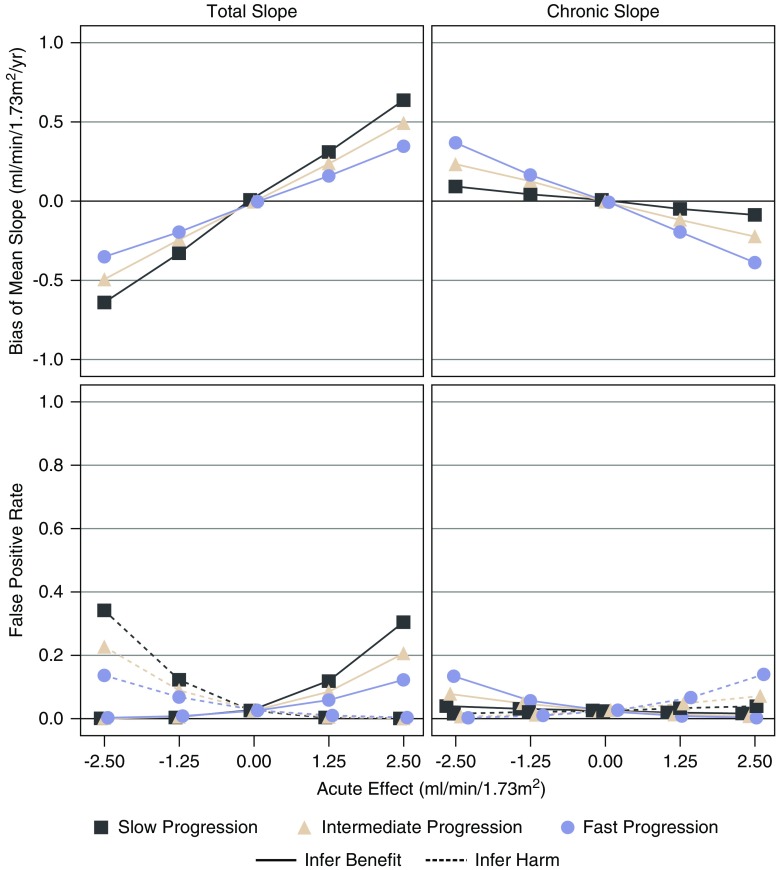
Results: In most scenarios where the treatment has no acute effect, analyses of GFR slope provided similar or improved statistical power compared with the clinical end point, often allowing investigators to shorten follow-up by at least half while simultaneously reducing sample size. When patients' GFRs are higher, the power advantages of GFR slope increase. However, acute treatment effects within several months of randomization can increase the risk of false conclusions about therapies based on GFR slope. Care is needed in study design and analysis to avoid such false conclusions.

Conclusions: Use of GFR slope can substantially increase statistical power compared with the clinical end point, particularly when baseline GFR is high and there is no acute effect. The optimum GFR-based end point depends on multiple factors including the rate of GFR decline, type of treatment effect and study design.

Keywords: CKD progression; GFR slope; end stage kidney disease; simulation studies.


Figures

None
Graphical abstract
Figure 1.
Figure 1.
The chronic and total slope lead to large reductions in required sample size in the ideal setting in which there is no acute effect and the long term treatment effect is uniform. Shown are the total sample sizes in both the treatment and control groups combined that are required by different endpoints to obtain 90% power with two-sided α=0.05 when the treatment reduces the mean chronic slope by 25% and the long-term treatment effect is uniform. The nine panels represent trials with short (2 years; left panels), medium (2.5–4 years; center panels), and long (4–6 years; right panels) duration in patients with low (27.5 ml/min per 1.73 m2; top panels), intermediate (42.5 ml/min per 1.73 m2; middle panels) and high (67.5 ml/min per 1.73 m2; bottom panels) mean baseline GFR. Within each panel the horizontal axis corresponds to slow (−1.5 ml/min per 1.73 m2 per year), intermediate (−3.25 ml/min per 1.73 m2 per year), or fast (−5.0 ml/min per 1.73 m2 per year) mean rates of GFR decline. Required sample sizes >12,800 are indicated by open circles. All required sample sizes assume there is no acute effect.
Figure 2.
Figure 2.
The relative efficiency of the chronic and total slope compared to the clinical end point is reduced when the long term treatment effect is proportional rather than uniform. Shown are the relative efficiencies of the indicated alternative end points compared with the clinical end point in relation to the type of long-term treatment effect when the mean slope in the control group is moderate (−3.25 ml/min per 1.73 m2 per year) and there is no acute effect. The relative efficiency for each alternative end point indicates the savings in required sample size (expressed as a ratio of sample sizes) when that end point is used compared with the clinical end point. Relative efficiencies greater than one indicate higher power for the alternative end point than the clinical end point. Within each panel, relative efficiencies are provided for uniform, intermediate, and proportional long-term treatment effects. The panels correspond to trials in which the mean baseline GFR is low (27.5 ml/min per 1.73 m2; top panels), intermediate (42.5 ml/min per 1.73 m2; middle panels), or high (67.5 ml/min per 1.73 m2; bottom panels), with either short (2 years; left panels), medium (2.5–4 years; middle panels), or long (4–6 years, right panels) follow-up. Relative efficiencies could not be accurately computed for trials with high baseline GFR and 2 years of follow-up due to insufficient events for the clinical end point.
Figure 3.
Figure 3.
The chronic and total slope often reduce the required sample size compared to the clinical end point when there is no acute effect and the long-term treatment effect is intermediate between proportional and uniform. Shown are the total sample sizes in both the treatment and control groups combined that are required for different endpoints to obtain 90% power with two-sided α=0.05 when the treatment reduces the mean chronic slope by 25%. The panels correspond to trials in which the mean baseline GFR is low (27.5 ml/min per 1.73 m2; top panels), intermediate (42.5 ml/min per 1.73 m2; middle panels), or high (67.5 ml/min per 1.73 m2; bottom panels), with either short (2 years; left panels), medium (2.5–4 years; middle panels), or long (4–6 years, right panels) follow-up. Within each panel, the required sample sizes are provided for slow (−1.5 ml/min per 1.73 m2 per year), intermediate (−3.25 ml/min per 1.73 m2 per year), or fast (−5.0 ml/min per 1.73 m2 per year) mean rates of GFR decline. Required sample sizes >12,800 are indicated by open circles. All required sample sizes assume there is no acute effect and that long-term treatment effects are intermediate between proportional and uniform.
Figure 4.
Figure 4.
Non-zero acute effects can strongly influence the relative efficiency of alternative end points. The figure displays the relationship of the relative efficiency of different endpoints compared to the clinical endpoint in relation to the acute effect of the treatment when the long-term treatment effect is intermediate between proportional and uniform. Relative efficiencies greater than one indicate higher power for the alternative end point than the clinical end point. Relative efficiencies are provided for trials in which the mean control group progression rate is fast (−5 ml/min per 1.73 m2 per year; top panels), intermediate (−3.25 ml/min per 1.73 m2 per year; middle panels), or slow (−1.5 ml/min per 1.73 m2 per year; bottom panels), with either short (2 years; left panels), medium (2.5–4 years; middle panels), or long (4–6 years, right panels) follow-up. All relative efficiencies assume an intermediate mean baseline GFR of 42.5 ml/min per 1.73 m2 and a long-term treatment effect which is intermediate between uniform and proportional. The size of the acute effect (either negative or positive) is assumed to be greater at higher levels of GFR such that the acute effect fully attenuates by the time GFR declines to 15 ml/min per 1.73 m2. Open circles indicate relative efficiencies which are >8 or <0.125.
Figure 5.
Figure 5.
Acute effects which attenuate can lead to bias and risk of false positive results. The figure displays the bias and risk of false positive and false negative conclusions when there is no long-term treatment effect with medium follow-up time. The top panels display the effects of the treatment on the mean total slope to 3 years (left) and the mean chronic slope (right) as a function of the acute effect on the horizontal axis when the acute effect is assumed to increase linearly from a value of zero when GFR=15 ml/min per 1.73 m2 to the values indicated on the horizontal axis at a GFR of 42.5 ml/min per 1.73 m2 and follow-up is medium (2.5–4 years). The acute effects are then assumed to attenuate linearly as GFR declines during subsequent follow-up, with complete attenuation reached at a GFR of 15 ml/min per 1.73 m2. Aside from the attenuation of the acute effect, no long-term effect of the treatment is assumed. In this setting there is no effect of the treatment on the time to ESKD or death, so any nonzero effects represent a bias relative to the treatment effect on the clinical end point. The bottom panels indicate the implications of these biases for the risk of false conclusions of treatment benefit or of treatment harm for a RCT with 1000 total patients. Negative acute effects lead to bias of the total slope against the treatment, with a consequent inflation of the risk of a false conclusion of treatment harm, whereas positive acute effects lead to bias of the total slope in favor of the treatment, with a consequent inflation of the risk of a false conclusion of treatment benefit. The biases and risks of false conclusions of benefit or harm are in the reverse direction for the chronic slope due to attenuation of the initial acute effect.

References

    1. Levey AS, Stevens LA, Schmid CH, Zhang YL, Castro AF III, Feldman HI, et al. .: CKD-EPI (Chronic Kidney Disease Epidemiology Collaboration) : A new equation to estimate glomerular filtration rate [published correction appears in Ann Intern Med 155: 408, 2011]. Ann Intern Med 150: 604–612, 2009 - PMC - PubMed
    1. Levey AS, Coresh J: Chronic kidney disease. Lancet 379: 165–180, 2012 - PubMed
    1. Coresh J, Turin TC, Matsushita K, Sang Y, Ballew SH, Appel LJ, et al. .: Decline in estimated glomerular filtration rate and subsequent risk of end-stage renal disease and mortality. JAMA 311: 2518–2531, 2014 - PMC - PubMed
    1. Grams M, Sang Y, Ballew S, Matsushita K, Astor BC, Carrero JJ, et al. : Evaluating glomerular filtration rate slope as a surrogate end point for ESKD in clinical trials: an individual participant meta-analysis of observational data. J Am Soc Nephrol 30: 1746–1755, 2019 - PMC - PubMed
    1. Inker LA, Heerspink HJ, Tighiouart H, Levey AS, Coresh J, Gansevoort R, et al. .: GFR slope as a surrogate end point for kidney disease progression in clinical trials: a meta-analysis of treatment effects of randomized controlled trials. J Am Soc Nephrol, 1735–1745, 2019 - PMC - PubMed

Publication types