

Protein synthesis rates and ribosome occupancies reveal determinants of translation elongation rates
- PMID: 31292258
- PMCID: PMC6660795
- DOI: 10.1073/pnas.1817299116
Protein synthesis rates and ribosome occupancies reveal determinants of translation elongation rates
Abstract
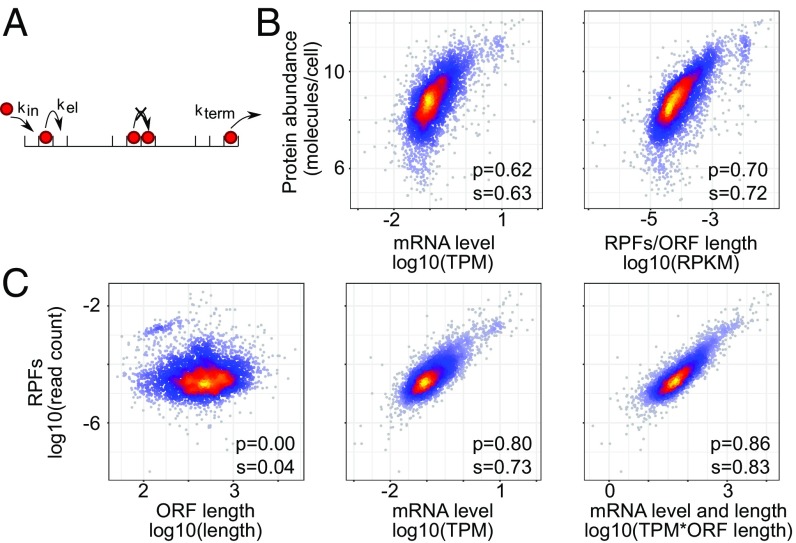
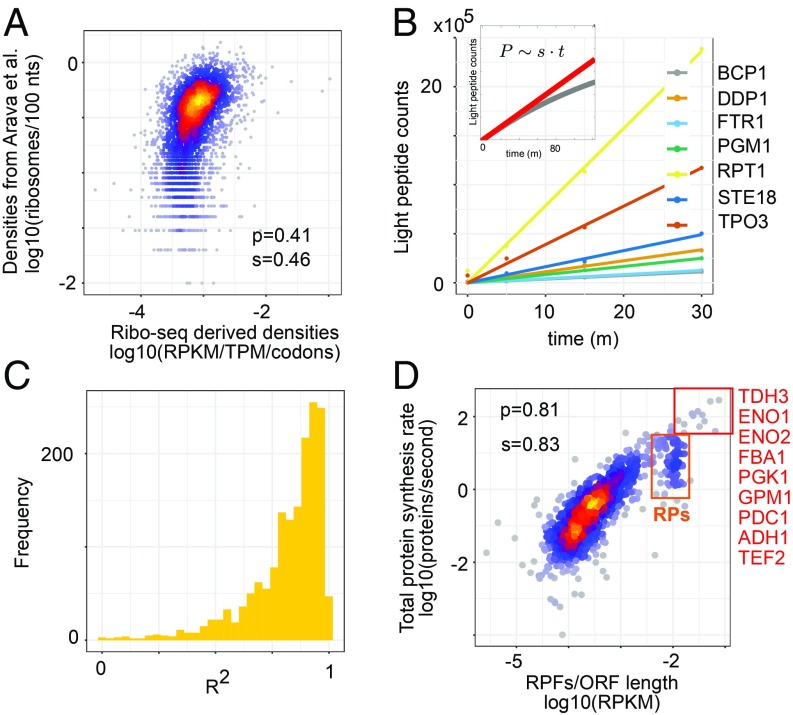
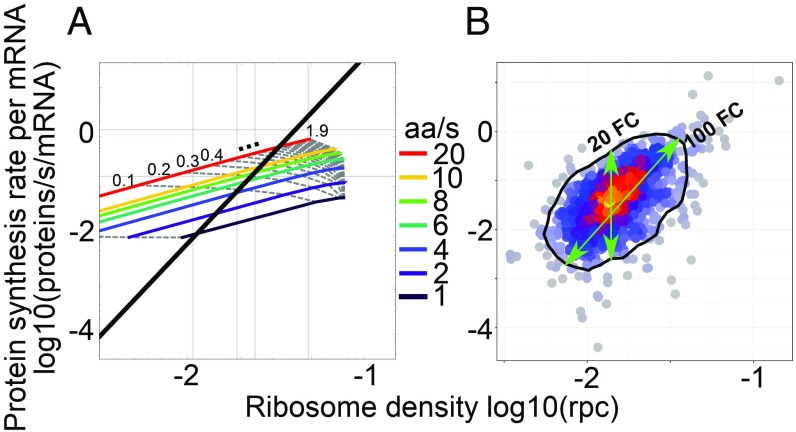
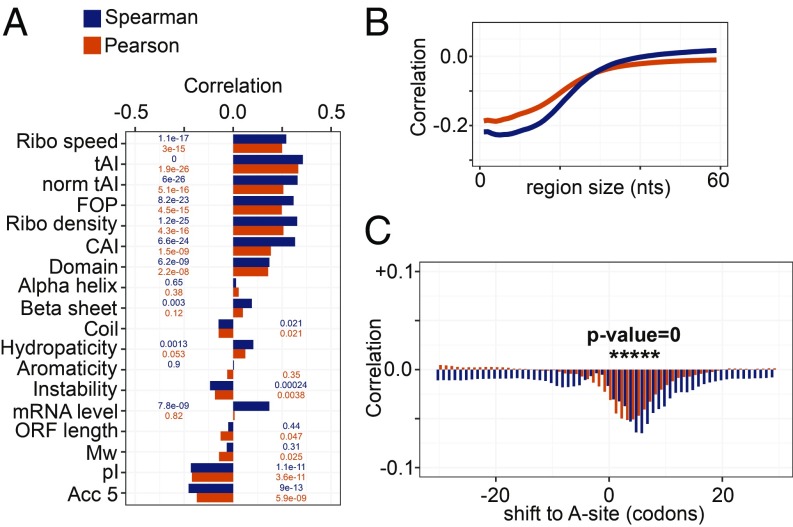
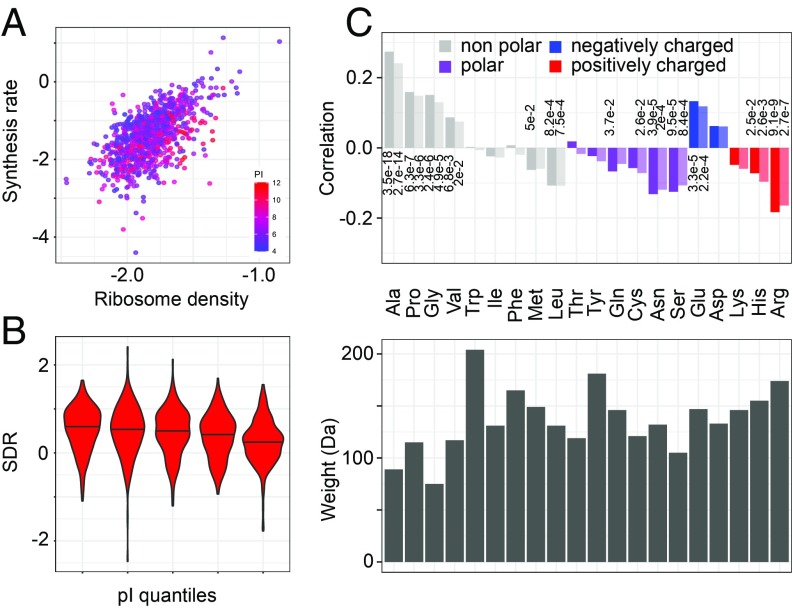
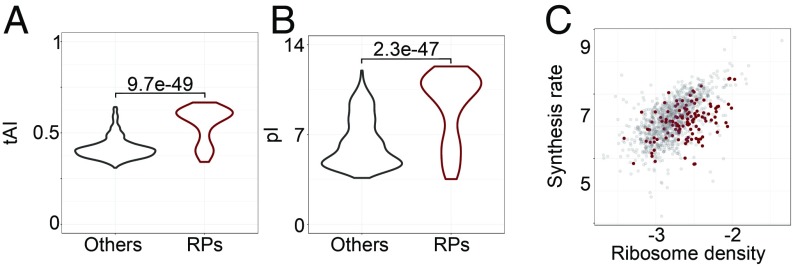
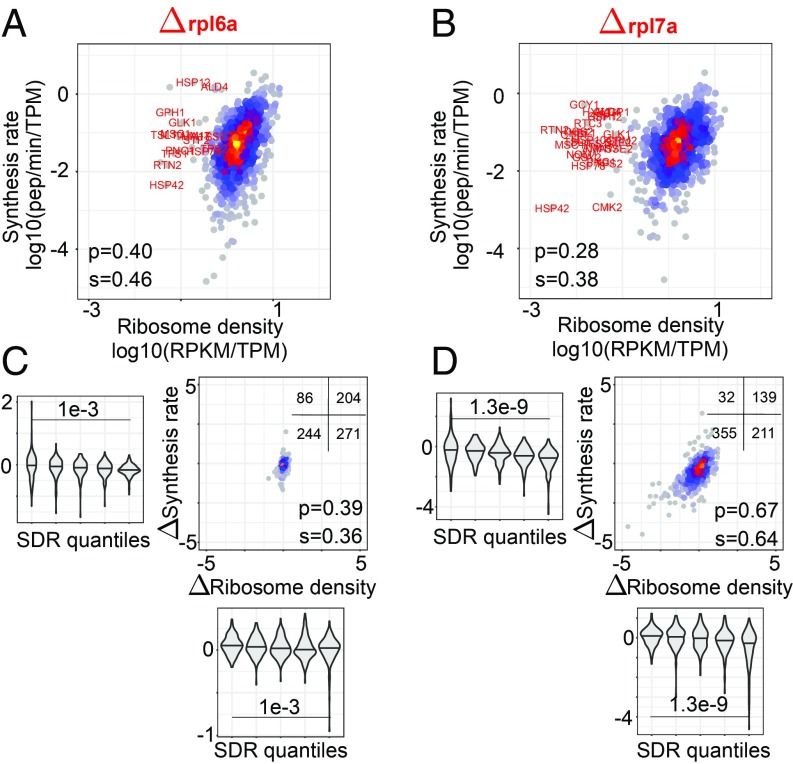
Although protein synthesis dynamics has been studied both with theoretical models and by profiling ribosome footprints, the determinants of ribosome flux along open reading frames (ORFs) are not fully understood. Combining measurements of protein synthesis rate with ribosome footprinting data, we here inferred translation initiation and elongation rates for over a 1,000 ORFs in exponentially growing wild-type yeast cells. We found that the amino acid composition of synthesized proteins is as important a determinant of translation elongation rate as parameters related to codon and transfer RNA (tRNA) adaptation. We did not find evidence of ribosome collisions curbing the protein output of yeast transcripts, either in high translation conditions associated with exponential growth, or in strains in which deletion of individual ribosomal protein (RP) genes leads to globally increased or decreased translation. Slow translation elongation is characteristic of RP-encoding transcripts, which have markedly lower protein output compared with other transcripts with equally high ribosome densities.
Keywords: TASEP; protein charge; ribosomal proteins; translation; yeast.
Copyright © 2019 the Author(s). Published by PNAS.
Conflict of interest statement
The authors declare no conflict of interest.
Figures
Similar articles
-
High-Resolution Ribosome Profiling Defines Discrete Ribosome Elongation States and Translational Regulation during Cellular Stress.Mol Cell. 2019 Mar 7;73(5):959-970.e5. doi: 10.1016/j.molcel.2018.12.009. Epub 2019 Jan 24. Mol Cell. 2019. PMID: 30686592 Free PMC article.
-
Inferring efficiency of translation initiation and elongation from ribosome profiling.Nucleic Acids Res. 2020 Sep 25;48(17):9478-9490. doi: 10.1093/nar/gkaa678. Nucleic Acids Res. 2020. PMID: 32821926 Free PMC article.
-
Understanding Biases in Ribosome Profiling Experiments Reveals Signatures of Translation Dynamics in Yeast.PLoS Genet. 2015 Dec 11;11(12):e1005732. doi: 10.1371/journal.pgen.1005732. eCollection 2015 Dec. PLoS Genet. 2015. PMID: 26656907 Free PMC article.
-
The ribosome in action: Tuning of translational efficiency and protein folding.Protein Sci. 2016 Aug;25(8):1390-406. doi: 10.1002/pro.2950. Epub 2016 Jun 8. Protein Sci. 2016. PMID: 27198711 Free PMC article. Review.
-
Mechanism and Regulation of Protein Synthesis in Saccharomyces cerevisiae.Genetics. 2016 May;203(1):65-107. doi: 10.1534/genetics.115.186221. Genetics. 2016. PMID: 27183566 Free PMC article. Review.
Cited by
-
Puromycin reveals a distinct conformation of neuronal ribosomes.Proc Natl Acad Sci U S A. 2024 Feb 13;121(7):e2306993121. doi: 10.1073/pnas.2306993121. Epub 2024 Feb 5. Proc Natl Acad Sci U S A. 2024. PMID: 38315848 Free PMC article.
-
Regulators of Viral Frameshifting: More Than RNA Influences Translation Events.Annu Rev Virol. 2020 Sep 29;7(1):219-238. doi: 10.1146/annurev-virology-012120-101548. Epub 2020 Jun 29. Annu Rev Virol. 2020. PMID: 32600156 Free PMC article. Review.
-
What determines eukaryotic translation elongation: recent molecular and quantitative analyses of protein synthesis.Open Biol. 2020 Dec;10(12):200292. doi: 10.1098/rsob.200292. Epub 2020 Dec 9. Open Biol. 2020. PMID: 33292102 Free PMC article. Review.
-
A deep analysis of the proteomic and phosphoproteomic alterations that occur in skeletal muscle after the onset of immobilization.J Physiol. 2021 Jun;599(11):2887-2906. doi: 10.1113/JP281071. Epub 2021 May 9. J Physiol. 2021. PMID: 33873245 Free PMC article.
-
Insights into lncRNAs in Alzheimer's disease mechanisms.RNA Biol. 2021 Jul;18(7):1037-1047. doi: 10.1080/15476286.2020.1788848. Epub 2020 Jul 14. RNA Biol. 2021. PMID: 32605500 Free PMC article. Review.
References
-
- Schwanhäusser B., et al. , Global quantification of mammalian gene expression control. Nature 473, 337–342 (2011). - PubMed
-
- Livingstone M., Atas E., Meller A., Sonenberg N., Mechanisms governing the control of mRNA translation. Phys. Biol. 7, 021001 (2010). - PubMed
-
- Varenne S., Buc J., Lloubes R., Lazdunski C., Translation is a non-uniform process. Effect of tRNA availability on the rate of elongation of nascent polypeptide chains. J. Mol. Biol. 180, 549–576 (1984). - PubMed
MeSH terms
Substances
LinkOut - more resources
Full Text Sources
Other Literature Sources
Molecular Biology Databases
