

Homeorhesis and ecological succession quantified in synthetic microbial ecosystems
- PMID: 31292259
- PMCID: PMC6660734
- DOI: 10.1073/pnas.1901055116
Homeorhesis and ecological succession quantified in synthetic microbial ecosystems
Abstract
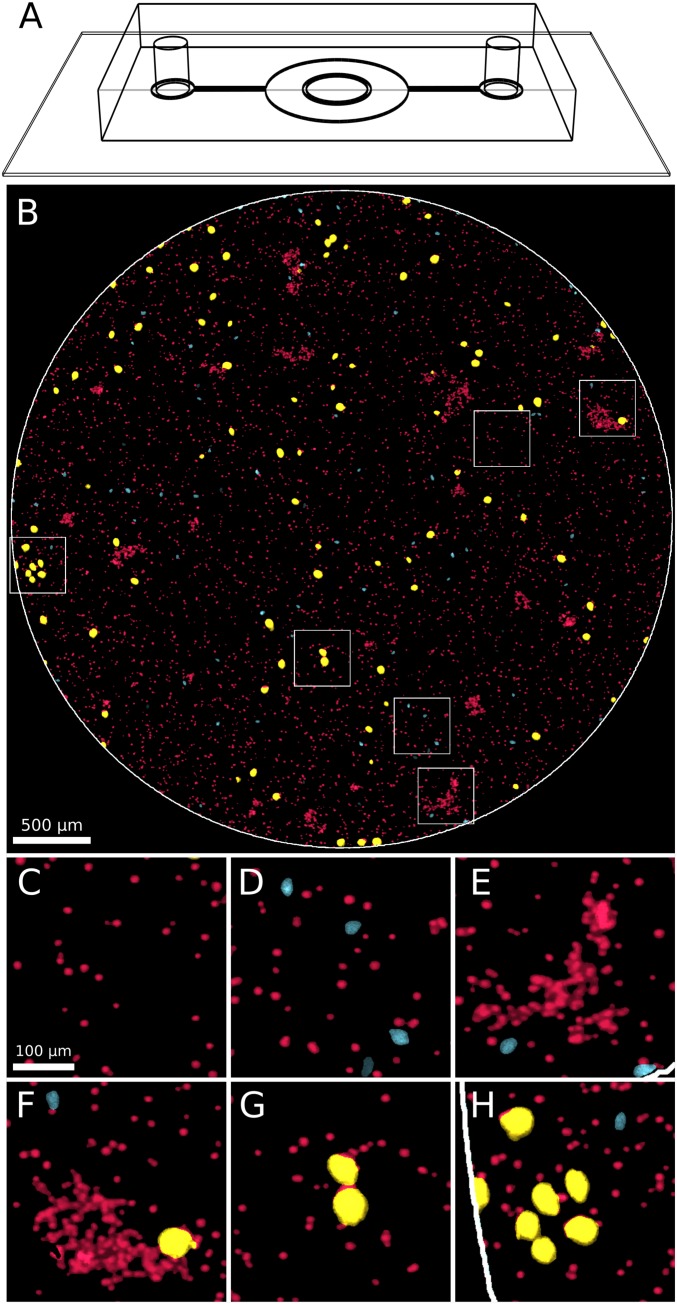
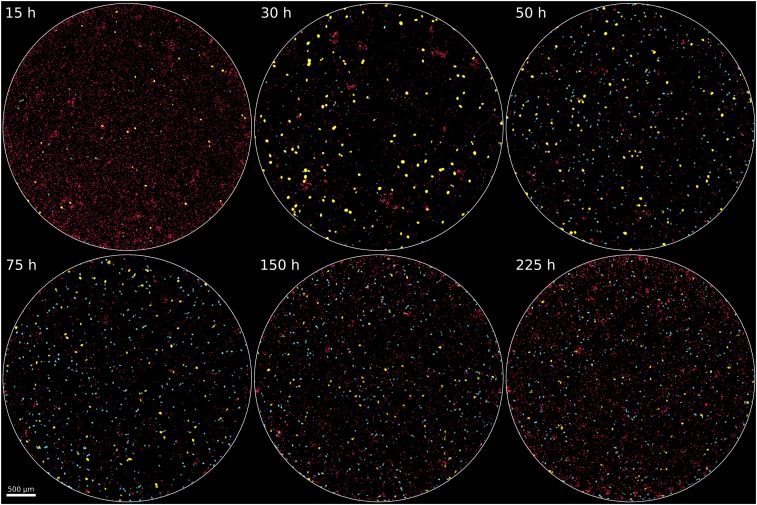
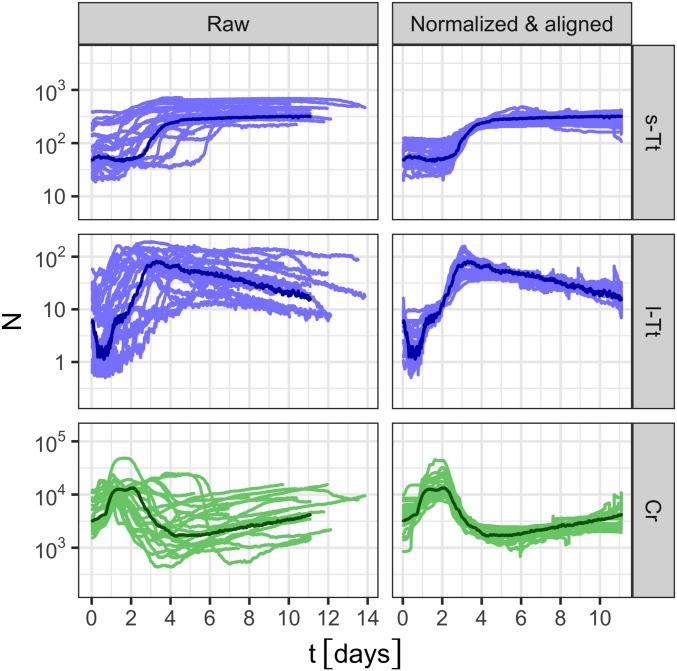
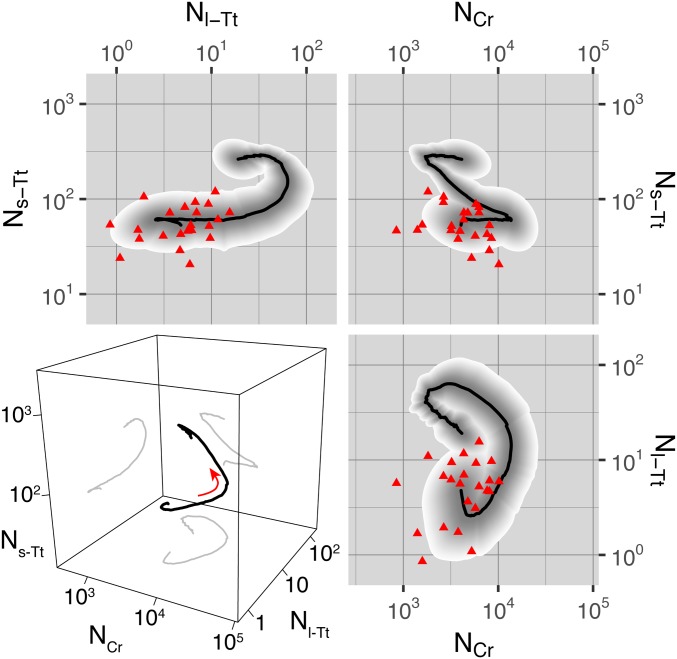
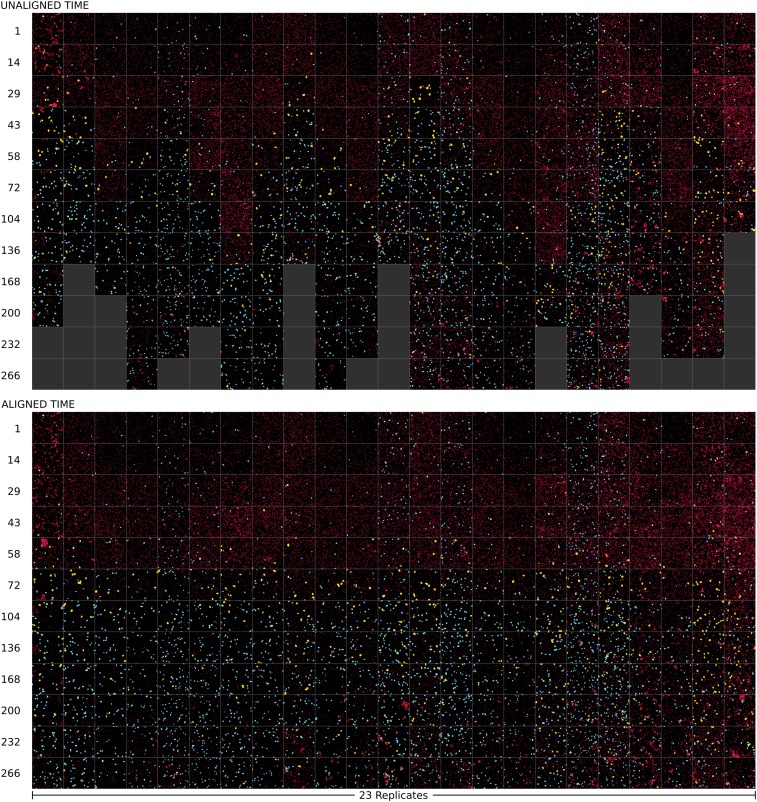
The dynamics of ecological change following a major perturbation, known as succession, are influenced by random processes. Direct quantitation of the degree of contingency in succession requires chronological study of replicate ecosystems. We previously found that population dynamics in carefully controlled, replicated synthetic microbial ecosystems were strongly deterministic over several months. Here, we present simplified, two-species microbial ecosystems consisting of algae and ciliates, imaged in toto at single-cell resolution with fluorescence microscopy over a period of 1 to 2 weeks. To directly study succession in these ecosystems, we deliberately varied the initial cell abundances over replicates and quantified the ensuing dynamics. The distribution of abundance trajectories rapidly converged to a nearly deterministic path, with small fluctuations, despite variations in initial conditions, environmental perturbations, and intrinsic noise, indicative of homeorhesis. Homeorhesis was also observed for certain phenotypic variables, such as partitioning of the ciliates into distinct size classes and clumping of the algae. Although the mechanism of homeorhesis observed in these synthetic ecosystems remains to be elucidated, it is clear that it must emerge from the ways each species controls its own internal states, with respect to a diverse set of environmental conditions and ecological interactions.
Keywords: contingency and determinism; ecological succession; microbial ecology.
Copyright © 2019 the Author(s). Published by PNAS.
Conflict of interest statement
The authors declare no conflict of interest.
Figures
Similar articles
-
Contingency and statistical laws in replicate microbial closed ecosystems.Cell. 2012 May 25;149(5):1164-73. doi: 10.1016/j.cell.2012.03.040. Cell. 2012. PMID: 22632978
-
Higher-Order Interaction between Species Inhibits Bacterial Invasion of a Phototroph-Predator Microbial Community.Cell Syst. 2019 Dec 18;9(6):521-533.e10. doi: 10.1016/j.cels.2019.11.004. Epub 2019 Dec 11. Cell Syst. 2019. PMID: 31838145
-
Stochasticity, succession, and environmental perturbations in a fluidic ecosystem.Proc Natl Acad Sci U S A. 2014 Mar 4;111(9):E836-45. doi: 10.1073/pnas.1324044111. Epub 2014 Feb 18. Proc Natl Acad Sci U S A. 2014. PMID: 24550501 Free PMC article.
-
The biology of impact craters--a review.Biol Rev Camb Philos Soc. 2002 Aug;77(3):279-310. doi: 10.1017/s146479310100584x. Biol Rev Camb Philos Soc. 2002. PMID: 12227518 Review.
-
From molecular manipulation of domesticated Chlamydomonas reinhardtii to survival in nature.Elife. 2018 Nov 1;7:e39233. doi: 10.7554/eLife.39233. Elife. 2018. PMID: 30382941 Free PMC article. Review.
Cited by
-
Testing the sequence of successional processes in miniature ecosystems.Microbiol Spectr. 2024 Oct 3;12(10):e0122724. doi: 10.1128/spectrum.01227-24. Epub 2024 Aug 27. Microbiol Spectr. 2024. PMID: 39190635 Free PMC article.
-
Host Immunity Alters Community Ecology and Stability of the Microbiome in a Caenorhabditis elegans Model.mSystems. 2021 Apr 20;6(2):e00608-20. doi: 10.1128/mSystems.00608-20. mSystems. 2021. PMID: 33879498 Free PMC article.
-
Evolutionary dynamics, evolutionary forces, and robustness: A nonequilibrium statistical mechanics perspective.Proc Natl Acad Sci U S A. 2022 Mar 29;119(13):e2112083119. doi: 10.1073/pnas.2112083119. Epub 2022 Mar 21. Proc Natl Acad Sci U S A. 2022. PMID: 35312370 Free PMC article.
-
Synthetic symbiosis between a cyanobacterium and a ciliate toward novel chloroplast-like endosymbiosis.Sci Rep. 2023 Apr 13;13(1):6104. doi: 10.1038/s41598-023-33321-w. Sci Rep. 2023. PMID: 37055487 Free PMC article.
-
Calibrating spatiotemporal models of microbial communities to microscopy data: A review.PLoS Comput Biol. 2022 Oct 13;18(10):e1010533. doi: 10.1371/journal.pcbi.1010533. eCollection 2022 Oct. PLoS Comput Biol. 2022. PMID: 36227846 Free PMC article. Review.
References
-
- Waddington C. H., The Strategy of the Genes. A Discussion of Some Aspects of Theoretical Biology (George Allen & Unwin, Ltd., London, UK, 1957).
-
- Waddington C. H., Canalization of development and the inheritance of acquired characters. Nature 150, 563–565 (1942).
-
- Wilkins A. S., The Evolution of Developmental Pathways (Sinauer Associates, Sunderland, MA, 2002).
Publication types
MeSH terms
Associated data
LinkOut - more resources
Full Text Sources
Other Literature Sources
