. 2019 Jul 10;10(1):3031.
doi: 10.1038/s41467-019-10703-1.

Decreased maternal serum acetate and impaired fetal thymic and regulatory T cell development in preeclampsia

Collaborators, Affiliations

Decreased maternal serum acetate and impaired fetal thymic and regulatory T cell development in preeclampsia

Mingjing Hu et al. Nat Commun. .

Abstract

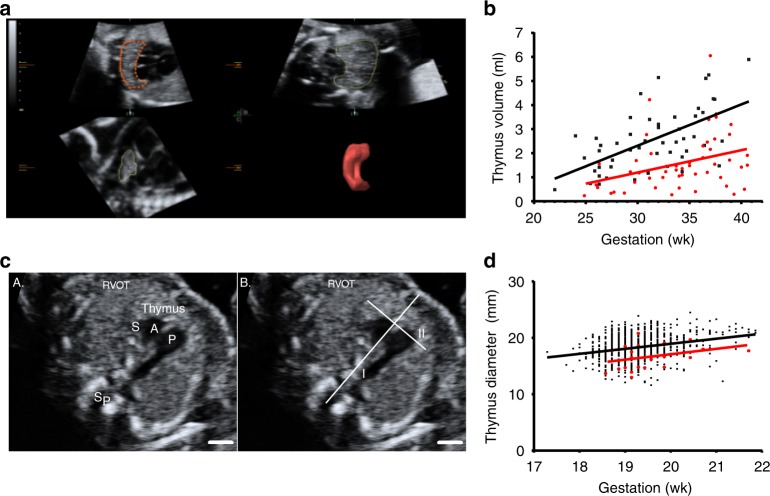
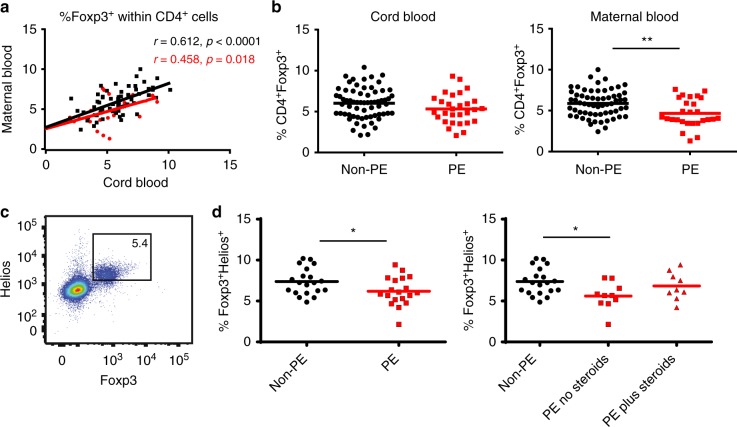
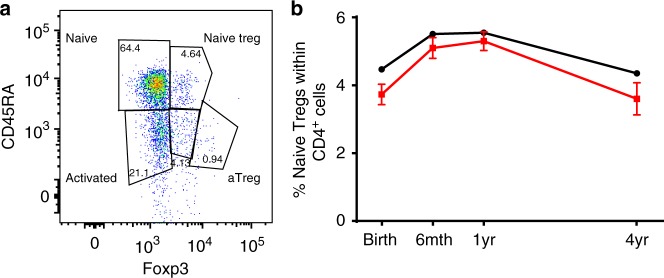
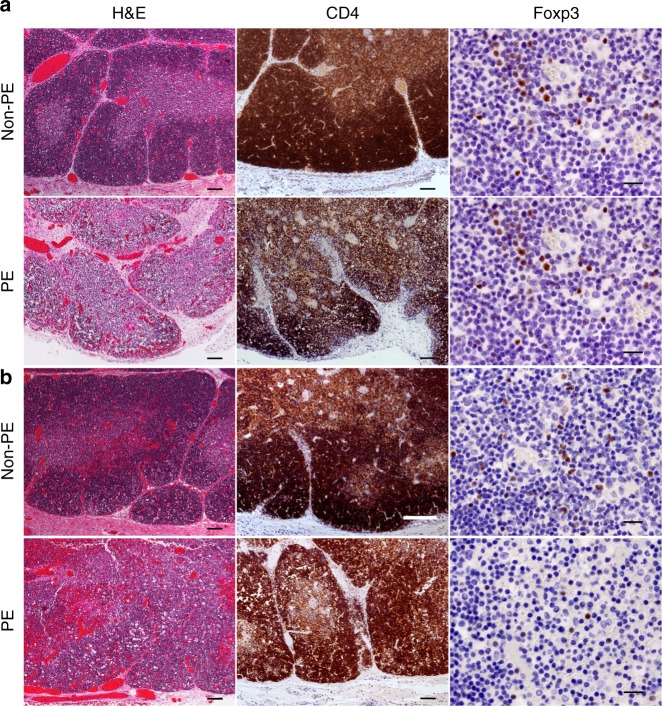
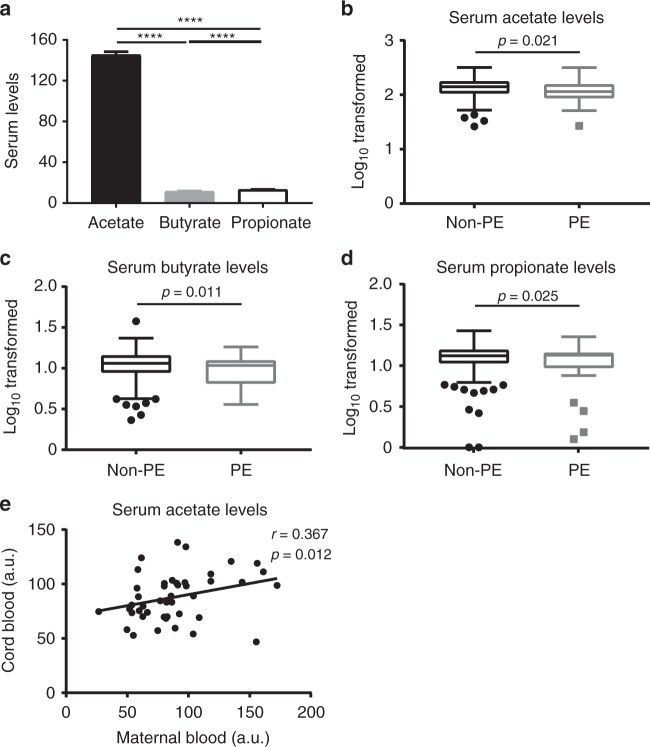
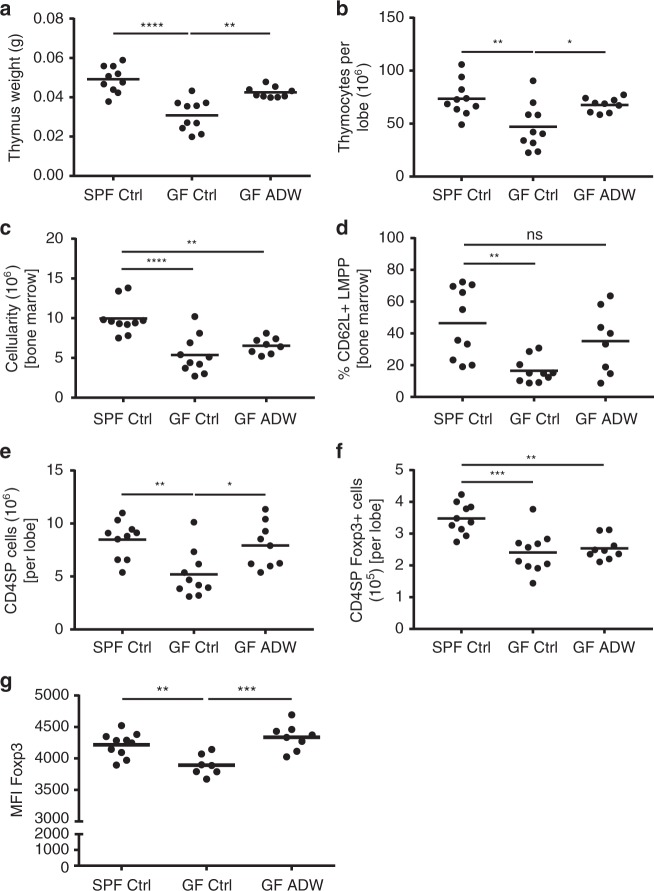
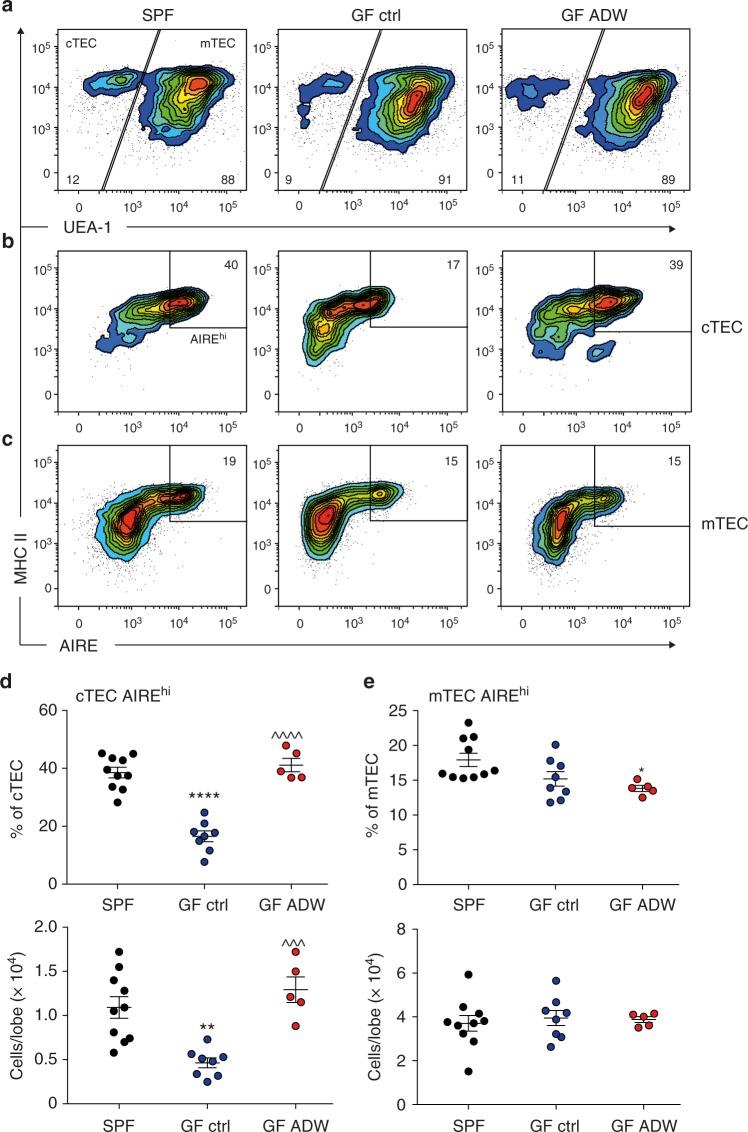
Maternal immune dysregulation seems to affect fetal or postnatal immune development. Preeclampsia is a pregnancy-associated disorder with an immune basis and is linked to atopic disorders in offspring. Here we show reduction of fetal thymic size, altered thymic architecture and reduced fetal thymic regulatory T (Treg) cell output in preeclamptic pregnancies, which persists up to 4 years of age in human offspring. In germ-free mice, fetal thymic CD4+ T cell and Treg cell development are compromised, but rescued by maternal supplementation with the intestinal bacterial metabolite short chain fatty acid (SCFA) acetate, which induces upregulation of the autoimmune regulator (AIRE), known to contribute to Treg cell generation. In our human cohorts, low maternal serum acetate is associated with subsequent preeclampsia, and correlates with serum acetate in the fetus. These findings suggest a potential role of acetate in the pathogenesis of preeclampsia and immune development in offspring.


Conflict of interest statement

The authors declare no competing interests.

Figures

Fig. 1
Fig. 1
Impaired fetal thymic development in preeclampsia. a Nepean cohort 1: Virtual organ computer-aided analysis calculation of the fetal thymus volume at 26 weeks of gestation, showing three orthogonal planes (left top: transverse, right top: coronal, left down: sagittal) and reconstructed thymus volume (right down). b Dot plot showing fetal thymus volumes in different gestational weeks in both non-preeclamptic (n = 50, black dots) and preeclamptic (n = 50, red dots) groups. Mean ± SD: 2.6 ± 1.3 mL and 1.6 ± 1.2 mL, respectively (p < 0.001, unpaired t-test). c Nepean cohort 2: Fetal thymus diameter measurement: an axial view of the fetal thymus was obtained, within a standard image of the right ventricular outflow tract (RVOT). Then a line was drawn connecting the fetal spine and sternum (I). Fetal thymus diameter was measured as its greatest diameter (II), perpendicular to line I. Sp = spine, S = superior vena cava, A = aorta, P = pulmonary artery. Scale bar = 5 mm. d Dot plot showing fetal thymus diameter in different gestational weeks in both non-preeclamptic (n = 863, black dots) and preeclamptic (n = 24, red dots) groups, adjusted means were 18.3 mm and 16.5 mm, respectively (p < 0.001, unpaired t-test)
Fig. 2
Fig. 2
Reduced number of fetal Treg cells and fetal Treg thymic output in preeclampsia. Nepean cohort 3: a Scatter dot plot showing Treg cell frequencies in term maternal-fetal dyads in both non-preeclamptic (non-PE) (n = 62, black dots) and preeclamptic (PE) pregnancies (n = 26, red dots). Pearson’s correlation was used. Coefficient r and p-values as indicated. b Scattered dot plots comparing the %Foxp3+ (Mean) within CD4+ cells in cord blood (n = 66 for non-PE, n = 29 for PE group) and maternal blood (n = 62 for non-PE group, n = 27 for PE group) (unpaired t-test). Gating strategy for Foxp3+ Tregs from PBMC is shown in Supplementary Fig. 2. c Representative dot plot showing cord blood Foxp3+Helios+ cells gated on CD4+ cells. d Scattered dot plots showing the percentage of Foxp3+Helios+ cells (Mean) in cord blood. Left panel comparing %Foxp3+Helios+ cells in non-PE (n = 20) and PE (n = 19) groups (unpaired t-test). Right panel dividing the PE group into two subgroups based on steroids treatment: n = 10 for no Steroids and n = 9 for plus Steroids (one-way ANOVA with Dunnett’s multiple comparisons test). *p < 0.05, **p < 0.01
Fig. 3
Fig. 3
Naive Treg cell changes in infants exposed to preeclampsia. BIS study: a Representative dot plot showing the gating strategy for naive Tregs gated on CD4+ cells. b The line graphs showing the longitudinal naive Treg cell proportions (Mean ± SD, as a percentage of the CD4+ population) in children from preeclamptic mothers (Red: at birth n = 11; 6-month n = 19; 1-year-old n = 22; 4-year-old n = 10) and children from non-hypertensive mothers (Black: at birth n = 434; 6-month n = 558; 1-year-old n = 629; 4-year-old n = 377). The overall difference is –0.49% (95% CI –0.83, –0.16) (p = 0.004, generalized estimating equation)
Fig. 4
Fig. 4
Fetal thymus histopathology. Photomicrographs of fetal thymuses stained to compare CD4+ and Foxp3+ T-cell populations between the control group and those mothers with preeclampsia at the time of fetal demise. a Fetal thymuses of Control (upper panel) and preeclamptic mothers (lower panel), at 24 weeks gestation. b A 33-week-old control fetus (upper panel), versus a 37-week-old fetus deceased to a mother who had preeclampsia (lower panel). Scale bars for H&E stains and CD4 stains = 100 µm. Scale bars for Foxp3 stains = 20 µm
Fig. 5
Fig. 5
Serum acetate in healthy pregnancy and preeclampsia. BIS study: a Bar graph showing maternal serum levels (Mean ± SEM, µM) of acetate, butyrate, and propionate at 28 weeks of pregnancy (n = 324) (RM one-way ANOVA with Tukey’s multiple comparisons test, with the Greenhouse-Geisser correction). Box and whisker (Tukey) plots showing evidence of associations between lower (b) acetate, (c) butyrate, and (d) propionate levels (µM, Log base 10 transformed) from women with subsequent preeclampsia (PE, n = 31) and women without preeclampsia (non-PE, n = 293). p-values calculated using weighted logarithmic regression. Nepean cohort 4 (e): Scattered dot plot showing the relative serum acetate levels in paired term maternal peripheral blood and cord blood (n = 46) (samples were collected at full term delivery). The acetate levels were based on peak heights from the NMR spectra normalized to the total intensity. a.u. = arbitrary units (values are divided by 1000). Pearson r = 0.367, p = 0.012; Spearman rho = 0.416, p = 0.004
Fig. 6
Fig. 6
Reduced Foxp3 MFI in thymic Treg cells from GF pups recovered with acetate supplementation. Three-week-old C57BL/6 pups from control SPF and GF mothers and GF mothers treated with acetate in drinking water (ADW). Cumulative data showing phenotypic analysis by flow cytometry in the thymus from pooled female and male pups (n = 7–10/group). a Thymus weight. b Thymocyte cellularity per thymic lobe. c Bone marrow cellularity. d The frequency of bone marrow CD62L+ lymphoid-primed multipotent progenitor (LMPP) cells. e The total number of CD4SP cells. f The total number of CD4SP Foxp3+ cells. g Foxp3 protein expression on a per cell basis in thymic CD4SP Foxp3+ cells. Gating strategies for LMPP cells, CD4SP cells and Foxp3+ cells are shown in Supplementary Figs. 3 and 4. The data are shown as mean fluorescence intensity (MFI). *p < 0.05, **p < 0.01, ***p < 0.001, ****p < 0.0001. All data were analyzed by one-way ANOVA with Bonferroni’s multiple comparisons test. Data represent mean; each symbol represents an individual mouse. Data are representative of at least two independent experiments
Fig. 7
Fig. 7
Reduced thymic AIRE expression in GF pups recovered with acetate supplementation. Three-week-old C57BL/6 pups from control SPF and GF mothers and GF mothers treated with acetate in drinking water (ADW). ac Representative flow cytometry analysis demonstrating AIRE expression in thymic epithelial cell subsets. d, e Flow cytometry and numerical analysis of AIRE expression in cTEC and mTEC subsets from pooled female and male pups (n = 5–10/group). Asterisk denotes significance to SPF, *p < 0.05, **p < 0.01, ****p < 0.0001; ^denotes significance to GF control, ^^^p < 0.001, ^^^^p < 0.0001. All data were analyzed by one-way ANOVA with Bonferroni’s multiple comparisons test. Data represent mean; each symbol represents an individual mouse. Data are representative of at least two independent experiments

Comment in

References

    1. Prescott SL. Early-life environmental determinants of allergic diseases and the wider pandemic of inflammatory noncommunicable diseases. J. Allergy Clin. Immunol. 2013;131:23–30. doi: 10.1016/j.jaci.2012.11.019. - DOI - PubMed
    1. Santner-Nanan B, et al. Systemic increase in the ratio between Foxp3+ and IL-17-producing CD4+ T cells in healthy pregnancy but not in preeclampsia. J. Immunol. 2009;183:7023–7030. doi: 10.4049/jimmunol.0901154. - DOI - PubMed
    1. Hsu P, et al. Altered decidual DC-SIGN+ antigen presenting cells and impaired regulatory T cell induction in preeclampsia. Am. J. Pathol. 2012;181:2149–2160. doi: 10.1016/j.ajpath.2012.08.032. - DOI - PubMed
    1. Santner-Nanan B, et al. Fetal-maternal alignment of regulatory T cells correlates with IL-10 and Bcl-2 upregulation in pregnancy. J. Immunol. 2013;191:145–153. doi: 10.4049/jimmunol.1203165. - DOI - PMC - PubMed
    1. Stokholm J, Sevelsted A, Anderson UD, Bisgaard H. Preeclampsia associates with asthma, allergy, and eczema in childhood. Am. J. Respir. Crit. Care. Med. 2017;195:614–621. doi: 10.1164/rccm.201604-0806OC. - DOI - PubMed

Publication types

MeSH terms