. 2019 Jul 10;9(1):9968.
doi: 10.1038/s41598-019-46355-w.

Integrative multi-omic analysis identifies new drivers and pathways in molecularly distinct subtypes of ALS

Affiliations

Integrative multi-omic analysis identifies new drivers and pathways in molecularly distinct subtypes of ALS

Giovanna Morello et al. Sci Rep. .

Abstract

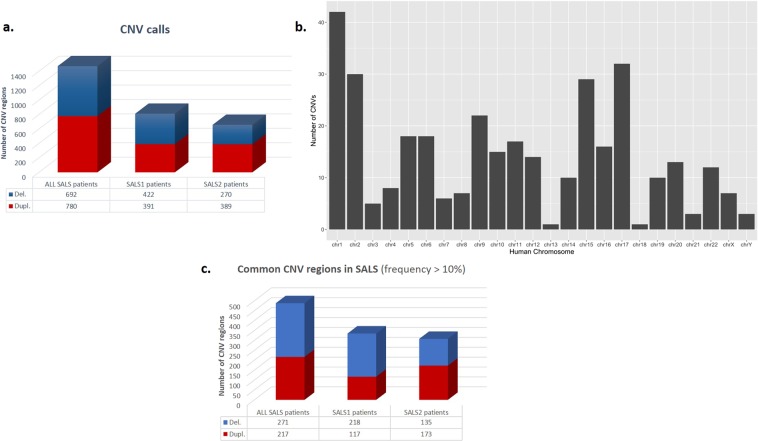
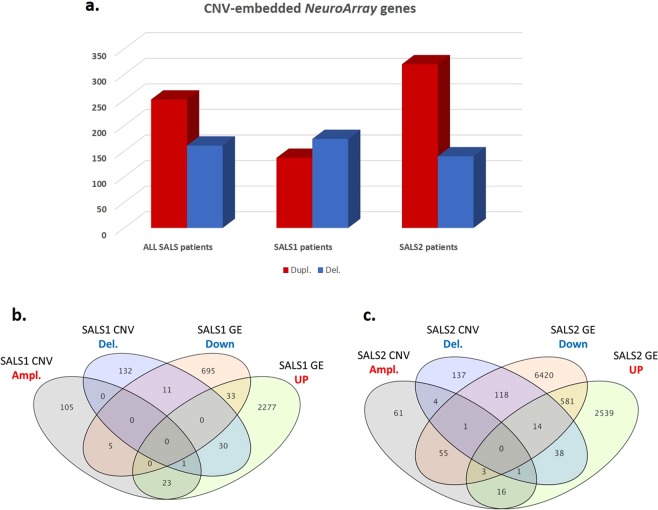
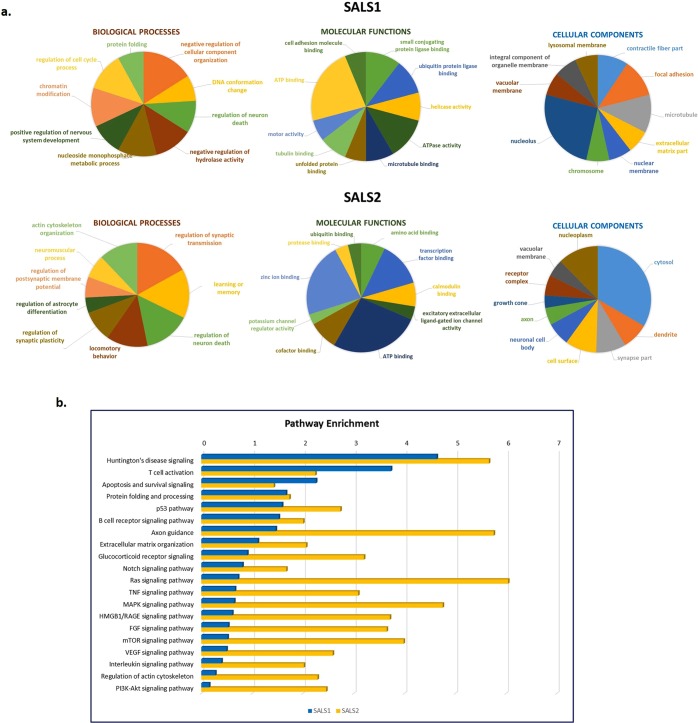
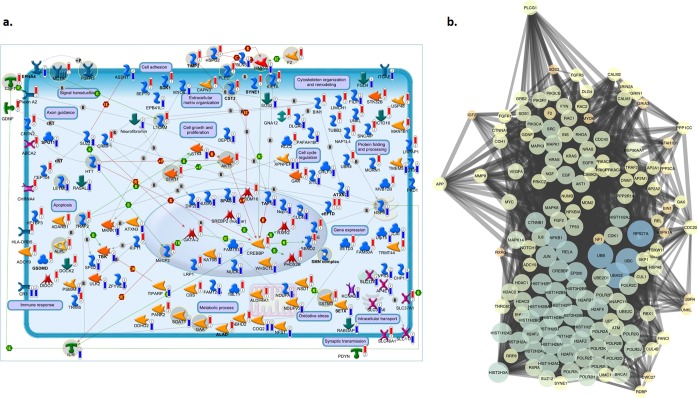
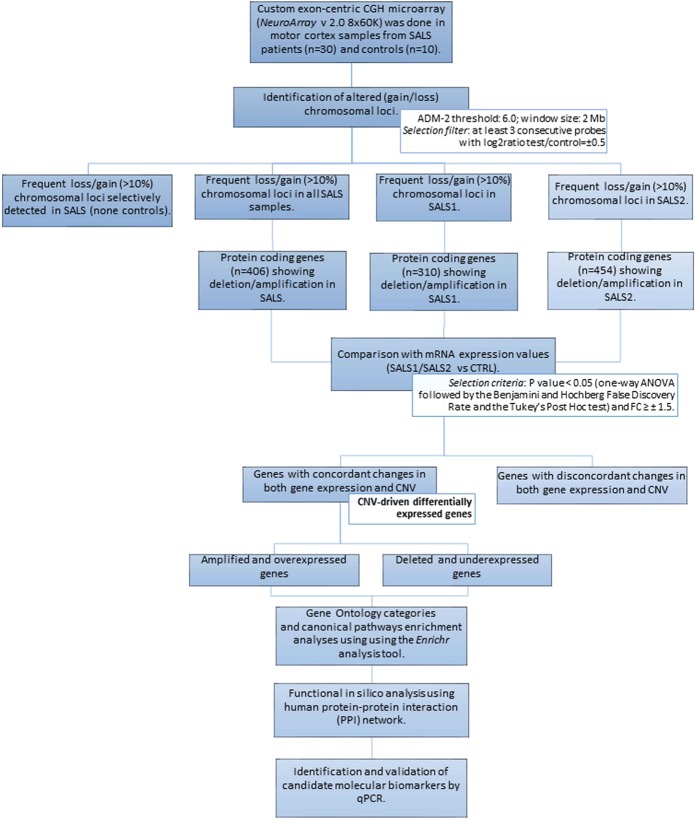
Amyotrophic lateral sclerosis (ALS) is an incurable and fatal neurodegenerative disease. Increasing the chances of success for future clinical strategies requires more in-depth knowledge of the molecular basis underlying disease heterogeneity. We recently laid the foundation for a molecular taxonomy of ALS by whole-genome expression profiling of motor cortex from sporadic ALS (SALS) patients. Here, we analyzed copy number variants (CNVs) occurring in the same patients, by using a customized exon-centered comparative genomic hybridization array (aCGH) covering a large panel of ALS-related genes. A large number of novel and known disease-associated CNVs were detected in SALS samples, including several subgroup-specific loci, suggestive of a great divergence of two subgroups at the molecular level. Integrative analysis of copy number profiles with their associated transcriptomic data revealed subtype-specific genomic perturbations and candidate driver genes positively correlated with transcriptional signatures, suggesting a strong interaction between genomic and transcriptomic events in ALS pathogenesis. The functional analysis confirmed our previous pathway-based characterization of SALS subtypes and identified 24 potential candidates for genomic-based patient stratification. To our knowledge, this is the first comprehensive "omics" analysis of molecular events characterizing SALS pathology, providing a road map to facilitate genome-guided personalized diagnosis and treatments for this devastating disease.


Conflict of interest statement

The authors declare no competing interests.

Figures

Figure 1
Figure 1
Significant copy number regions in SALS patient subgroups. (a) Graphical overview of CNV regions detected in SALS patients by NeuroArray platform. The bars represents the number of regions that may be involved in CNV detected in SALS patients (ADM-2 aberration filter: threshold = 6; Log2 ratio ≥ 0.5 and 3 consecutive interval probes), both with and without the assignment into the hierarchically determined two sets (SALS1 and SALS2). The blue bar represents the number of deleted regions and the red bar represents the number of amplified regions. (b) Chromosome distribution of CNVs detected with high-resolution custom exon-centered NeuroArray aCGH from SALS patients. The horizontal axis represents different chromosomes and the vertical axis represents the number of regions of each chromosome that may be involved in CNV. (c) Graphical overview of recurrent gains or losses (occurred in at least 10% of the SALS patients), both with and without the assignment into the hierarchically determined two sets (SALS1 and SALS2). The blue bar represents the number of deleted regions and the red bar represents the number of amplified regions that occurred at a high frequency (≥10%) in our cohort of SALS patients.
Figure 2
Figure 2
Integrative analysis of DNA copy number and expression variation in SALS patients reveals a good number of overlapping ALS candidate genes. (a) Graphical overview of the most frequent (≥10%) CNV-embedded genes detected in SALS patients, both with and without the assignment into the hierarchically determined two sets (SALS1 and SALS2). (b,c) Venn diagrams compare the number of protein-coding genes obtained from CNV analyses with the genes found to be differentially expressed in SALS1 (b) and SALS2 (c) patients.
Figure 3
Figure 3
Functional enrichment analysis for GO and pathway map ontologies revealed significant biological processes associated with the candidate CNV-driven genes in SALS. (a) Pie charts represent the top 10 enriched (P < 0.05) GO terms for the 70 CNV-encompassed DEGs in SALS1 and SALS2 patients. The GO terms were subdivided into three GO categories: biological processes, molecular functions and cellular components. Enrichment analyses were performed using the Enrichment Analysis tool in Enrichr. For each category, GO terms or biological features represented in CNV-driven differently expressed genes are indicated. (b) Representation of the top 20 most significantly enriched (P value < 0.05) canonical pathway maps associated with the candidate CNV-driven genes in SALS1 and SALS2 patients. A histogram of statistical significance (−log P value) is shown: the list is arranged in descending order with the most significant pathways at the top. The analysis was performed using the MetaCore™ pathway analysis suite.
Figure 4
Figure 4
Definition of SALS subtype-specific genomic signature using pathway and network analyses. (a) A representative illustration showing the functional correlation between SALS associated CNV-driven genes and their biological processes. Interaction map represents the most promising candidate genes showing a positive correlation between gene expression and underlying genomic changes, grouped on the basis of the main biological processes associated with them. The map was created using the MetaCore Pathway Map Creator tool (GeneGo). Gene expression and CNV values are presented on the map as ‘thermometer-like’ figures with SALS1 patients data represented as thermometer #1 and SALS2 patients as #2. Genes associated with overexpression and CNV gain regions are labeled with red dots while genes associated with downregulated expression and homozygous or heterozygous deleted CNVs are labeled with blue dots. A detailed legend for the network objects is shown in the Supplementary Fig. 1. (b) Functional network of known and predicted interactions of the most promising candidate CNV-driven genes. The network was produced by the Search Tool for the Retrieval of Interacting Genes/Proteins (STRING) v10 (http://string-db.org/) using default settings. Proteins are represented by spheres. Lines linking proteins indicate evidence for interactions: a red line indicates the presence of gene fusion (genes that are sometimes fused into single open reading frames); a green line – gene neighborhood (genes that reside within 300 bp on the same strand in the genome); a blue line – co-occurrence (gene families whose occurrence patterns across genomes show similarities); a purple line - experimental evidence (interaction extracted from protein-protein interaction databases); a yellow line – text mining (interaction extracted from scientific literature); a light blue line - database (interaction extracted from curated databases); a black line – co-expression (proteins whose genes are co-expressed in the same or in other species).
Figure 5
Figure 5
Experimental workflow of multi-omics analysis for characterization of CNV-driven differentially expressed genes in SALS patients. The workflow depicts the steps performed in this study, from data acquisition to the visualization, validation and export of results in various output formats. See Materials and Methods section for details.

Similar articles

Cited by

References

    1. Wijesekera LC, Leigh PN. Amyotrophic lateral sclerosis. Orphanet journal of rare diseases. 2009;4:3. doi: 10.1186/1750-1172-4-3. - DOI - PMC - PubMed
    1. Costa J, de Carvalho M. Emerging molecular biomarker targets for amyotrophic lateral sclerosis. Clinica chimica acta; international journal of clinical chemistry. 2016;455:7–14. doi: 10.1016/j.cca.2016.01.011. - DOI - PubMed
    1. Simpson CL, Al-Chalabi A. Amyotrophic lateral sclerosis as a complex genetic disease. Biochimica et biophysica acta. 2006;1762:973–985. doi: 10.1016/j.bbadis.2006.08.001. - DOI - PubMed
    1. Bruijn LI, Miller TM, Cleveland DW. Unraveling the mechanisms involved in motor neuron degeneration in ALS. Annual review of neuroscience. 2004;27:723–749. doi: 10.1146/annurev.neuro.27.070203.144244. - DOI - PubMed
    1. Morello G, Spampinato AG, Cavallaro S. Molecular Taxonomy of Sporadic Amyotrophic Lateral Sclerosis Using Disease-Associated. Genes. Frontiers in neurology. 2017;8:152. doi: 10.3389/fneur.2017.00152. - DOI - PMC - PubMed

Publication types