. 2019 Aug;572(7768):199-204.
doi: 10.1038/s41586-019-1373-2. Epub 2019 Jul 10.

A human liver cell atlas reveals heterogeneity and epithelial progenitors

Affiliations

A human liver cell atlas reveals heterogeneity and epithelial progenitors

Nadim Aizarani et al. Nature. 2019 Aug.

Abstract

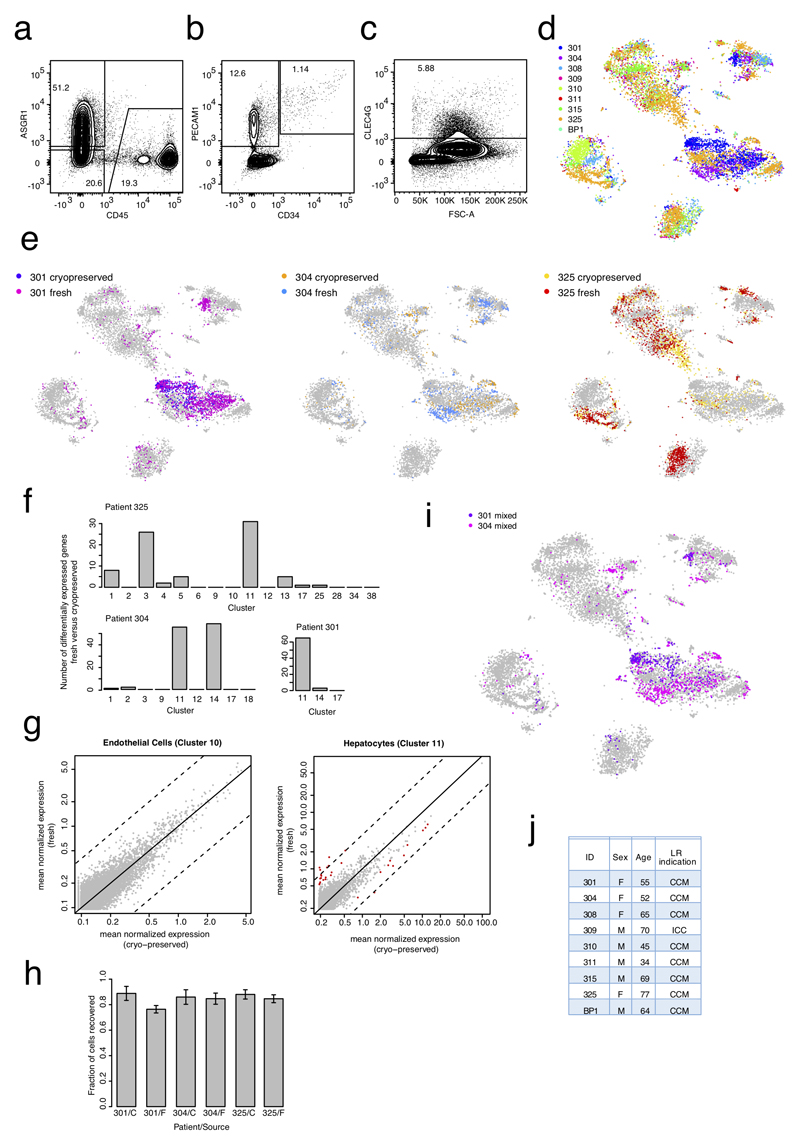
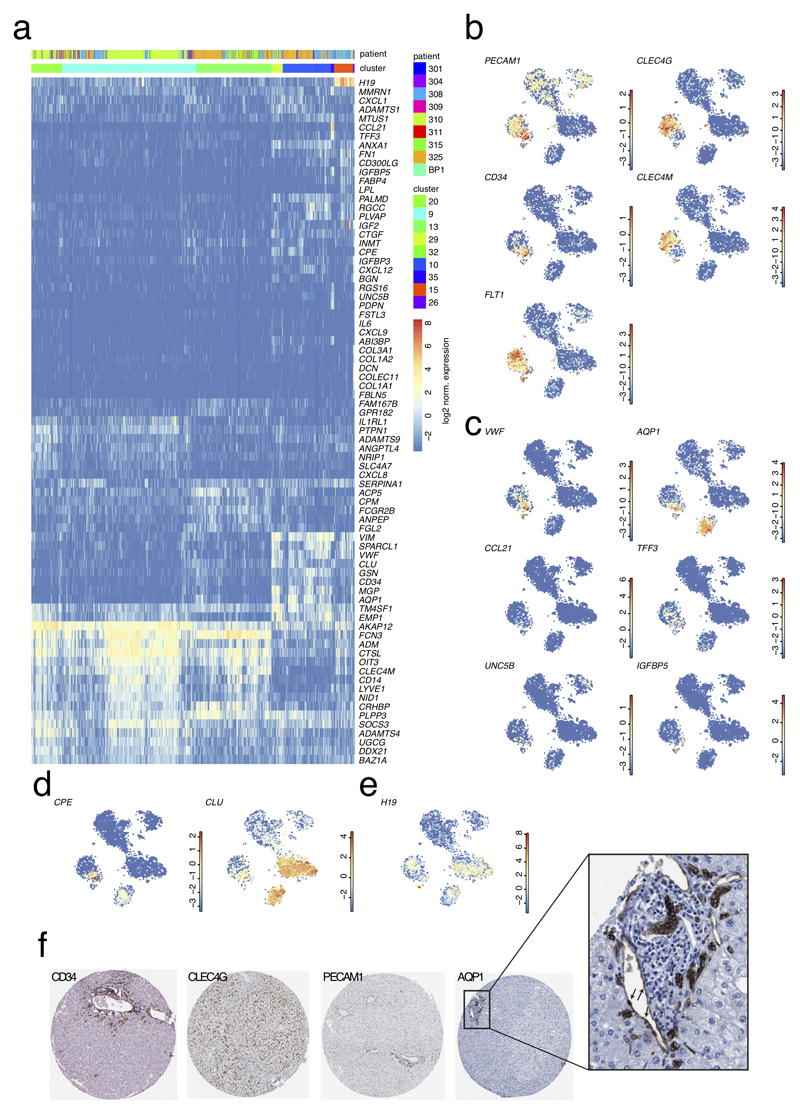
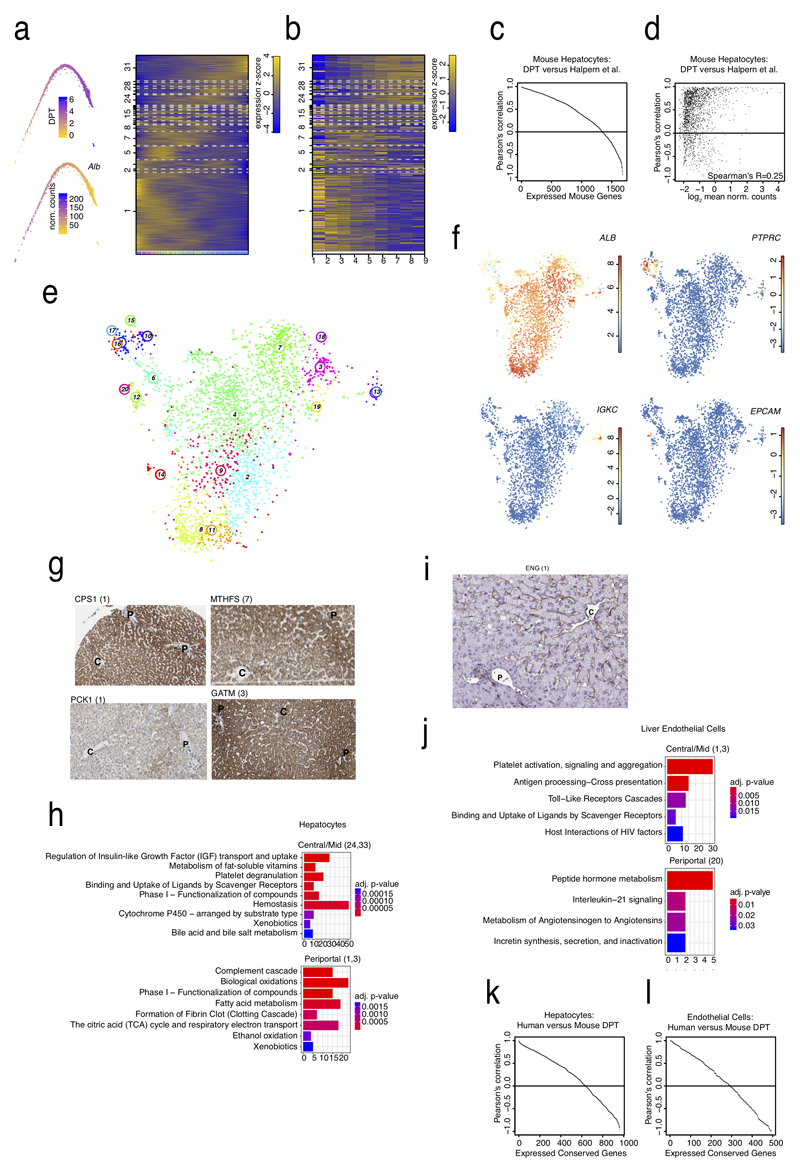
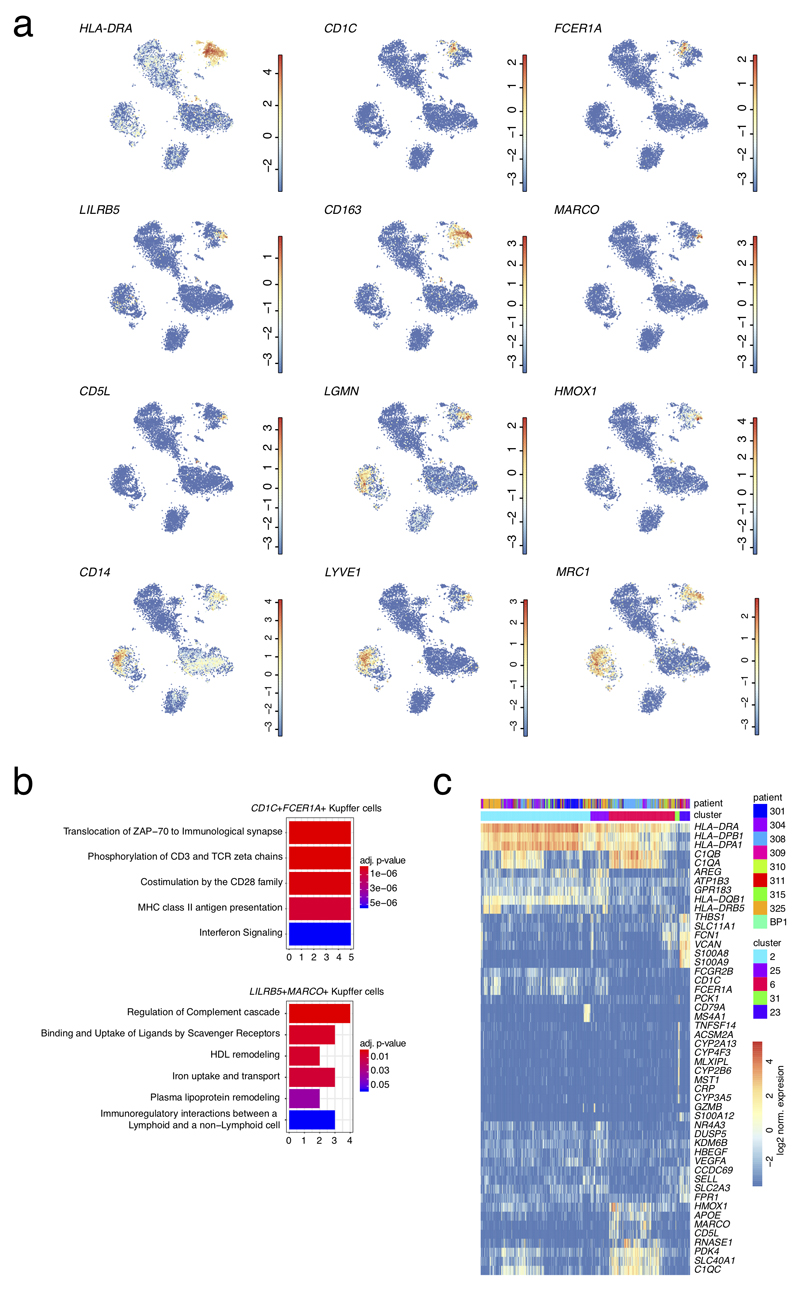
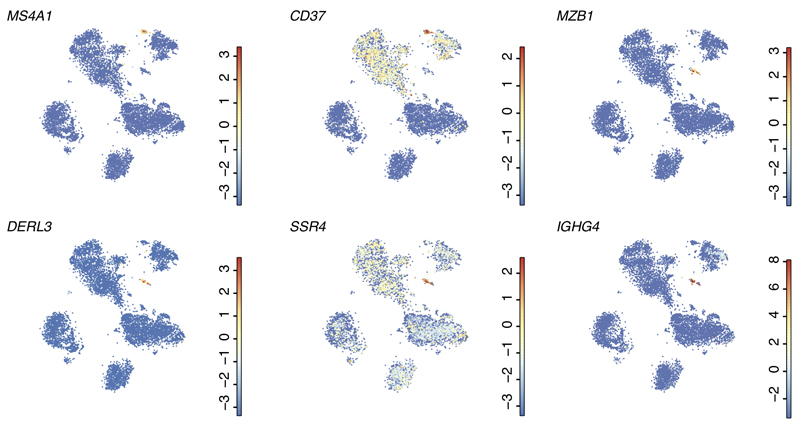
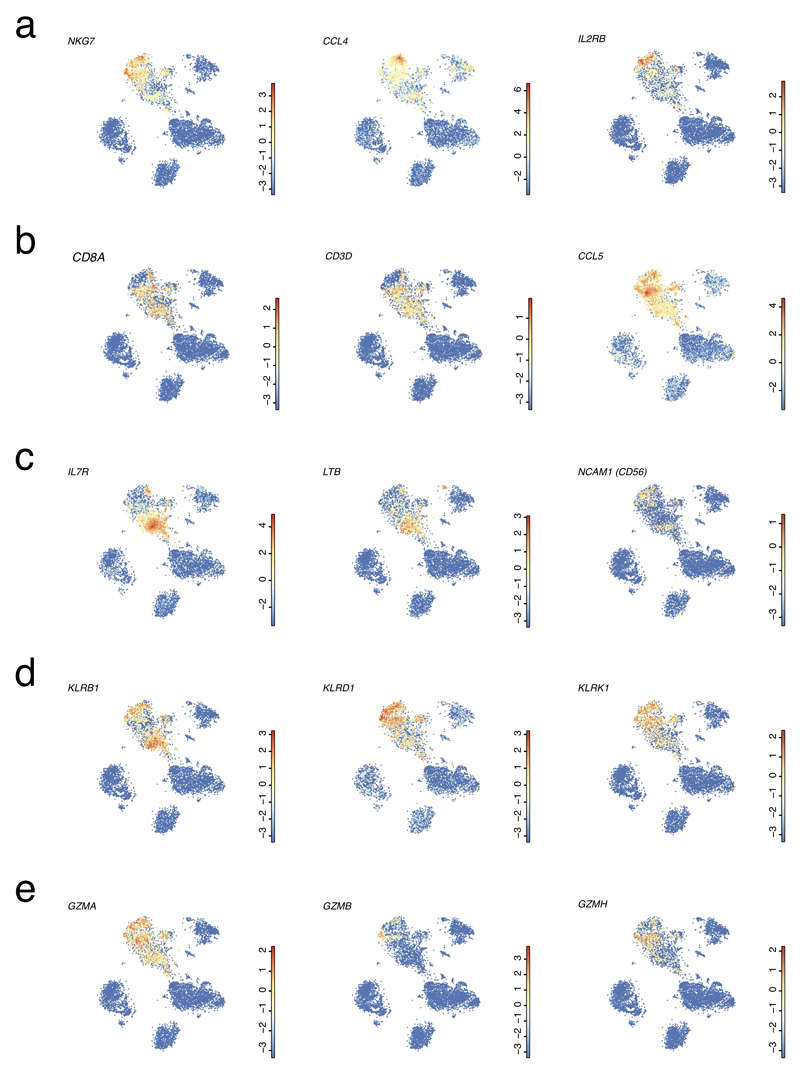
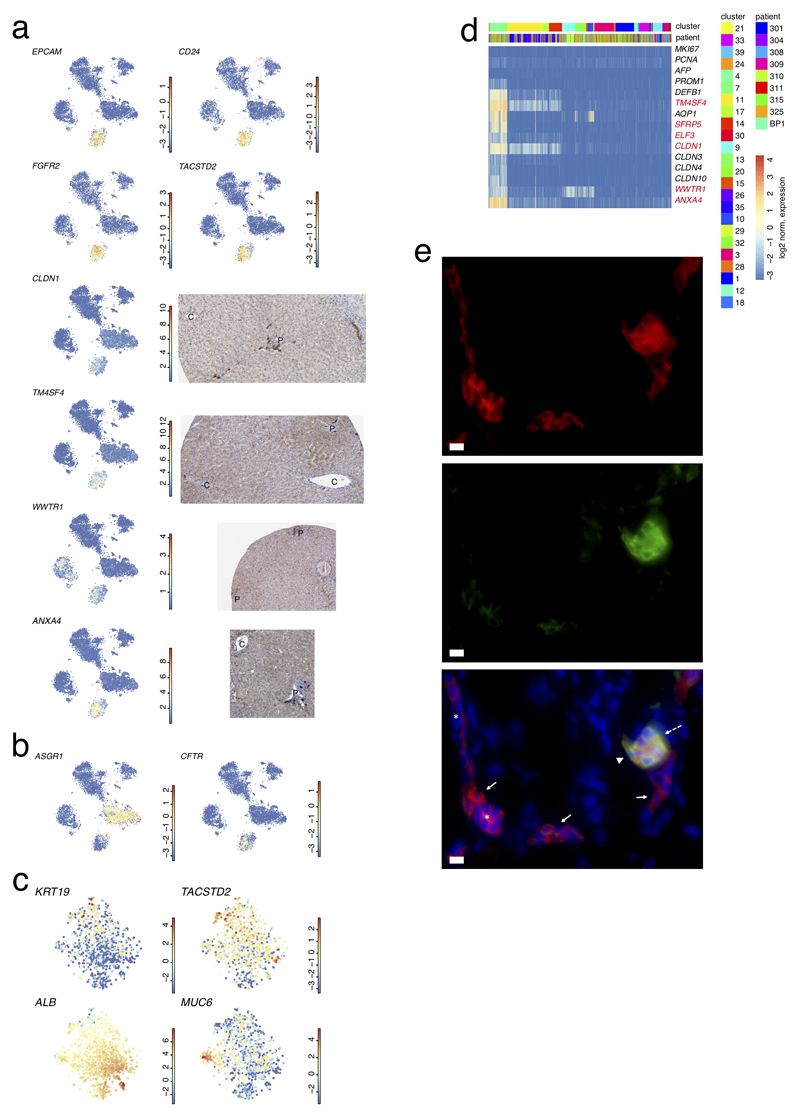
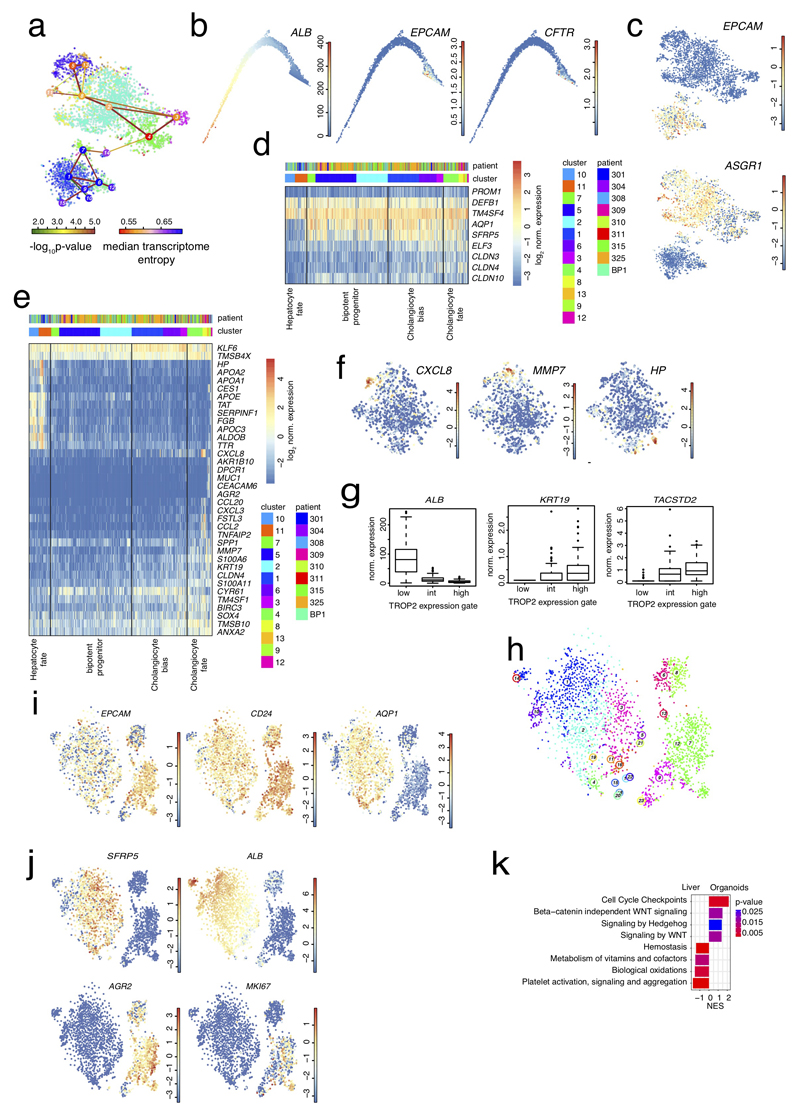
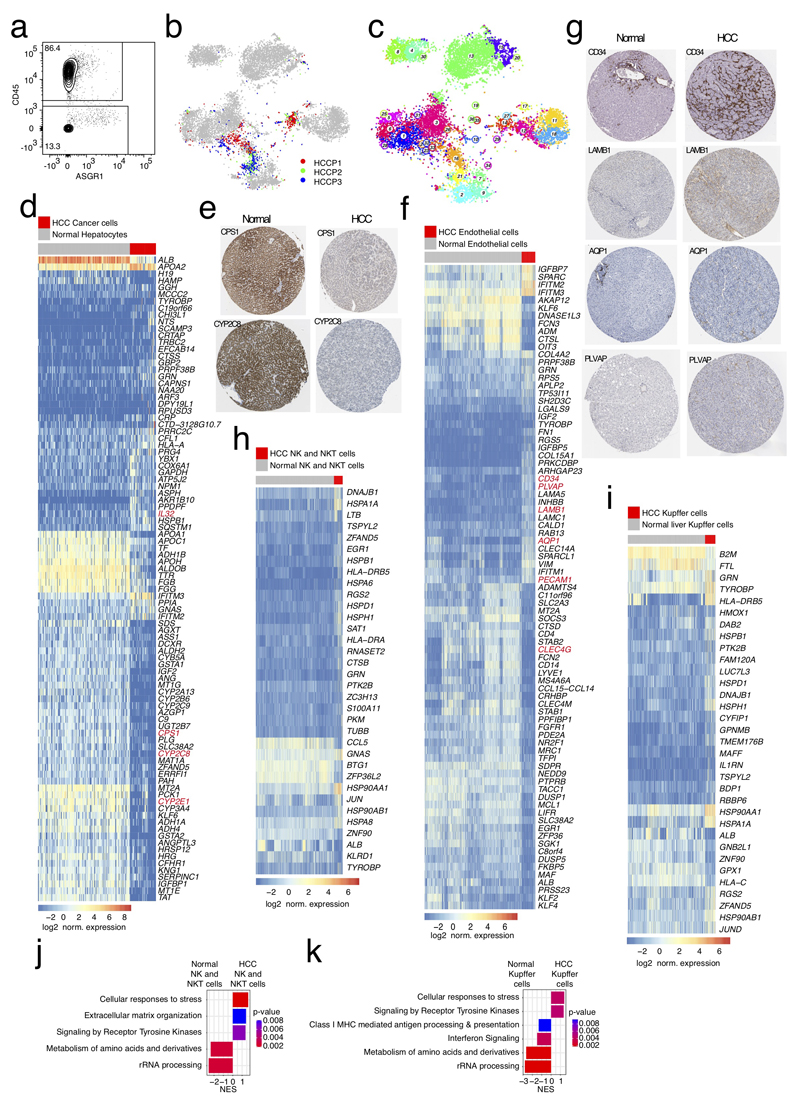
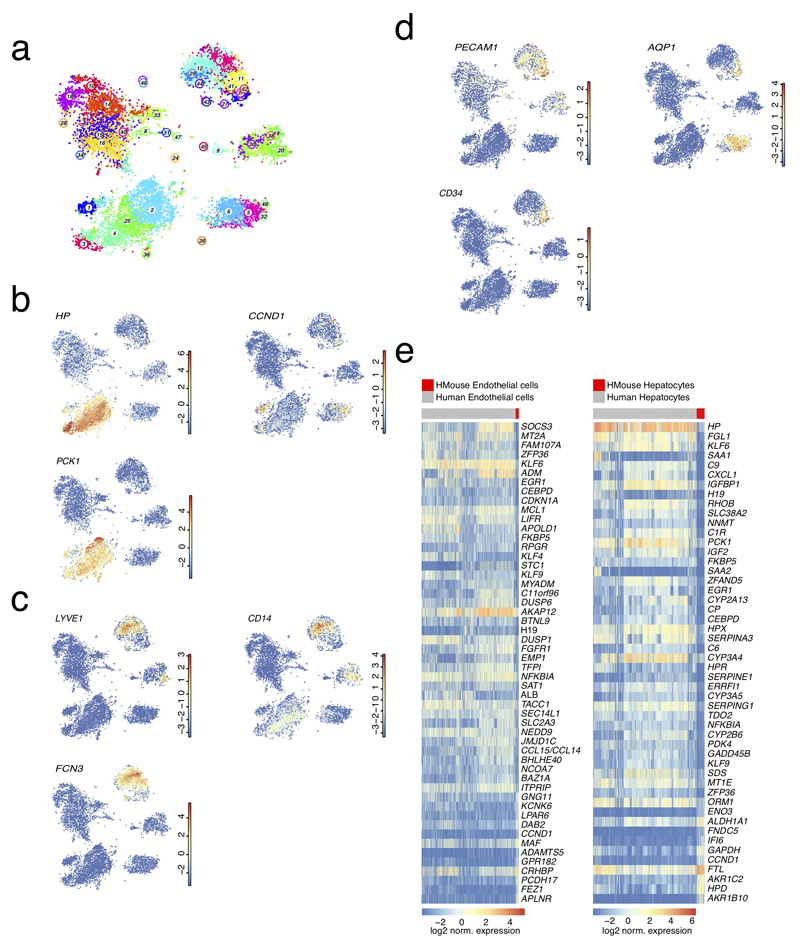
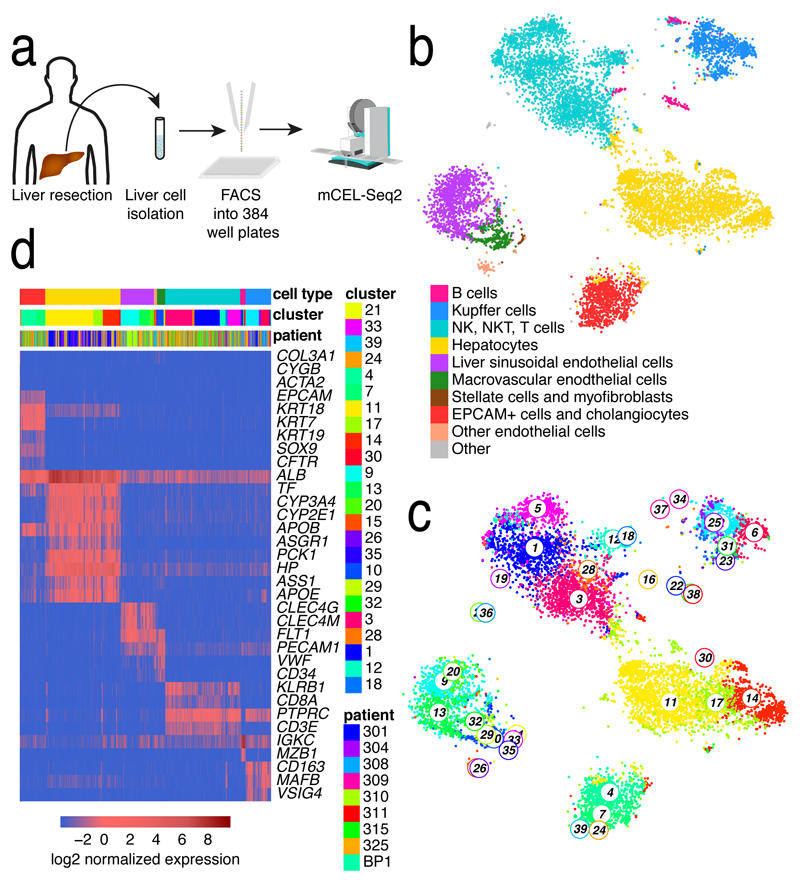
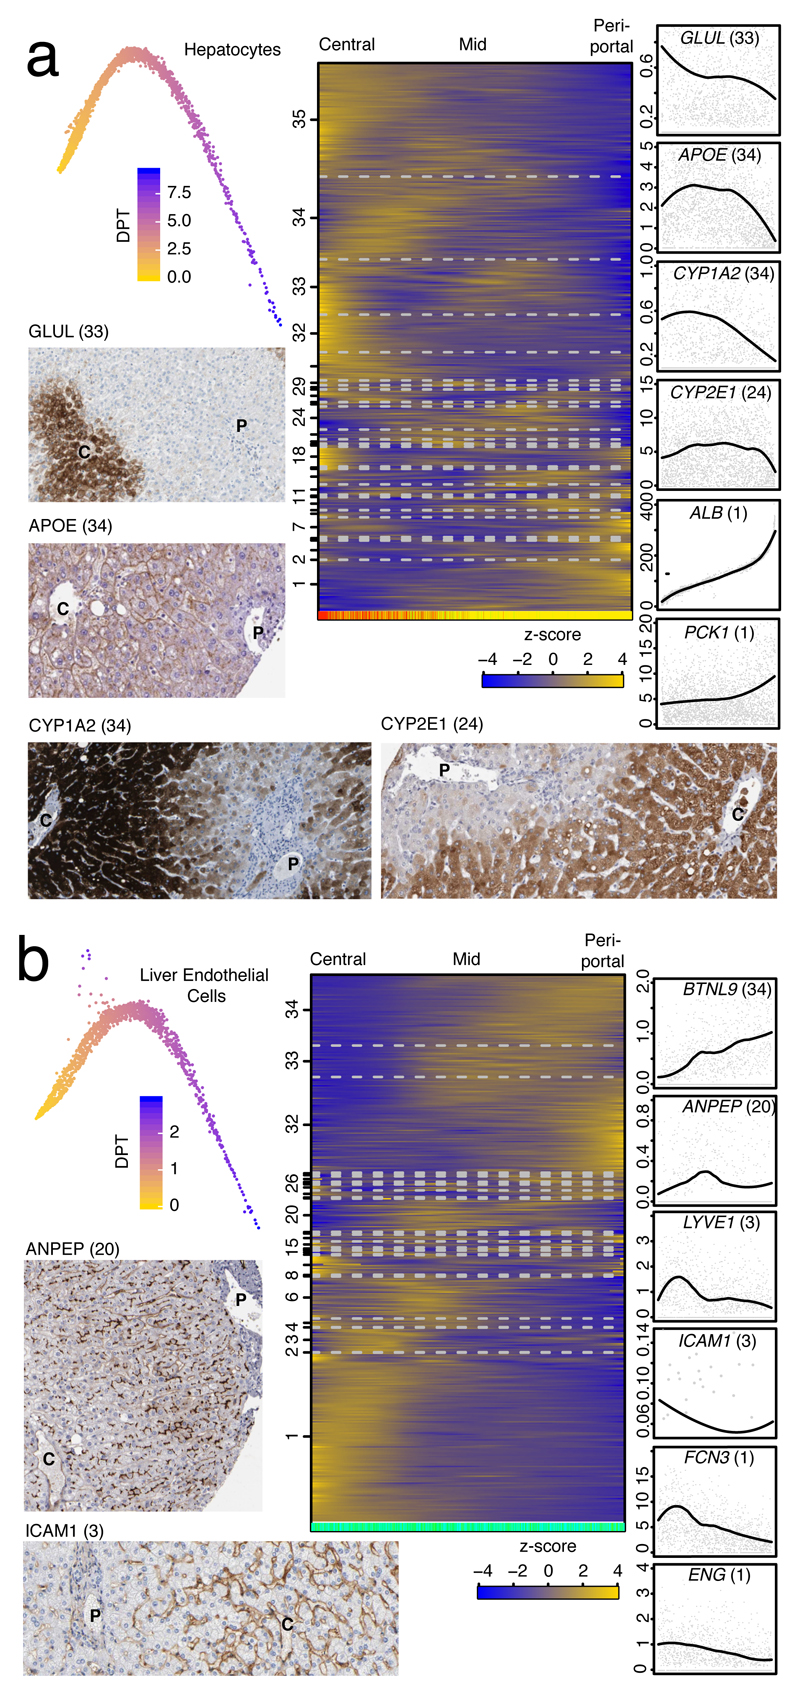
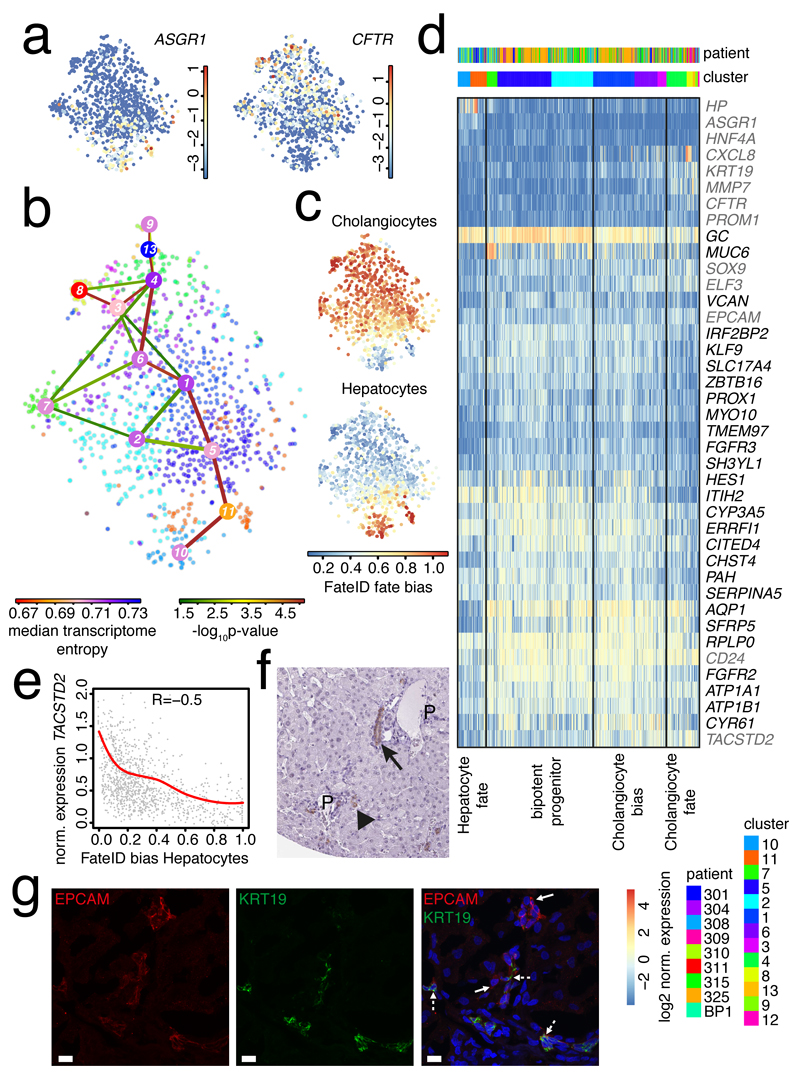
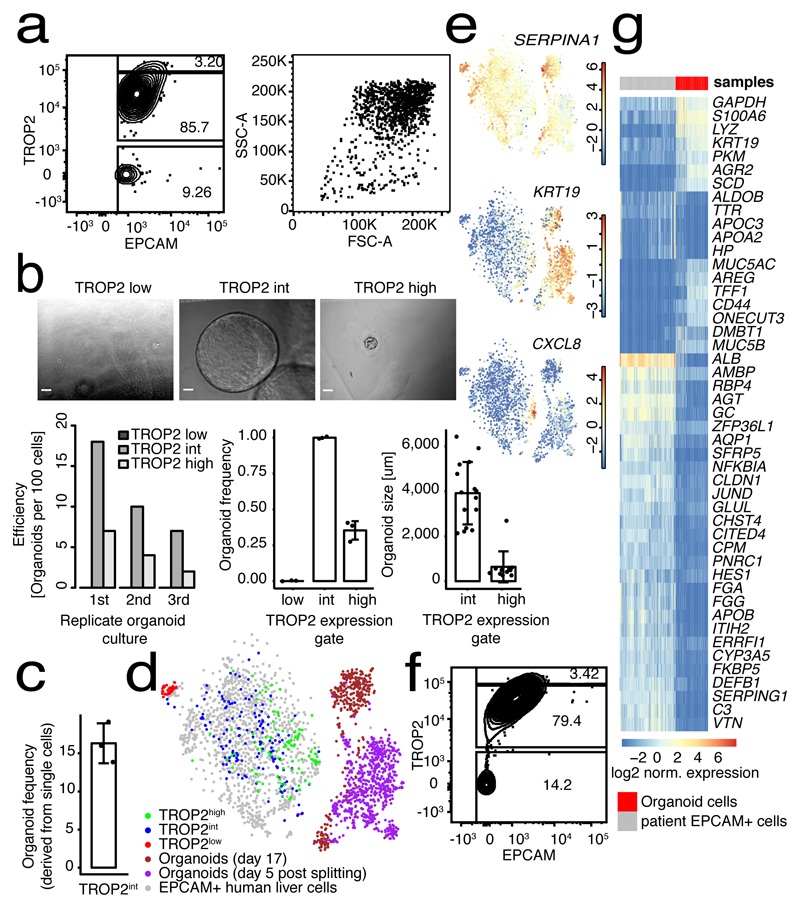
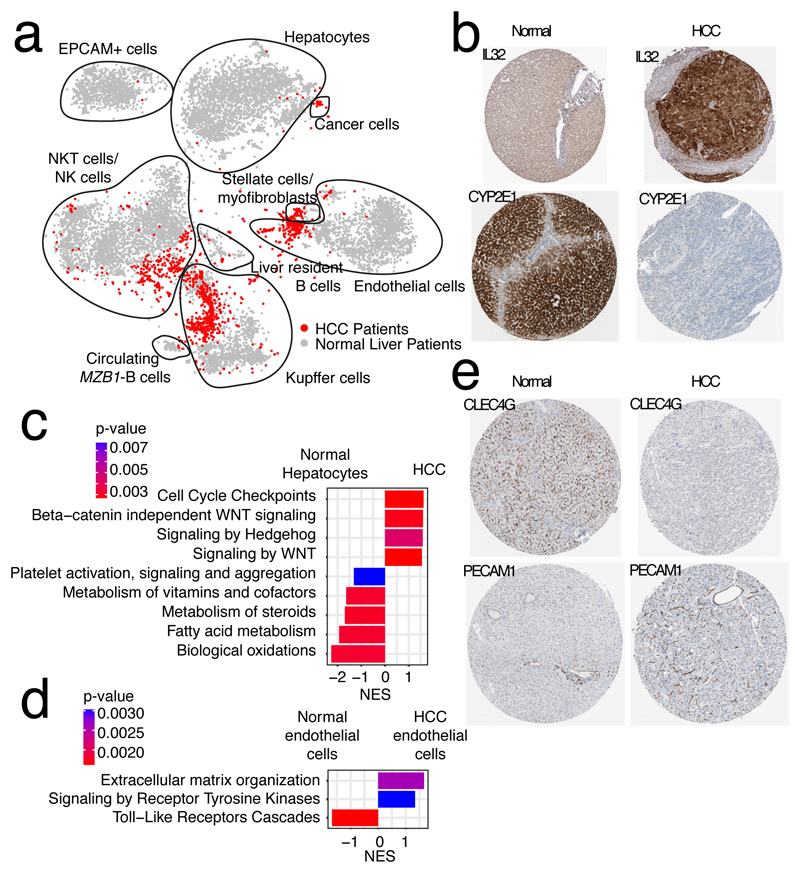
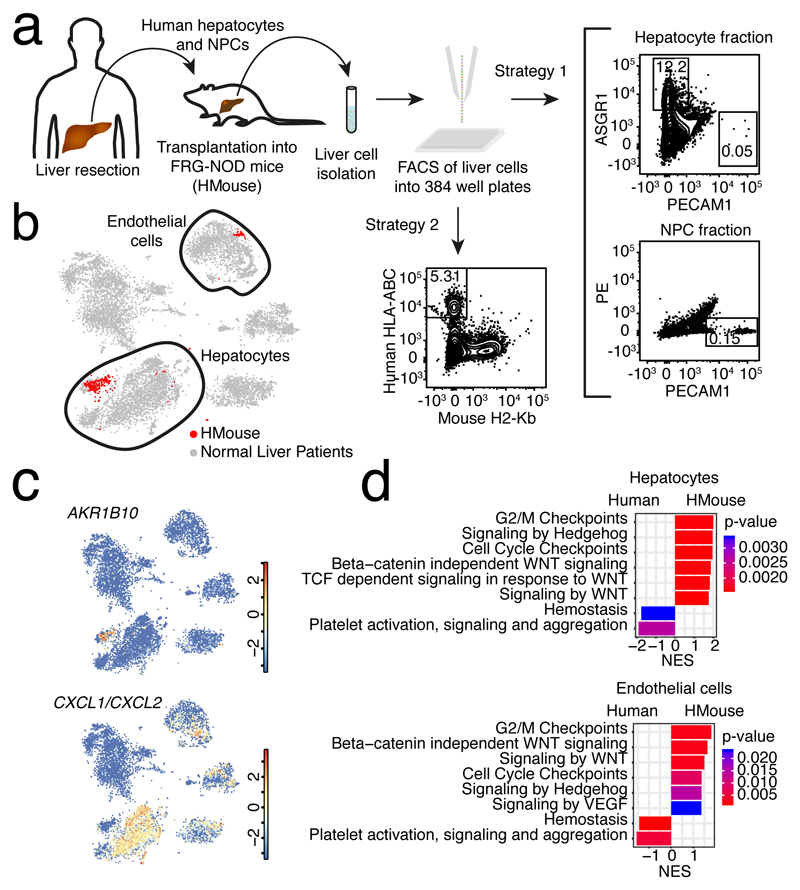
The human liver is an essential multifunctional organ. The incidence of liver diseases is rising and there are limited treatment options. However, the cellular composition of the liver remains poorly understood. Here we performed single-cell RNA sequencing of about 10,000 cells from normal liver tissue from nine human donors to construct a human liver cell atlas. Our analysis identified previously unknown subtypes of endothelial cells, Kupffer cells, and hepatocytes, with transcriptome-wide zonation of some of these populations. We show that the EPCAM+ population is heterogeneous, comprising hepatocyte-biased and cholangiocyte populations as well as a TROP2int progenitor population with strong potential to form bipotent liver organoids. As a proof-of-principle, we used our atlas to unravel the phenotypic changes that occur in hepatocellular carcinoma cells and in human hepatocytes and liver endothelial cells engrafted into a mouse liver. Our human liver cell atlas provides a powerful resource to enable the discovery of previously unknown cell types in normal and diseased livers.


Conflict of interest statement

The authors declare no competing interests.

Figures

Extended Data Figure 1
Extended Data Figure 1. ScRNA-seq analysis of normal liver resection specimens from nine adult patients.
a, FACS plot for CD45 and ASGR1 staining from a mixed fraction (hepatocyte and non-parenchymal cells). b, FACS plot for PECAM1 and CD34 staining from a mixed fraction. c, FACS plot for CLEC4G staining from a mixed fraction. (a-c) n=6 independent experiments. d, t-SNE map showing the IDs of the 9 patients from which the cells were sequenced. Cells were sequenced from freshly prepared single-cell suspensions for patients 301, 304, 325, and BP1, and from cryopreserved single-cell suspensions for patients 301, 304, 308, 309, 310, 311, 315, and 325. Cells were sorted and sequenced mainly in an unbiased fashion from non-parenchymal cell, hepatocyte and mixed fractions of patients 301 and 304. Non-parenchymal and mixed fractions were used to sort specific populations on the basis of markers. CD45- and CD45+ positive cells were sorted from all patients. CLEC4G+ LSECs were sorted by FACS from patients 308, 310, 315, and 325. EPCAM+ cells were sorted by FACS from patients 308, 309, 310, 311, 315, and 325. e, t-SNE map highlighting data for fresh and cryopreserved cells from patients 301, 304 and 325. Although minor shifts of frequencies within cell populations are visible, transcriptomes of fresh and cryopreserved cells co-cluster. Differential gene expression analysis of fresh versus cryopreserved cells, e.g. for endothelial cells of patient 325 in cluster 10 (f), did not reveal any differentially expressed genes. (d,e) n=10,372 cells. f, Barplot showing the number of differentially expressed genes (Benjamini-Hochberg corrected P<0.01; Methods) between fresh and cryopreserved cells within each cluster for patient 325 (upper panel; n=2,248 cells) and patients 304 (n=959 cells) and 301 (n=1,329 cells) (lower panel). Only clusters with >5 cells from fresh and cryopreserved samples were included for the computation. g, Scatter plot of mean normalized expression across fresh and cryopreserved cells from patient 325 in endothelial cells of cluster 10 (no differentially expressed genes, left) (n= 101 cells) and cluster 11 (maximal number of differentially expressed genes across all clusters, right) (n=272 cells). Red dots indicate differentially expressed genes (Benjamini-Hochberg corrected P<0.01; Methods). Diagonal (solid black line) and log2 fold changes of four (broken black lines) are indicated. Almost all differentially expressed genes for cluster 11 exhibit log2-foldchanges < 4. h, Barplot showing the fraction of sorted cells which passed quality filtering (see Methods) after scRNA-seq. Error bars are derived from the sampling error assuming binomial counting statistics. F, fresh samples; C, cryopreserved samples. i, t-SNE map highlighting cells sequenced from mixed plates representing unbiased samples for patient 301 and 304. Without any enrichment strategy, hepatocytes and immune cells strongly dominate and endothelial cells as well as EPCAM+ cells are rarely sequenced. j, Table of patient information. CCM: colon cancer metastasis; ICC: intrahepatic cholangiocarcinoma; LR: liver resection.
Extended Data Figure 2
Extended Data Figure 2. The endothelial cell compartment is a heterogeneous mixture of sub-populations.
a, Expression heatmap of genes up-regulated in endothelial cell clusters (Benjamini-Hochberg corrected P<0.01; n=1,830 cells; Methods). For each cluster the top ten up-regulated genes were extracted and expression of the joint set is shown in the heatmap across all endothelial cell clusters. Genes were ordered by hierarchical clustering. b, Expression t-SNE maps for LSEC and MaVEC markers PECAM1, CLEC4G, CD34, CLEC4M and FLT1. c, Expression t-SNE maps for VWF, AQP1, CCL21, TFF3 and UNC5B and IGFBP5. d, Expression t-SNE maps for CPE and CLU. e, Expression t-SNE map for H19. The color bar in (b-e) indicates log2 normalized expression. (b-e) n=10,372 cells. f, Immunostaining of CD34, AQP1, CLEC4G and PECAM1 in normal liver tissue from the Human Protein Atlas. The portal area for the AQP1 was enlarged to show positive staining of both bile duct cells and portal MaVECs (black arrows).
Extended Data Figure 3
Extended Data Figure 3. Evolutionary conservation of zonation profiles.
a, Diffusion maps highlighting inferred differentiation-pseudotime (dpt) and Alb expression (left), and a self-organizing map for mouse hepatocyte single-cell RNA-seq data(9) (Methods). Compare to Figure 2 for details. b, Heatmap showing the spatial hepatocyte zonation profiles (nine zones) inferred by Halpern et al. using the same ordering of genes as in (a). c, Pearson’s correlation coefficient of zonation profiles inferred by Halpern et al. and our dpt approach after discretizing dpt-inferred zonation profiles into 9 equally-sized bins. 1,347 out of 1,684 genes (80%) above the expression cutoff exhibit a positive correlation between the two methods. d, Pearson’s correlation coefficient as a function of average normalized expression. Negative correlations are enriched at low expression, and Pearson’s correlation of zonation profiles positively correlates with expression (Spearman’s R=0.25; n=1,684 genes). e, t-SNE map of single-cell transcriptomes highlighting the clusters generated by RaceID3, run separately on hepatocytes (cluster 11, 14, and 17 in Fig. 1c). The map reveals a major group of hepatocyte clusters and a number of small cluster co-expressing T cell related genes, B cell related genes, or progenitor genes. f, t-SNE maps highlighting the expression of ALB, the immune cell marker PTPRC, the B cell marker IGKC, and the progenitor marker EPCAM. The color bar indicates log2 normalized expression. Co-expression of hepatocyte and immune cell markers could either indicate the presence of doublets or could be due to spill-over of highly expressed genes such as ALB during library preparation between cells. For the zonation analysis (Figure 2) only cells in clusters 3, 7, 19, 4, 2, 9, 8, and 11 from the map in (e) were included. (e,f) n=3,040 cells. g, Immunostaining of periportal genes CPS1, PCK1, MTHFS, and GATM from the Human Protein Atlas(31) are shown. The zonation module containing each gene in the self-organizing map (Fig. 2a) is indicated in parentheses. The portal tracts and central veins in the immunostainings are denoted as “P” and “C”, respectively. h, Pathways enriched for the genes in hepatocyte central/mid modules 24 and 33 (top; n=659 genes) and periportal modules 1 and 3 (bottom; n=422 genes) are shown (cf. Fig. 2a). i, Immunostaining of central gene ENG from the Human Protein Atlas31 are shown. The zonation module in the self-organizing map (Fig. 2b) is indicated in parentheses. The portal tracts and central veins in the immunostainings are denoted as “P” and “C”, respectively. j, Pathways enriched for the genes in endothelial central/mid modules 1 and 3 (top; n=422 genes) and periportal module 20 (bottom; n=73 genes) are shown (cf. Fig. 2b). (h,j) P-values in the pathway enrichment analysis were calculated based on a hypergeometric model and adjusted using the Benjamini-Hochberg method (Methods). k, Pearson’s correlation coefficient of hepatocyte zonation profiles of orthologues pairs of human and mouse genes. Mouse data are from Halpern et al.(9) (n=967 genes) l, Pearson’s correlation coefficient of endothelial cell (including MVECs and LSECs) zonation profiles of orthologues pairs of human and mouse genes (n=977 genes). Mouse data are from Halpern et al. (13) See Methods for details.
Extended Data Figure 4
Extended Data Figure 4. The human liver contains different Kupffer cell populations.
a, Expression t-SNE maps of the markers for the Kupffer cell subtypes. The color bar indicates log2 normalized expression (n=10,372 cells). b, Major pathways up-regulated in the CD1C+ antigen presenting (n=12 genes) and LILRB5+ metabolic/immunoregulatory (n= 35 genes) Kupffer cell subsets as revealed by Reactome pathway analysis. The number of genes in each pathway is shown on the x-axis. P-values are calculated based on a hypergeometric model and adjusted using the Benjamini-Hochberg method. c, Expression heatmap of genes up-regulated in Kupffer cell clusters (Benjamini-Hochberg corrected P<0.01, Methods). For each cluster the top ten up-regulated genes were extracted and expression of the joint set is shown in the heatmap across all Kupffer cell clusters. Genes were ordered by hierarchical clustering.
Extended Data Figure 5
Extended Data Figure 5. The human liver contains different B cell populations.
Expression t-SNE maps of the markers for the B cell subtypes. The color bar indicates log2 normalized expression (n=10,372 cells).
Extended Data Figure 6
Extended Data Figure 6. Heterogeneity of NK and NKT cells in the human liver.
(a – c), Expression t-SNE maps of inferred markers of (a) cluster 5 (b) cluster 1, and (c) cluster 3. Cluster 5 comprises mainly CD56+ CD8A- NK cells, some of which up-regulate CCL4. Cluster 1 comprises CD56- CD8A+ NKT cells, which upregulate CCL5. Cluster 3 consists of both CD56+ and CD56- CD8A+ NKT cells. Clusters 1 and 3 express T cell receptor components exemplified by CD3D co-receptor expression. CD56 is encoded by NCAM1. d, Differential expression of killer cell lectin-like receptor genes across the different populations shown in (a-c). e, Differential expression of granzyme genes across the different populations shown in (a-c). The color bar in (a-e) indicates log2 normalized expression. (a,e) n=10,372 cells.
Extended Data Figure 7
Extended Data Figure 7. ScRNA-Seq reveals novel marker genes expressed by EPCAM+ cells.
a, Expression t-SNE maps (left) for EPCAM, CD24, FGFR2, TACSTD2, CLDN1, TM4SF4, WWTR1, and ANXA4 (n=10,372 cells) and immunohistochemistry from the Human Protein Atlas (right) for CLDN1, TM4SF4, WWTR1, and ANXA4. The color bar in the expression t-SNE maps indicates log2 normalized expression. b, Expression t-SNE maps for ASGR1 and CFTR (n=10,372 cells). The color bar in the expression t-SNE maps indicates log2 normalized expression. c, t-SNE maps showing expression of KRT19, ALB, TACSTD2 and MUC6 expression in the EPCAM+ compartment (n=1,087 cells). The color bar indicates log2 normalized expression. d, Expression heatmap of proliferation markers (MKI67, PCNA), AFP, and identified markers of the EPCAM+ compartment. Genes highlighted in red correspond to newly identified markers of the EPCAM+ compartment. The heatmap comprises all clusters to show the specificity of the markers for the progenitor compartment. The expression analysis confirms the absence of proliferating and AFP+ cells. e, Immunofluorescence labeling of EPCAM and KRT19 on human liver tissue. EPCAM+KRT19low/- (solid arrow) in the canals of Hering (*) and EPCAM+KRT19+ (broken arrow) cells in the biliary duct (arrowhead) are indicated. Nuclei are stained with DAPI. scale bar, 10μm (n=3 independent experiments).
Extended Data Figure 8
Extended Data Figure 8. The EPCAM+ compartment segregates into different major sub-populations.
a, Separate RaceID3 and StemID2 analysis of the EPCAM+ and the hepatocyte population reveals a lineage tree connecting EPCAM+ cells to mature hepatocytes via an EPCAM+ hepatocyte progenitor cluster (part of the EPCAM+ population in Fig. 3b. Shown are links with StemID2 P<0.05. The node color highlights transcriptome entropy. b, Expression t-SNE map of EPCAM (left) and the hepatocyte marker ASGR1 (right) for the population shown in (a). The color bar indicates log2 normalized expression. c, Two-dimensional diffusion map representation of the population shown in (a) highlighting the expression of the hepatocyte marker ALB (left), EPCAM (center), and the mature cholangiocyte marker CFTR (right). The maps suggest continuous transitions from the EPCAM+ compartment towards hepatocytes and mature cholangiocytes. (b,c) n=3,877 cells. d, Expression heatmap of de novo identified markers of the EPCAM+ compartment, highlighting the expression distribution within clusters of this population only (see Fig. 3). e, Expression heatmap of all genes differentially expressed in the more mature clusters, belonging to the groups denoted as “Hepatocyte fate” and “Cholangiocyte fate”. For each of these clusters, the top ten up-regulated genes (Benjamini-Hochberg corrected P<0.01) were selected, and the joint set of these genes is shown in the figure. f, Expression t-SNE maps of CXCL8, MMP7, and HP. The color bar indicates log2 normalized expression. (d-f) n=1,087 cells. g, Normalized expression counts of ALB, KRT19, and TACSTD2 in cells sequenced from the gates in (Fig. 4a) (n=293 cells). Boxes, interquartile range; whiskers, 5%- and 95%- quantile; data points, outliers. h, t-SNE map of RaceID3 clusters for the organoid cells and EPCAM+ cells from the patients (from Fig. 3) including cells sorted from the gates in (a). i, Expression t-SNE maps of EPCAM, CD24, and AQP1 in the organoids cells and the patients’ EPCAM+ cells. j, Expression t-SNE maps of SFRP5, ALB, AGR2, and MKI67. The color bar indicates log2 normalized expression. k, GSEA of differentially expressed genes between organoid and EPCAM+ liver cells from the patients (Benjamini-Hochberg corrected P<0.01; Methods). NES, normalized enrichment score (h-k) n=11,610 genes.
Extended Data Figure 9
Extended Data Figure 9. Cell types from patient-derived HCC exhibit perturbed gene expression signatures.
a, FACS plot of CD45 and ASGR1 staining on cells from HCC samples (n=3 independent experiments). b, Symbol t-SNE map showing the IDs of the HCC patients (n=11,654 cells). c, t-SNE map showing RaceID3 clusters for normal liver cells co-analyzed with cells from HCC tissues (n=3 patients). d, Expression heatmap of differentially expressed genes between cancer cells from HCC and normal hepatocytes (Benjamini-Hochberg corrected P<0.05 and log2-foldchange >1.6; n=256 cells; Methods). Genes highlighted in red correspond to differentially expressed genes validated by immunohistochemistry. e, Immunostaining of CPS1 and CYP2C8 in normal liver and HCC tissues from the Human Protein Atlas. f, Expression heatmap of differentially expressed genes between endothelial cells from HCC and normal endothelial cells from MaVEC and LSEC clusters. (Benjamini-Hochberg corrected P<0.05; log2-foldchange >1.5; n=1,936 cells; Methods). Genes highlighted in red correspond to differentially expressed genes validated by immunohistochemistry. g, Immunostaining of CD34, LAMB1, AQP1 and PLVAP in normal liver and HCC tissues from the Human Protein Atlas. h, Heatmap of differentially expressed genes between normal and HCC-resident NK and NKT cells (Benjamini-Hochberg corrected P<0.05; n=2754 cells; Methods). i, Heatmap of differentially expressed genes between normal and HCC-resident Kupffer cells (Benjamini-Hochberg corrected P<0.05; n=991 cells; Methods). j, GSEA of differentially expressed genes between normal and HCC-resident NK and NKT cells (n=15,442 genes). k, GSEA of differentially expressed genes between normal and HCC-resident Kupffer cells (n=15,442 genes). (j,k) The bar chart shows the normalized enrichment score (NES) and highlights the p-value (Methods).
Extended Data Figure 10
Extended Data Figure 10. Transplanted human liver cells in a humanized mouse model exhibit a distinct gene signature compared to cells within the human liver.
a, t-SNE map of RaceID3 clusters of liver cells from the patients co-analyzed with cells from the humanized mouse liver model. b, Expression t-SNE maps of the hepatocyte markers ALB. c, Expression t-SNE maps of the endothelial markers CLEC4G. d, Expression t-SNE maps of HP, PCK1 and CCND1. e, Expression t-SNE maps of the liver endothelial cell zonated genes LYVE1, FCN3 and CD14. f, Expression t-SNE maps of PECAM1, CD34 and AQP1. The color bar in (a-f) indicates log2 normalized expression. (a-f) n= 10,683 cells. g, Heatmaps of differentially expressed genes between hepatocytes (n=3,175 cells) and endothelial (n=1,710 cells) cells from the patients (Human Hepatocytes and Human Endothelial cells) and from the humanized mouse model (HMouse Hepatocytes and HMouse Endothelial cells). Benjamini-Hochberg corrected P<0.05; negative binomial (Methods).
Figure 1
Figure 1. ScRNA-seq reveals cell types in the adult human liver.
a, Outline of the protocol used for scRNA-seq of human liver cells. Specimens from liver resections were digested to prepare single cell suspensions. Cells were sorted into 384-well plates and processed according to the mCEL-Seq2 protocol. b, t-SNE map of single-cell transcriptomes from normal liver tissue of nine different donors highlighting the main liver cell compartments. c, t-SNE map of single-cell transcriptomes highlighting RaceID3 clusters, revealing sub-type heterogeneity in all major cell populations of the human liver. d, Heatmap showing the expression of established marker genes for each cell compartment. Color bars indicate patient, major cell type, and RaceID3 cluster. Scale bar, log2-transformed normalized expression. “Other” in the legend of (b) denotes various small populations comprising 22 red blood cells and 46 cells that cannot be unambiguously annotated. “Other endothelial cells” cannot be unambiguously classified as LSECs or MaVECs. (b,c) n= 10,372 cells.
Figure 2
Figure 2. Heterogeneity and zonation of hepatocytes and endothelial cells.
a, Diffusion maps (left) and self-organizing maps (SOM, middle) of single-cell transcriptome-derived zonation profiles for hepatocytes (n=2,534 cells). DPT indicates diffusion-pseudotime and is here interpreted as a spatial zonation coordinate. Zonation profiles of GLUL (central), APOE (midzonal), CYP1A2 and CYP2E1 (central/midzonal), ALB and PCK1 (periportal), and immunostaining (bottom left) of GLUL, APOE, CYP1A2, and CYP2E1 from the Human Protein Atlas31. See Extended Data Fig. 3g for additional stainings. b, Diffusion maps (left) and self-organizing maps (SOM, middle) of the single-cell transcriptome-derived zonation profiles for endothelial cells (n=1,361 cells). Zonation profiles of BTNL9 and ANPEP (periportal), LYVE1 and FCN3 (midzonal), and ICAM1, FCN3, and ENG (central), and immunostaining of, ICAM1 and ANPEP from the Human Protein Atlas (bottom left). (a,b) P, portal tracts; C, central. color bar, RaceID3 cluster. The y-axis of the zonation profiles indicates normalized expression.
Figure 3
Figure 3. Identification of a putative progenitor population in the adult human liver.
a, Expression t-SNE maps of ASGR1 and CFTR for the EPCAM+ compartment only. The color bar indicates log2 normalized expression. b, StemID218 analysis of the EPCAM+ compartment. Shown are links with StemID2 P<0.05. node color, transcriptome entropy. c, FateID analysis of the EPCAM+ compartment highlights populations that are preferentially biased towards hepatocyte progenitors and cholangiocytes, respectively, and reveals similar bias towards both lineages in the central population (clusters 1,2,5,6,7). The color bar indicates lineage probability. d, Expression heatmap of selected hepatocyte markers (HP, ASGR1), mature cholangiocyte genes (KRT19, CFTR, CXCL8, MMP7), additional progenitor markers (highlighted in grey), and all genes up-regulated in the central population (clusters 1,2,5,6,7) within the EPCAM+ compartment (Benjamini-Hochberg corrected P<0.01; foldchange>1.33; Methods). Four compartments are indicated resolving the predicted fate bias (see Extended Data Fig. 8). e, Correlation of nearest-neighbor-imputed (k=5) expression (using RaceID3) of TACSTD2 and hepatocyte bias predicted by FateID. red line, loess regression. R, Spearman’s rank correlation. (a,e) n=1,087 cells. f, Immunostaining of TROP2 from the Human Protein Atlas (n=3 biologically independent samples). The arrow points to a bile duct and the arrowhead to a bile ductule. g. Immunofluorescence labeling of EPCAM and KRT19. EPCAM+KRT19low/- (solid arrow) and EPCAM+KRT19+ (broken arrow) cells are indicated. Nuclei are stained with DAPI. Images are maximum z-stack projections of 6μm. scale bar, 10μm. (n=3 independent experiments).
Figure 4
Figure 4. TROP2int cells are a source of liver organoid formation.
a, FACS plots for EPCAM+ cells showing EPCAM and TROP2 expression (left) and forward and side scatter (right) (n=6 independent experiments). The gates for the three compartments are shown. b, Top panel: Organoid culturing of cells from the TROP2low/-, TROP2int, and TROP2high compartments (n=3 independent experiments). Bottom panel: Number of organoids (left), the organoid frequency relative to the TROP2int compartments (center), and size of organoids (right); n=3 patients, 100 seeded cells each. scale bar, 400 μm. c, Organoid frequency in single-cell cultures of TROP2int cells (n=3 independent experiments, 96-cells each). Due to the small number of cells we were unable to purify single cells from the other gates for culture. (b,c) Measure of center, mean. Error bars, standard deviation. d, Symbol t-SNE map showing the organoid cells, the original EPCAM+ data (from Fig. 3) and the cells sorted from the gates in (a). e, Expression t-SNE maps of SERPINA1, KRT19, and CXCL8. The color bar indicates log2 normalized expression. f, FACS plot of EPCAM and TROP2 expression for organoid cells grown from the TROP2int compartment 17 days after initial culture (n=3 independent experiments). g, Expression heatmap of differentially expressed genes between patient and organoid cells (Benjamini-Hochberg corrected P<0.05 (Method), mean expression >0.7, log2- foldchange >2). (d-e, g) n=2,870 cells.
Figure 5
Figure 5. ScRNA-seq of patient-derived HCC reveals cancer-specific gene signatures and perturbed cellular phenotypes.
a, Symbol t-SNE map highlighting normal liver cells and cells from HCC. n=11,654 cells from n=3 different patients. b, Immunostaining of IL32 and CYP2E1 in normal liver and HCC tissue. c, GSEA for differentially expressed genes between cancer cells from HCC and normal hepatocytes (n=15,442 genes). d, GSEA for differentially expressed genes between normal endothelial cells and endothelial cells from HCC (n=15,442 genes). (c, d) Benjamini-Hochberg corrected P<0.01; NES, normalized enrichment score; Methods. e, Immunostaining of CLEC4G and PECAM1 in normal liver tissue and HCC tissue. All stainings are taken from the Human Protein Atlas(31).
Figure 6
Figure 6. Exploring the gene expression signature of human liver cells in a humanized mouse model.
a, Outline of the transplantation of human liver cells (hepatocytes and non-parenchymal cells) into the FRG-NOD mouse and the two sorting strategies of human cells from the mouse liver. b, Symbol t-SNE map highlighting normal liver cells and cells from the humanized mouse model. The main engrafted cell types (hepatocytes and endothelial cells) are circled. c, Expression t-SNE maps of AKR1B10 and CXCL1/CXCL2. The color bar indicates log2 normalized expression. n=10,683 cells. d, GSEA of differentially expressed genes between hepatocytes and endothelial cells from the humanized mouse (HMouse) and from the patients (Human). n=13,614 genes; Benjamini-Hochberg corrected P<0.01; NES, normalized enrichment score; Methods.

Comment in

References

    1. Michalopoulos GK, DeFrances MC. Liver regeneration. Science. 1997;276:60–66. - PubMed
    1. Ryerson AB, et al. Annual Report to the Nation on the Status of Cancer, 1975-2012, featuring the increasing incidence of liver cancer. Cancer. 2016;122:1312–1337. doi: 10.1002/cncr.29936. - DOI - PMC - PubMed
    1. Grun D, van Oudenaarden A. Design and Analysis of Single-Cell Sequencing Experiments. Cell. 2015;163:799–810. doi: 10.1016/j.cell.2015.10.039. - DOI - PubMed
    1. Herman JS, Sagar, Grun D. FateID infers cell fate bias in multipotent progenitors from single-cell RNA-seq data. Nat Methods. 2018 doi: 10.1038/nmeth.4662. - DOI - PubMed
    1. Grun D, et al. Single-cell messenger RNA sequencing reveals rare intestinal cell types. Nature. 2015;525:251–255. doi: 10.1038/nature14966. - DOI - PubMed

Publication types

MeSH terms