. 2019 Jul;571(7765):424-428.
doi: 10.1038/s41586-019-1374-1. Epub 2019 Jul 10.

m6A enhances the phase separation potential of mRNA

Affiliations

m6A enhances the phase separation potential of mRNA

Ryan J Ries et al. Nature. 2019 Jul.

Abstract

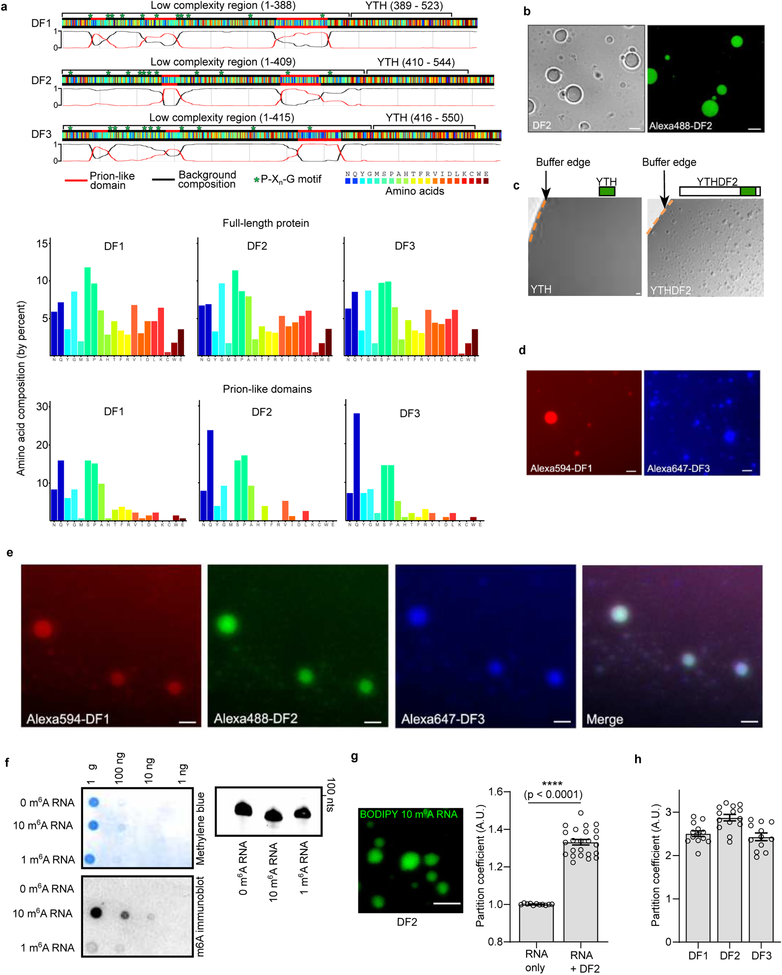
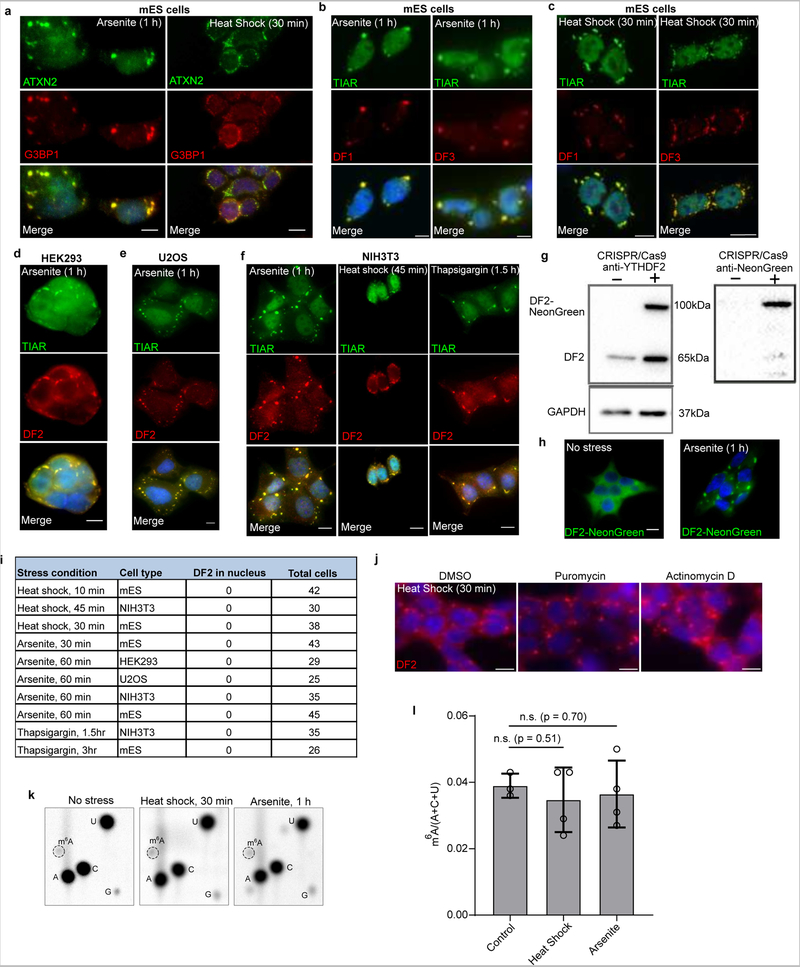
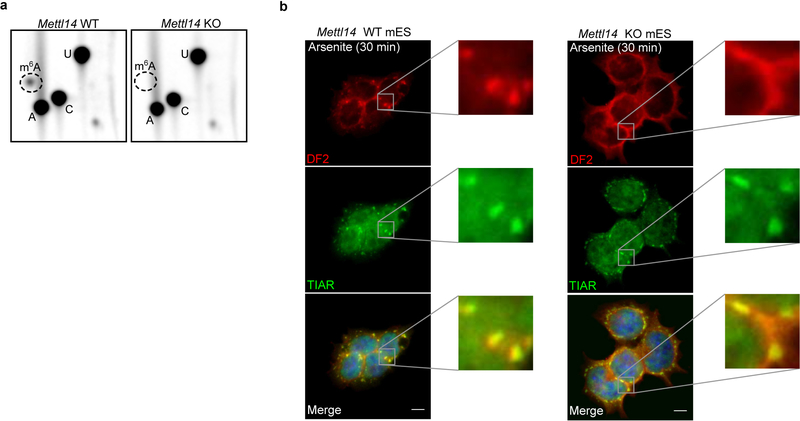
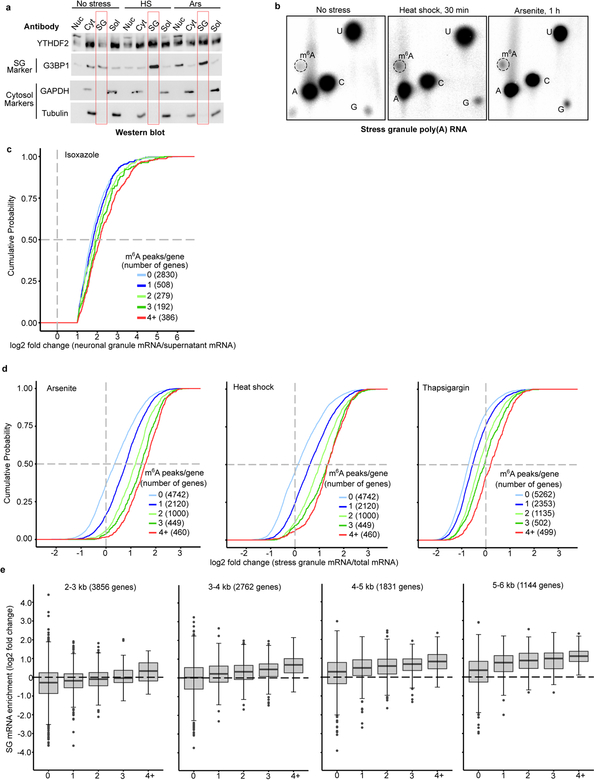
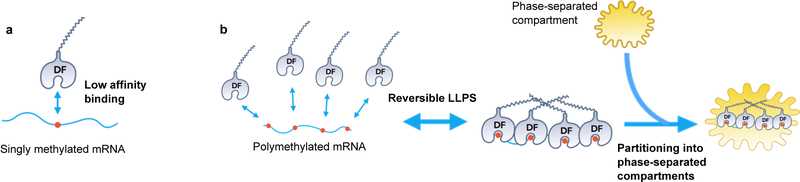
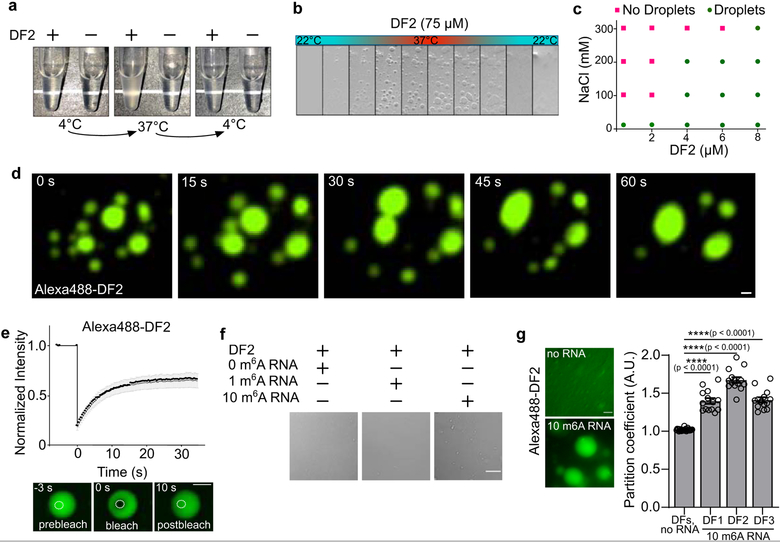
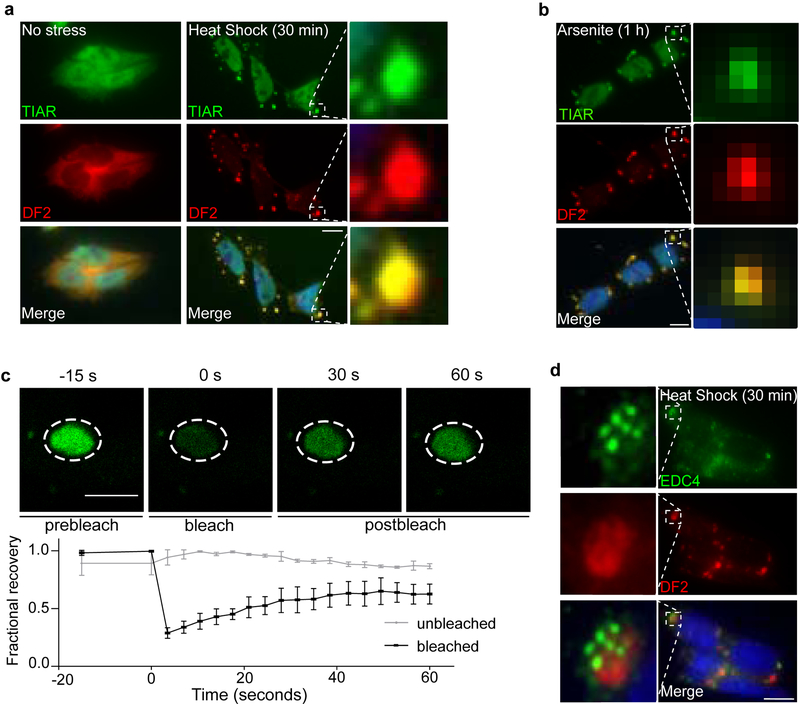
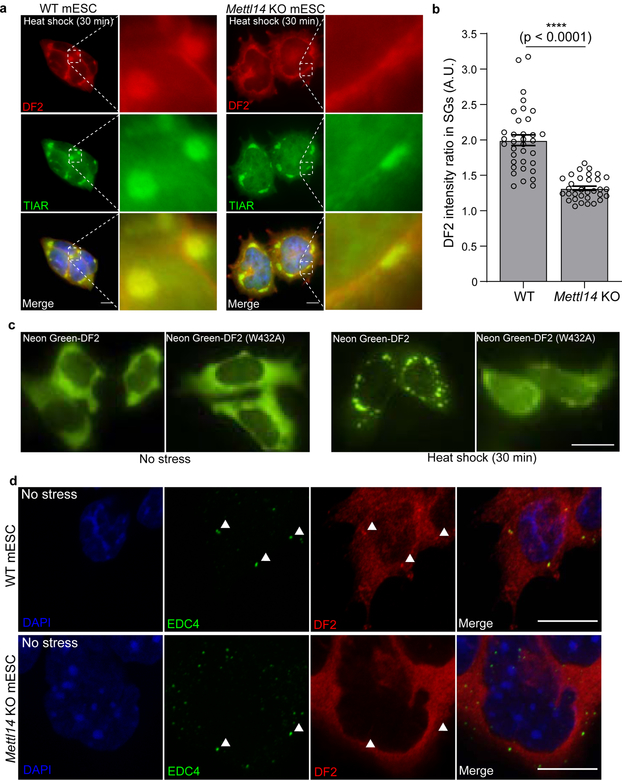
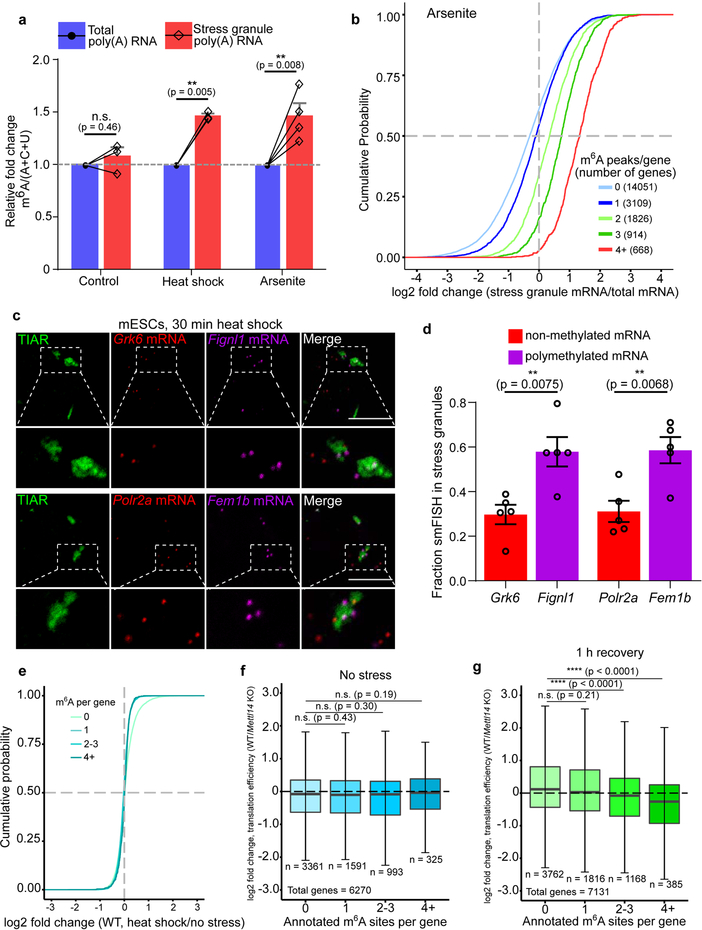
N6-methyladenosine (m6A) is the most prevalent modified nucleotide in mRNA1,2, with around 25% of mRNAs containing at least one m6A. Methylation of mRNA to form m6A is required for diverse cellular and physiological processes3. Although the presence of m6A in an mRNA can affect its fate in different ways, it is unclear how m6A directs this process and why the effects of m6A can vary in different cellular contexts. Here we show that the cytosolic m6A-binding proteins-YTHDF1, YTHDF2 and YTHDF3-undergo liquid-liquid phase separation in vitro and in cells. This phase separation is markedly enhanced by mRNAs that contain multiple, but not single, m6A residues. Polymethylated mRNAs act as a multivalent scaffold for the binding of YTHDF proteins, juxtaposing their low-complexity domains and thereby leading to phase separation. The resulting mRNA-YTHDF complexes then partition into different endogenous phase-separated compartments, such as P-bodies, stress granules or neuronal RNA granules. m6A-mRNA is subject to compartment-specific regulation, including a reduction in the stability and translation of mRNA. These studies reveal that the number and distribution of m6A sites in cellular mRNAs can regulate and influence the composition of the phase-separated transcriptome, and suggest that the cellular properties of m6A-modified mRNAs are governed by liquid-liquid phase separation principles.


Conflict of interest statement

Competing interests S.R.J. declares a competing interest; he is scientific founder, advisor to, and owns equity in Gotham Therapeutics.

Figures

Extended Data Fig. 1.
Extended Data Fig. 1.. Fluorescent labeling of DF2 does not affect liquid droplet formation
a, DF1, DF2 and DF3 exhibit high sequence homology. Shown is a color-coded schematic representation of the aligned amino acid sequence and corresponding prion-like domain disorder propensity plots (red and black traces) for DF1, DF2 and DF3 generated using the PLAAC (Prion-like amino acid composition) tool. The y-axis of the plot represents prion-like regions (1) and regions of background amino acid composition (0). The low complexity domain is a ~40 kDa region that contains glutamine-rich prion-like domains and an abundance of disorder-promoting residues such as proline, glycine, serine, alanine, and asparagine. These domains are also enriched with multiple P-Xn-G motifs that are known to be associated with lower critical solution temperature (LCST). The ~15 kDa YTH domain exhibits high sequence identity between the paralogs, and all YTH domains show identical binding to m6A without preference for any specific sequence context surrounding m6A. The high degree of sequence identity suggests that these proteins might function redundantly in stress granule formation and phase separation. Amino acid composition of the full-length DF proteins and their prion-like domains are shown in the bar charts at the bottom of the panel. b, Liquid droplet formation of Alexa488-labeled DF2. The goal of this experiment is to confirm that labeling DF2 with Alexa488 does not affect liquid droplet formation. Indeed, prior to labeling DF2 with Alexa488, DF2 protein droplets were readily detectable by differential interference contrast microscopy (DIC, left). After labeling, Alexa 488-labeled DF2 protein droplets are still observed by fluorescence microscopy (right). These data indicate that the labeling protocol does not impair droplet formation by DF2. Images are taken from different protein preparations. Experiments were performed in duplicate. Scale bar, 10 μm. c, The intrinsically disordered domain of DF2 is required for phase separation of DF2. Bright field microscopic images of recombinant DF2 lacking the N-terminal intrinsically ordered domain (YTH) and full length DF2 are shown (a schematic of the domain representation is shown above the image). The edge of the buffer (buffer-air interface) is shown with a dashed line. While the full-length YHTDF2 (75 μM) is able to phase separate, at the same concentration and in the same buffer conditions YTH cannot phase separate. This indicates that the intrinsically disordered domain is required for phase separation. Experiments were performed in duplicate. Scale bar, 10 μm. d, DF1 and DF3 phase separate in vitro. Shown are fluorescence microscopy images of Alexa 594-DF1 and Alexa647-DF3. DF1 and DF3 phase separate in vitro as assessed by the formation of protein droplets. Experiments were performed in duplicate. Scale bar, 10 μm. e, DF1, DF2, and DF3 form protein droplets comprising all three proteins. Shown are fluorescence microscopy images of Alexa594, 488, and 647 labeled DF1, DF2 and DF3, respectively. Mixing the three recombinant proteins shows that these proteins can phase separate together to form protein droplets containing all three proteins. Experiments were performed in duplicate. Scale bar, 10 μm. f, Confirmation of in vitro transcribed RNA abundance and methylation status. In vitro transcribed RNAs were serially diluted (1:10) and stained for total RNA by methylene blue staining (top left panel) as well as m6A abundance by immunoblotting using an anti-m6A antibody (bottom left panel). RNA with no m6A gave no signal while RNAs with 10 m6As gave a significantly higher signal in the dot blot than those with 1 m6A. Additionally, in vitro transcribed RNAs were analyzed on a 15% denaturing gel demonstrating the absence of degradation products (right panel). Experiments were performed in duplicate. g, Partition coefficients of fluorescently labeled m6A RNAs with and without DF2. To determine the extent to which multi-m6A-RNAs were recruited into DF droplets, we synthesized a 10-m6A RNAs with a 5’ BODIPY FL fluorescent tag and measured its partition coefficient in the presence of DF2 (7.5 μM, 20 mM HEPES pH 7.4, 300 mM KCl, 6 mM MgCl2, 0.02% NP-40, 10% glycerol). Upon addition of 850 nM BODIPY-10-m6A-RNA, fluorescent RNA-containing droplets appeared in minutes (left image panel). A video of fluorescent DF2:BODIPY-10-m6A-RNA coacervate droplet fusion is shown in Supplementary Video 2. Calculation of partition coefficients in comparison to background fluorescent-labeled RNAs shows that m6A mRNAs are enriched in DF2-containing droplets (right graph panel; RNA only, n = 11; RNA+DF2, n = 24, where n represents distinct droplets in biological replicates). Experiment was performed in duplicate. Bar heights represent mean PCs and error bars represent SEM. ****p < 0.0001, two-sided Mann-Whitney test. Scale bar, 10 μm. h, The partition coefficient of DF proteins increases over time. In this experiment we measured the partition coefficient of DF1, DF2, and DF3 as shown in Fig. 1g. However, here we measured the values after 24 h, unlike the ~5 min time point used in Fig. 1g. The partition coefficients are notably increased compared to the values measured in Fig. 1g. These suggest that droplet formation had not achieved equilibrium at the early time points used in Fig. 1g. Bar heights represent mean partition coefficients and error bars represent SEM. Experiments were performed in duplicate.
Extended Data Fig. 2.
Extended Data Fig. 2.. Assessing which stressors induce stress granules and the localization of DF2 proteins in diverse cell types
a, Oxidative stress and heat shock induce stress granule formation in mouse ES cells. Stress granule formation has not been extensively characterized in mouse ES cells. We therefore wanted to ensure that stress granule composition is the same in mouse ES cells compared to other cell types where stress granules are more frequently studied. To test mouse ES stress granules, we stained with additional markers. Co-immunostaining with ATXN2 (green) and G3BP1 (red) after arsenite treatment (0.5 mM for 1 h) and heat shock (42° for 30 min) in mES cells showed clear labeling of stress granules. The overlay panel shows ATXN2 and G3BP1 overlap (yellow). Thus, stress granules in mouse ES cells appear to have similar markers as stress granules in other cell types. Experiment was performed in triplicate. Scale bar, 10μM. b-c, DF1 and DF3 proteins relocalize to stress granules after heat shock and oxidative stress. DF1, DF2, and DF3 have high sequence similarity and show similar phase separation properties. We therefore wanted to determine if all these proteins associate with stress granules. Co-immunostaining was performed in mES cells with DF1 (red) or DF3 (red) with TIAR (green) after arsenite treatment (0.5 mM for 1 h) or heat shock (42° for 30 min). Along with DF2 shown in Fig. 2, DF1 and DF3 relocalize to stress granules treatment as visualized by the colocalization with TIAR. Scale bar, 10 μm. These findings are consistent with previous proteomic datasets of stress granules. A P-body proteome dataset showed that DF2 was enriched in P-bodies. DF2 ranked 152 among 1900 P-body-associated proteins by abundance. All DF proteins were identified in a group of ~300 stress granule-enriched proteins in a proteomics study of stress granules. In another study, in vivo proximity-dependent biotinylation (BioID)-labeling study of G3BP1 and other stress granule markers showed interactions with all DF proteins. Another APEX labeling study of G3BP1 showed that the YTHDFs are three of the top 42 G3BP1-interacting proteins in the stress granule proteome. Overall, these studies suggest that DF proteins are commonly seen in stress granules, and may be highly abundant relative to other stress granule components. Experiment was performed in triplicate. d-f, DF2 relocalizes to stress granules after arsenite treatment in numerous cell types. The focus of this experiment was to determine if DF relocalization to stress granules is likely to be a universal feature of stress granules. We therefore tested DF localization to stress granules in multiple cell types. Shown is co-immunostaining of HEK293 cells (e), U2OS cells (f), and NIH3T3 cells (g) with DF2 (red) and TIAR (green) after arsenite treatment (0.5 mM for 1 h) and heat shock (42° for 30 min). The overlay panel shows DF2 in stress granules based on its overlap with TIAR (yellow). Experiment was performed in duplicate. Scale bar, 10 μM. g, Confirmation of CRISPR/Cas9 knock in of DF2-NeonGreen. Western blot of HEK293T shows endogenous expression of DF2-NeonGreen. h, Arsenite stress induces DF2-NeonGreen localization into stress granules. We wanted to determine if the ability of DF2 to phase separate in vitro could be actively observed in cells. Unstressed HEK293T cells expressing NeonGreen-tagged DF2 protein show a diffuse cytoplasmic fluorescent signal. Upon arsenite stress (0.5 mM, 1 h), DF2-NeonGreen phase separates into stress granules. This confirms the ability of DF2-NeonGreen to phase separate in cells in response to stress. Experiment was performed in triplicate. Scale bar, 10μm. i, Relocalization of DF2 to the nucleus does not occur after a variety of stresses in various cell types. Because DF2 has been reported to relocalize to the nucleus 2 h after heat shock, we wanted to determine if any nuclear relocalization occurs in our experiments, which were performed immediately after stress. The ‘Stress condition’ column indicates the type and length of stress applied. The ‘Cell type’ column indicates the type of cell that was stressed. The ‘DF2 in nucleus’ column denotes the number of cells that were found to have DF2 in the nucleus immediately after stress. The ‘Total cells’ column indicates the number of cells that was examined for DF2 nuclear relocalization in each experimental condition. In all conditions, there was no cell that showed nuclear DF2 localization. Thus, DF2 localization is primarily in cytosolic stress granules at the time when the stress is terminated. DF2 was not observed to relocalize to the nucleus at any time point or after any stress, including the 2 h post-heat shock conditions described previously. j, DF2 relocalization to stress granules does not require new mRNA or protein synthesis. We wanted to know if an increase in DF2 expression or new m6A formation could be required for stress granule formation after heat shock. To test this, we blocked protein synthesis with puromycin and blocked new transcription with actinomycin D. Actinomycin D blocks m6A formation since m6A formation occurs co-transcriptionally,. DF2 immunostaining in HEK293T cells treated with DMSO (left), puromycin (10 μg/mL, middle), and actinomycin D (2.5 μg/mL, right) for 15 min before and during incubation at 42°C for 30 min. The ability of DF2 to relocalize to stress granules when transcription (actinomycin D) and translation (puromycin) was arrested was assessed by immunofluorescence staining for DF2. In each case, stress granule formation was unaffected, indicating that no new protein synthesis or new methylation is required for stress granule formation. The time course of stress granule formation is rapid, making it unlikely that new protein synthesis or methylation is involved in stress granule formation. Additionally, heat shock is normally associated with inhibited transcription and translation, further suggesting that new protein synthesis and RNA methylation is unlikely to occur in the time course of stress granule formation. Based on all this data, stress granule formation likely utilizes pre-existing patterns of m6A seen in unstressed cells to mediate stress granule formation. Experiment was performed in duplicate. Scale bar, 10 μm. k-l, m6A levels are not significantly altered immediately after arsenite and heat shock stress in NIH3T3 cells. We wanted to test whether m6A levels in mRNA transcripts were altered as a result of cellular stress. NIH3T3 cells were subjected to arsenite (0.5 mM, 1 h) or heat shock stress (43°C, 45 min) and total RNA was extracted immediately after stress treatment. Total RNA was further purified by poly(A) selection to specifically assay m6A levels in mRNA transcripts. Thin layer chromatography (TLC) revealed that there was no significant increase in m6A levels within poly(A) mRNA immediately after either stress condition in three biological replicates (see l). This indicates that cellular stress does not induce an increase or decrease in m6A in the time frame examined. Experiments were performed in duplicate. Bar heights in l represent mean of and error bars represent SEM. Three biological replicates (n = 3) were analyzed in the control, and four biological replicates (n = 4) were analyzed after heat shock and arsenite stress. Stress m6A/(A+C+U) ratios were analyzed with a two-sided student’s t-test.
Extended Data Fig. 3.
Extended Data Fig. 3.. Confirmation of the Mettl14 knockout model and DF2 phase-separation into P-bodies in mES cells
a, Mettl14 knockout (KO) mES cells are depleted in m6A RNA. We sought to independently confirm the depletion of m6A from mRNA in these cells, which were previously shown to have 99% reduction in m6A. The TLC assay selectively quantifies m6A in a G-A-C context, thereby reducing the possibility of contamination of m6A from rRNA or snRNA, which are in a A-A-C or C-A-G context, respectively. The protocol was performed as described previously. Indicated in the TLC chromatograms is the relative position of m6A (dotted circle) and adenosine (A), cytosine (C), and uracil (U). Left and the right panels show radiochromatograms obtained from 2D-TLC of poly(A) RNA from wild-type and Mettl14 knockout cells. No m6A is detectable in the poly(A) RNA derived from Mettl14 knockout cells confirming the efficiency of m6A depletion in these cells. Experiments were performed in duplicate. mES cells are used here since m6A depletion can be readily achieved in Mettl14 knockout mES cells without impairing viability. In contrast, m6A depletion cannot be readily achieved in immortalized cell lines as both Mettl3 and Mettl14 are essential for nearly all cell lines. b, DF2 partitioning into stress granules induced by arsenite is impaired in m6A-deficient cells. This impairment is similar to that shown in stress granules induced by heat shock as seen in Figure 3a. Experiment was performed in triplicate.
Extended Data Fig. 4.
Extended Data Fig. 4.. m6A number is correlated with stress granule enrichment independent of transcript length
a, DF2 is enriched in stress granules after stress. Nuclear (Nuc), cytosolic (Cyt), insoluble RNA-granule enriched (SG, red boxed lanes), and soluble (Sol) protein fractions were isolated from stressed NIH3T3 cells as described previously. G3BP1 was used as a stress granule marker. GAPDH and Tubulin were used as cytosolic and soluble fraction markers. Under non-stressed conditions, DF2 is most abundant in the cytoplasmic and soluble protein fractions. However, upon both arsenite and heat shock stress, the highest levels of DF2 are found in the RNA granule fraction/insoluble fraction, indicating that diverse stresses cause the partitioning of DF2 from the cytosol into stress granules. Experiment was performed in duplicate. b, m6A levels are increased in the mRNAs in the insoluble stress granule-enriched fraction after cellular stress in NIH3T3 cells. Shown are representative TLC plates analyzing m6A levels in mRNAs in the stress granule fraction from the analysis presented in Fig. 4a. Representative plates from the cytosolic fraction are shown in Extended Data Fig. 2l. Experiments were performed in duplicate. c, m6A number correlates with mRNA enrichment in RNA granules in mouse neurons. In these experiments, we used mRNA enrichment data (RNA granule vs. supernatant) derived from a study of isoxazole-induced RNA granules in mouse brain. Enriched mRNAs are defined by a >1 log2 fold change in the RNA granule fraction relative to the supernatant fraction. A cumulative distribution plot of mRNA enrichment was performed for mRNAs classified by the number of called m6A peaks per gene based on single-nucleotide resolution m6A maps generated in mouse brain. Transcripts that contain multiple m6A peaks are enriched relative in RNA granules relative to nonmethylated or singly methylated mRNAs. Original experiments were performed in triplicate. d, The number of m6A sites in an mRNA correlates with its enrichment in stress granules in NIH3T3 cells. In these experiments, we used a dataset of relative mRNA enrichment data (stress granule vs. cytoplasm) generated in a previous study. Assignment of the number of m6A sites in each transcript was based on a mouse embryonic fibroblast MeRIP-seq dataset obtained previously. Analysis was performed as done in Fig. 4c. Polymethylated mRNAs show greater enrichment in stress granules than non-methylated or singly methylated mRNAs for each stress condition. Experiments were performed in triplicate. e, Examination of the effect of m6A on mRNA enrichment using controlled transcript size. Since transcript length positively correlates with stress granule mRNA enrichment (see refs.,), we wanted to control for this feature in our analysis. The same m6A maps and RNA-Seq data from U2OS cells that were used to generate Fig. 4c were used here. Transcripts were binned based on their annotated transcript length (2–3 kb, 3–4 kb, 4–5 kb, 5–6 kb) and further sorted based on the number of annotated m6A sites in each transcript. We found that mRNAs annotated with fixed lengths each showed increased enrichment based on the number of mapped m6A sites. The number of m6A per transcript was a positive predictor of transcript enrichment in stress granules even when controlling for transcript length. Boxplot center represents the median log2 fold change, boxplot boundaries contain genes within a quartile of the median, whiskers represent genes in the upper and lower quartiles, and outliers are presented as dots.
Extended Data Fig. 5.
Extended Data Fig. 5.. Detection of translation in mES cells after stress
a, m6A-mRNA transcript abundance is similar before stress and after stress. We wanted to understand if mRNA transcript abundance was altered as a result of DF mobilization in mES cells after heat shock. In Extended Data Figure 5a, we examined RNA expression before heat shock and compared it to mRNA levels after 30 min of heat shock. Here, we allowed the cells to recover for 1 h, reasoning that this additional time might allow for DF-mediated mRNA degradation. As in Extended Data Figure 5a, we performed RNA-Seq on wild-type mES cells prior to heat shock and after stress, measured after cells were returned to 37oC for 1 hour. The same m6A annotation strategy was used as in Extended Data Figure 5a. As can be seen, the levels of m6A in an mRNA is not correlated with an alteration in mRNA abundance. Log2 fold change values represent the average of four biological replicates. b, Raw counts for ribosome protected fragments. Ribosome-protected fragments were collected from mES cells before stress, immediately after heat shock (42°C, 30 min), and 1 hour after heat shock. The number of ribosome-protected fragments isolated from cells immediately following heat shock was substantially lower than the number of ribosome-protected fragments isolated before stress and 1 hour after stress. This indicates that translation is globally suppressed during the heat shock. As a result of the few ribosome-protected fragments during heat shock, translational efficiency could not be calculated during heat shock. Bar heights represent the totals from four biological replicates in each condition. c, Translation recovers 1 h after heat shock in mES cells. Here we assessed the amount of time needed for translation to be detected after heat shock. mES cells were heat shocked for 30 min at 42°C and translation was assessed at different time points after cessation of heat shock. Translation was monitored by labeling nascent peptides with puromycin. Puromycin was added to cells for 10 min. Immunostaining with an antibody against TIAR and puromycin provides a correlation between the presence of stress granules and the translation state. Non-stressed cells that were not treated with puromycin are shown as a control to establish the background signal (upper left). Unstressed cells treated with puromycin show robust translation (green). At a recovery time of 30 min most cells still contain stress granules (TIAR, red) and translation is absent except in the few cells lacking stress granules. However, at 1 h, translating cells can be readily detected based on puromycin immunoreactivity reactivity. Less than 50% of cells exhibit stress granules. Based on these experiments, we used 1 h as time point for our ribosome profiling experiments. Experiments were performed in duplicate. Scale bar, 10 μm. d, Comparison of the two biological replicates with the highest percentage of CDS-mapped reads in each condition for ribosome profiling experiments. Shown are Pearson’s correlation plots for the replicates used in the translational efficiency analysis shown in Fig. 4f and 4g.
Extended Data Fig. 6.
Extended Data Fig. 6.. Gene ontology of polymethylated and singly methylated mRNAs in U2OS cells.
a-b, Gene ontology of m6A-mRNAs in U2OS cells. U2OS RNA-seq data from Khong, et al. and Me-RIP-seq data from Xiang et al. was used in a gene ontology analysis for polymethylated m6A-mRNAs in U2OS cells. Polymethylated mRNAs were defined as all mRNAs having four or more annotated m6A sites in the MeRIP-seq dataset that were identified in the U2OS RNA-seq (n = 652). Singly methylated mRNAs were defined as mRNAs having one annotated m6A site with the same criteria (n = 2896). Gene ontology was performed using the PANTHER gene ontology (GO) database. The biological process GO search showed enrichment of regulatory and developmental-associated genes in the polymethylated group. The molecular function GO search showed enrichment of protein, ion, enzyme, and adenylyl-binding proteins, and de-enrichment of ribosome structural components. The cellular component GO search showed de-enrichment of mitochondrial and ribosomal proteins, and enrichment of components of the nucleus and cell membrane. mRNAs that met the same inclusion criteria but had zero annotated m6A sites were used as the reference category for the GO analysis (n = 5956). Fold enrichment scores for each GO category are indicated by the colored bars and correspond to the left y-axis. P-values for each GO category are indicated by the dark grey diamonds and correspond to the right y-axis. P-values were determined with Fisher’s exact test and a Bonferroni correction was performed for multiple hypothesis testing.
Extended Data Fig. 7.
Extended Data Fig. 7.. Model of how the properties of m6A-containing mRNAs are determined by their phase separation into intracellular phase-separated compartments
a, Depicted is the binding of DF proteins to singly methylated mRNAs. DF proteins show low affinity interactions with m6A containing mRNAs. Affinities typically range between 0.9–1.1 μM for DF1, DF2, and DF3,. These low affinities suggest that DF proteins would not be able to form a stable bimolecular interaction with singly methylated RNA. The low affinity can now be understood in the context of phase separation. Their weak interactions with RNA are likely stabilized by interactions between their low-complexity domains, and subsequent phase separation. Notably, all m6A sites in cytosolic mRNAs appear to have an equal propensity to bind each DF protein. Thus, any m6A residue may be sufficient to enhance the phase-separation potential of an mRNA. However, higher-level information, such as the spacing of m6A sites, as well as other mRNA-bound proteins with low-complexity domains, may affect the efficiency of phase separation. b, Polymethylated mRNAs bind multiple DF proteins leading to phase separation. When multiple DF proteins bind to a polymethylated mRNA, their interactions with the mRNA are stabilized by DF-DF interactions mediated by their low-complexity domains. These complexes may be reversible and undergo an assembly/disassembly equilibrium. However, if P-bodies, neuronal granules or stress granules are present, the DF-mRNA complexes can partition into these structures. m6A-mRNA is then regulated by the regulatory proteins and functional properties of these distinct structures. If an mRNA has a single m6A site, the mRNA can still partition into phase-separated structures, especially if RNA-RNA interactions or other RNA-protein interactions can facilitate phase separation. The DF low-complexity domain could interact with these non-DF proteins to enhance mRNA partitioning. Overall, interactions between DF proteins and m6A mRNAs probably lower the saturation concentration for their incorporation within stress granules, enhancing their partitioning over non-methylated mRNAs
Fig. 1.
Fig. 1.. Polymethylated m6A RNAs trigger liquid-liquid phase separation of DF proteins
a, Tubes containing either buffer only or recombinant DF2 (75 μM, 20 mM HEPES pH 7.4, 300 mM KCl, 6 mM MgCl2, 0.02% NP-40) were heated from 4°C to 37°C. DF2 phase separates when heated; this is reversible upon cooling. b, Time-lapse of bright field microscopy images of DF2 droplets (75 μM) subjected to temperature gradient. Temperature was increased (1oC per minute) from 22oC to 37°C enabling the formation of protein droplets. Lowering the temperature back to 22°C causes disassembly. c, Phase diagram of DF2 in the presence of different concentrations of NaCl (0, 100, 200, and 300 mM) showing salt dampens its phase separation potential. Green circles: protein droplets present; pink squares, no protein droplets observed in the buffer. d, Alexa488-DF2 (75 μM) was imaged by fluorescent microscopy over 1 min. A video of Alexa488-DF2 droplet fusion can be seen in Supplementary Video 1. Scale bar, 10 μm. e, Changes in Alexa488-DF2 droplet fluorescence intensity after photobleaching were plotted over time (top panel). Background was subtracted from the fluorescence measurement. The black curve represents the mean of the fluorescence intensity in the photobleached region of interest in distinct droplets (n = 8). The grey bars indicate SEM. Representative images of fluorescence recovery are shown in the bottom panel. Scale bar, 10 μm. f, A 65-nt RNA containing 10 m6As (570 nM) induces DF2 (25 μM) to rapidly form small liquid droplets, while RNA containing 1 m6A or 0 m6A, does not cause significant DF2 phase separation. Scale bar, 10 μm. g, Adding RNA containing 10 m6A sites (425 nM) enhances the phase separation of DFs (15 μM) in solution (bottom left panel). For the no RNA condition, partition coefficients (PC) were calculated immediately before the addition of m6A-containing RNA (right panel; DFs, no RNA mean PC = 1.0; DF1, n = 8; DF2, n = 10; DF3, n = 9; total n = 27. Partition coefficients for the DFs were measured shortly after the addition of ten m6A RNAs and mean DF PCs increased measurably (right panel; DF1 mean PC = 1.40, n = 14; DF2 mean PC = 1.67, n = 14; DF3 mean PC = 1.41, n = 14 droplets) within minutes of adding 10 m6A RNA. Error bars represent SEM. n represents the number of droplets from technical replicates. Two-sided Mann-Whitney test. Scale bar, 10 μm.
Fig. 2.
Fig. 2.. DF proteins exhibit liquid-like properties in cells and relocalize during stress
a-b, Co-immunostaining of DF2 (red) and the stress granule marker TIAR (green) in mouse embryonic stem cells (mES) before and after incubation at 42°C for 30 min (a) or treatment with sodium arsenite (0.5 mM) for 1 hr (b). DF2 relocalizes to stress granules as visualized by its colocalization with TIAR (yellow) in the overlay panel (bottom). Scale bar, 10 μm. c, DF2-NeonGreen was endogenously expressed in HEK293 cells using CRISPR/Cas9 knock-in and treated with arsenite (0.5 mM, 1 h). DF2-NeonGreen partitioned into arsenite-induced stress granules. Photobleaching of stress granules is followed by rapid recovery of fluorescence, indicating that DF2-NeonGreen can actively phase separate in cells. The line traces represent mean fractional fluorescence (unbleached n = 3; bleached n = 3). Error bars represent SEM. Scale bar, 5 μm. d, P-bodies have been shown to be adjacent to stress granules. We observed the proximity between P-bodies and stress granules by co-immunostaining of the stress granule marker DF2 (red) and the P-body marker EDC4 (green) in mES cells after heat shock stress (42°C, 30 min). DF2-labeled stress granules and P-bodies are in close proximity but do not colocalize. Scale bar, 10 μm.
Fig. 3.
Fig. 3.. m6A enhances the ability of DF proteins to partition into intracellular phase-separated compartments
a, Stress granules form normally in both in wild-type and Mettl14 knockout mES cells, which lack m6A-mRNA, but DF2 relocalization in Mettl14 knockout mES cells is delayed. Co-immunostaining was performed using the stress granule marker TIAR (green) and DF2 (red) after heat shock (42°C, 30 min) or arsenite stress (0.5 mM, 30 min). Scale bar, 10 μm. b, DF2 fluorescence intensity ratios in stress granules (DF2 intensity inside TIAR-stained granules vs. DF2 intensity in the cytoplasm immediately adjacent to TIAR-stained granules) in wild type and Mettl14 knockout mES cells (WT, n = 35; Mettl14 knockout, n = 32) shows delayed DF2 co-localization in Mettl14 knockout cells. n represents stress granules from biological replicates. Bar height represents mean fluorescence intensity ratios and error bars represent SEM. Two-sided Mann-Whitney test. c, The localization of a DF2 mutant with ~10-fold reduced affinity for m6A (W432A) to stress granules is impaired after heat shock (42°C, 30 min). The W432A mutation disrupts the m6A-binding tryptophan cage in DF2. Plasmids expressing NeonGreen-tagged DF2 and NeonGreen-tagged DF2 W432A were transfected into wild-type mES cells and images were taken before (left panels) and after (right panels) heat shock (42°C, 30 min). Scale bar, 10 μm. d, Co-immunostaining showed well-defined overlap between DF2 (red) and P-bodies as labeled by EDC4 (green) in wild-type mES cells. However, in Mettl14 knockout cells, this co-localization was markedly reduced and DF2 appeared more diffusely cytosolic. Representative images from slices of a confocal Z-stack are shown. Individual P-bodies and their region of overlap with DF2 are indicated by white arrowheads. Scale bar, 10 μm.
Fig. 4.
Fig. 4.. m6A-containing mRNAs are enriched in distinct DF-containing RNA granules.
a, m6A levels were measured in poly(A) RNA purified from the insoluble stress granule-enriched fraction and poly(A) RNA prepared from total NIH3T3 cellular extracts. m6A levels were quantified by TLC, and normalized to the combined intensities of A, C, and U. In non-stressed cells, there was no significant difference in the level of m6A-mRNA in the total cellular or insoluble RNA fraction. In contrast, a significant increase in m6A levels was detected in the stress granule fraction obtained from either heat shocked or arsenite stressed cells (control, n = 3; heat shock, n = 4; arsenite n = 4, where n represent biological replicates). Bar heights represent mean normalized fold change of m6A/(A+C+U) in poly(A) RNA from stress granules over poly(A) RNA from total cellular RNA (control = 107.6, heat shock = 149, arsenite = 150.3). Filled circles and diamonds with lines represent paired biological samples. Error bars represent SEM. Paired two-sided student’s t-test performed on unnormalized m6A/(A+C+U) fractions between control and stress conditions. b, A cumulative distribution plot of mRNA enrichment in U2OS arsenite-induced stress granules was plotted for mRNAs classified by the number of annotated m6A peaks per transcript. Transcripts with 0 m6A peaks (i.e., non-methylated) are slightly depleted in stress granules relative to total cellular RNA. However, transcripts that contain 2 or more m6A peaks show enrichment in stress granules in proportion to the number of m6A sites. c-d, m6A-containing mRNAs show higher enrichment in stress granules compared to non-methylated mRNAs using smFISH. Two mRNAs that lack any annotated m6A sites (Grk6 and Polr2a) were matched with m6A-containing mRNAs of similar length and abundance (Fignl1 and Fem1b, four m6A sites each). Grk6 and Polr2a are not enriched in stress granules (d). Fignl1 and Fem1b are markedly more enriched within stress granules as a fraction of total smFISH puncta after heat shock stress. In c, representative slices from confocal Z-stacks are shown to demonstrate localization. In d, images (Grk6/Fignl1 n = 5 images, 26 cells, 2 biological replicates; Polr2a/Fem1b n = 5 images, 24 cells, 2 biological replicates) were analyzed to assess mRNA localization to stress granules. Bar heights represent mean fraction of stress granule-localized smFISH puncta and error bars represent SEM. Two-sided student’s t-test. e, mRNA expression levels were determined by RNA-seq before and after heat shock (42°C, 30 min). Transcript abundance was unaltered for non-methylated, singly methylated, and polymethylated m6A-mRNAs. f, Translation efficiency prior to heat shock was calculated using matched ribosome profiling and RNA-seq data and compared for each mRNA in the methylated state (i.e., in wild-type cells) versus the nonmethylated state (i.e., in Mettl14 knockout cells). Transcripts were binned based on the annotated number of m6A sites as in e. Boxplot center represents the median log2 fold change, boxplot boundaries contain genes within a quartile of the median, and whiskers represent genes in the upper and lower quartiles. m6A-mRNAs in wild type mES cells did not display a significant difference in translational efficiency compared to Mettl14 knockout mES cells. n denotes the number of genes in each bin. Binned gene groups with annotated m6A sites were compared to genes with no m6A sites with an unpaired two-sided student’s t-test. g, Translation efficiency in wild-type and Mettl14 knockout mES cells subjected to 30 min of continuous heat followed by 1 hr recovery at 37°C. Only polymethylated transcripts showed significantly decreased translation efficiency. The effect of m6A is determined by comparing the translation efficiency for each transcript in the methylated form (wild-type cells) relative to the same transcript in the nonmethylated form (Mettl14 knockout cells). The same binning and m6A annotation strategy were employed as in f. Boxplots are presented as in f. n denotes the number of genes in each bin. Binned gene groups with annotated m6A sites were compared to genes with no m6A sites with an unpaired two-sided student’s t-test.

References

    1. Perry RP & Kelley DE Existence of methylated messenger RNA in mouse L cells. Cell 1, 37–42 (1974).
    1. Desrosiers R, Friderici K & Rottman F Identification of methylated nucleosides in messenger RNA from Novikoff hepatoma cells. Proc Natl Acad Sci U S A 71, 3971–3975 (1974). - PMC - PubMed
    1. Meyer KD & Jaffrey SR Rethinking m6A Readers, Writers, and Erasers. Annu Rev Cell Dev Biol 33, 319–342 (2017). - PMC - PubMed
    1. Patil DP, Pickering BF & Jaffrey SR Reading m(6)A in the Transcriptome: m(6)A-Binding Proteins. Trends Cell Biol (2017). - PMC - PubMed
    1. Nott TJ, Petsalaki E, Farber P, Jervis D, Fussner E, Plochowietz A, Craggs TD, Bazett-Jones DP, Pawson T, Forman-Kay JD & Baldwin AJ Phase transition of a disordered nuage protein generates environmentally responsive membraneless organelles. Mol Cell 57, 936–947 (2015). - PMC - PubMed

Publication types