. 2019 Jul;571(7765):398-402.
doi: 10.1038/s41586-019-1383-0. Epub 2019 Jul 10.

Notum produced by Paneth cells attenuates regeneration of aged intestinal epithelium

Affiliations

Notum produced by Paneth cells attenuates regeneration of aged intestinal epithelium

Nalle Pentinmikko et al. Nature. 2019 Jul.

Abstract

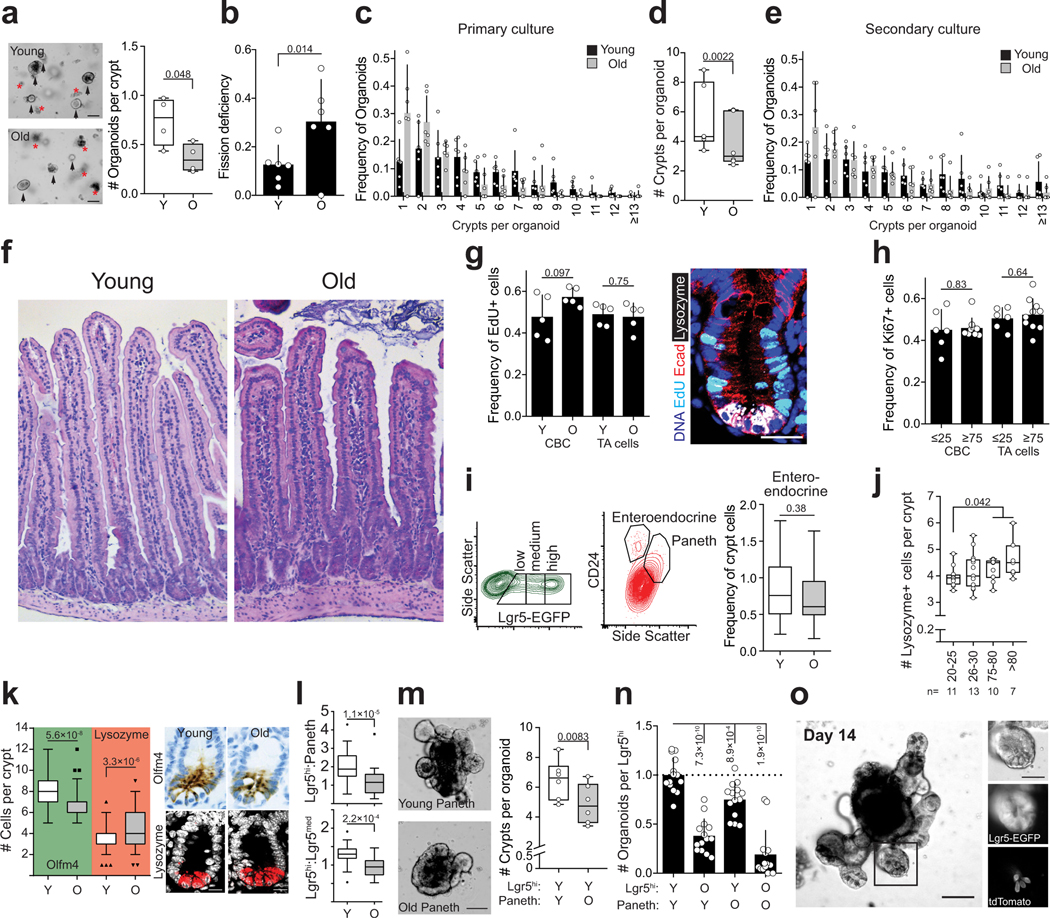
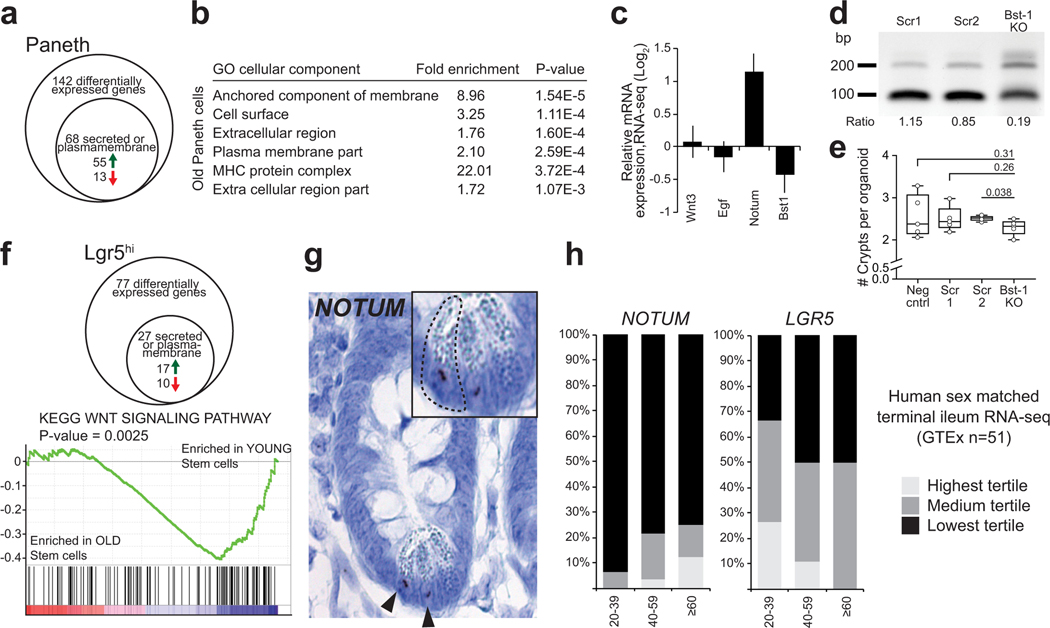
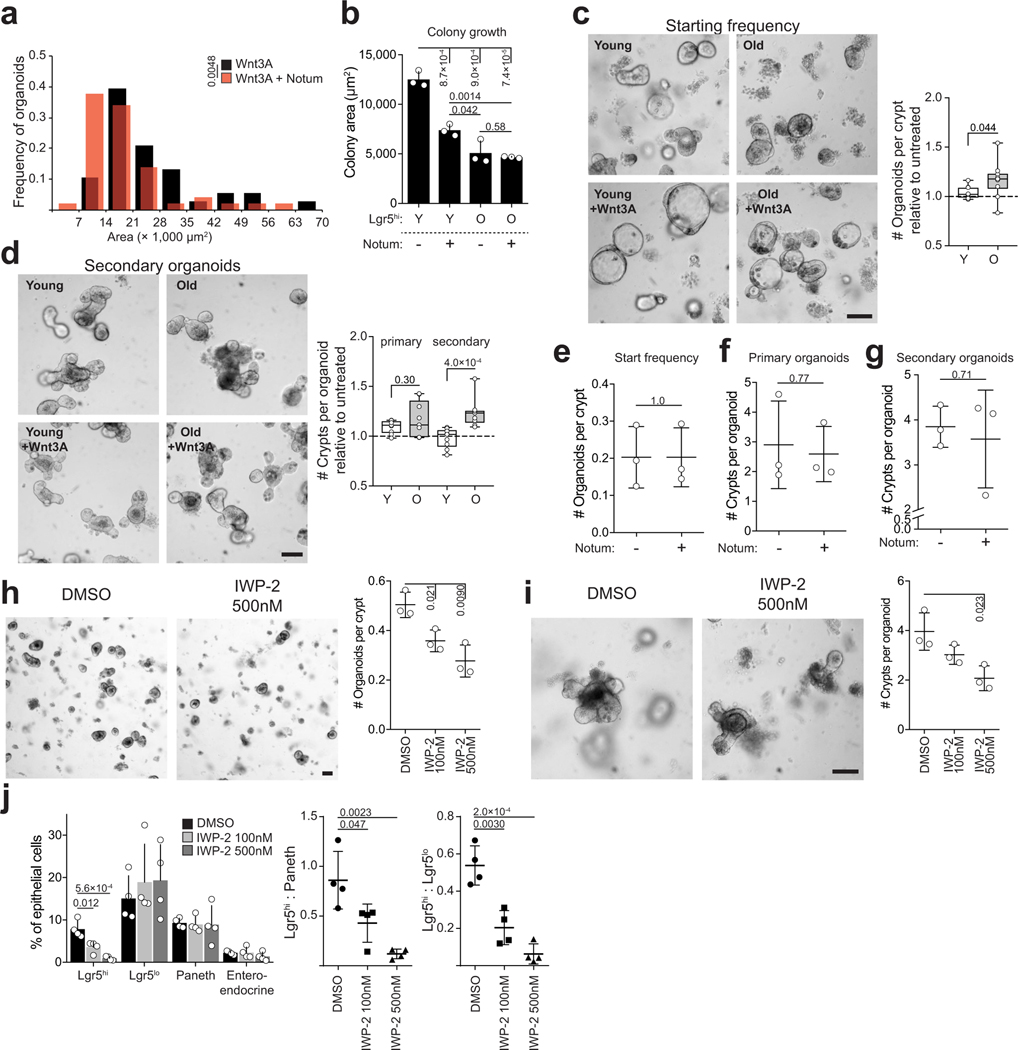
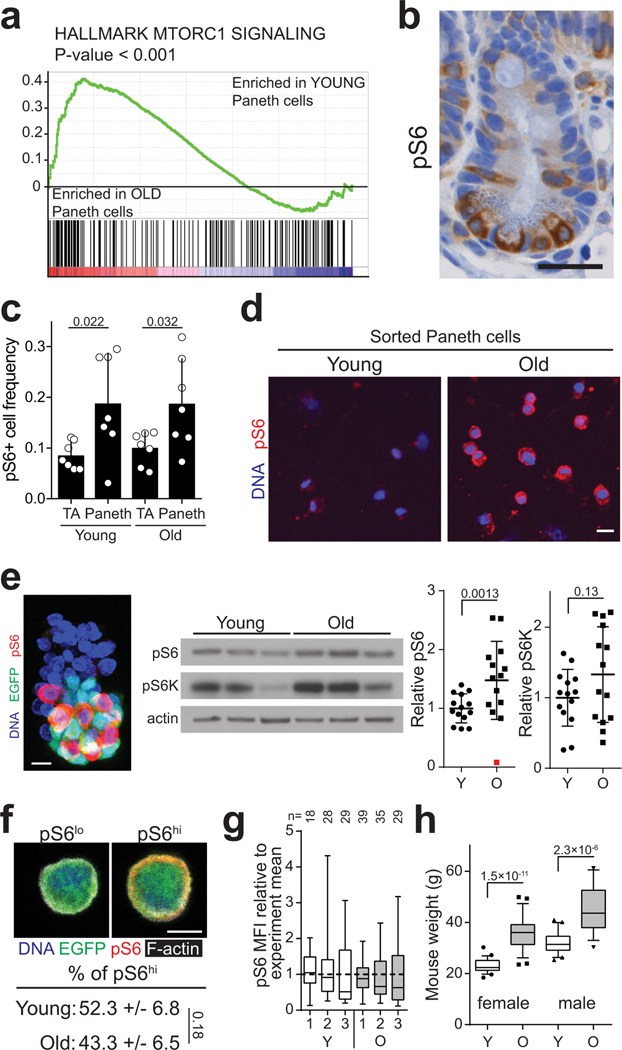
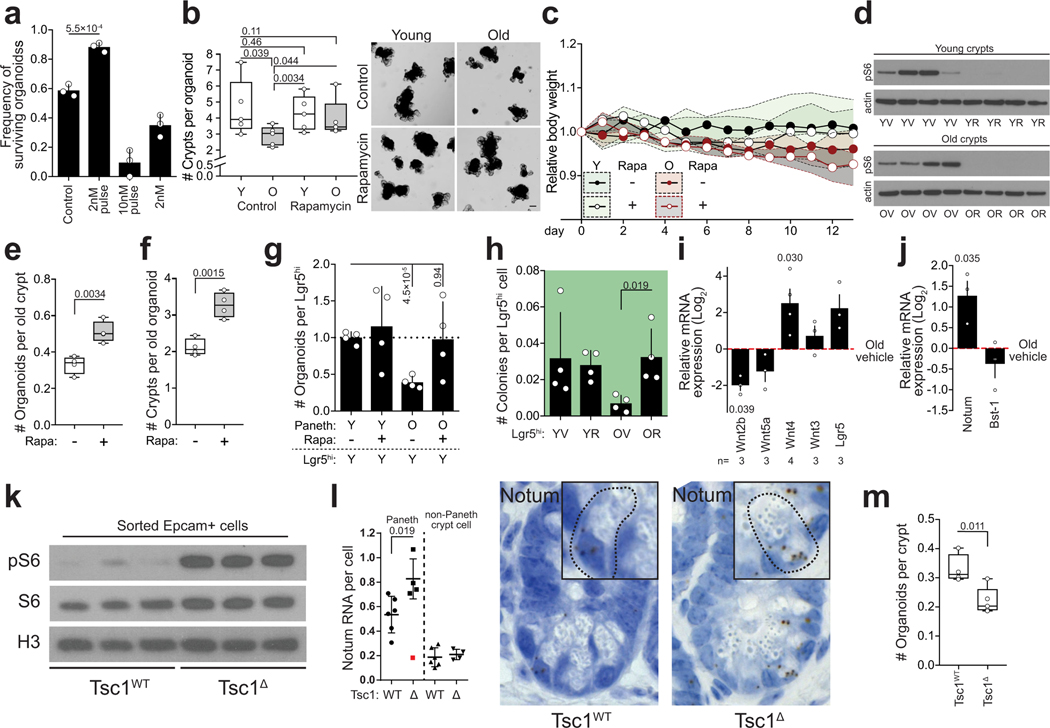
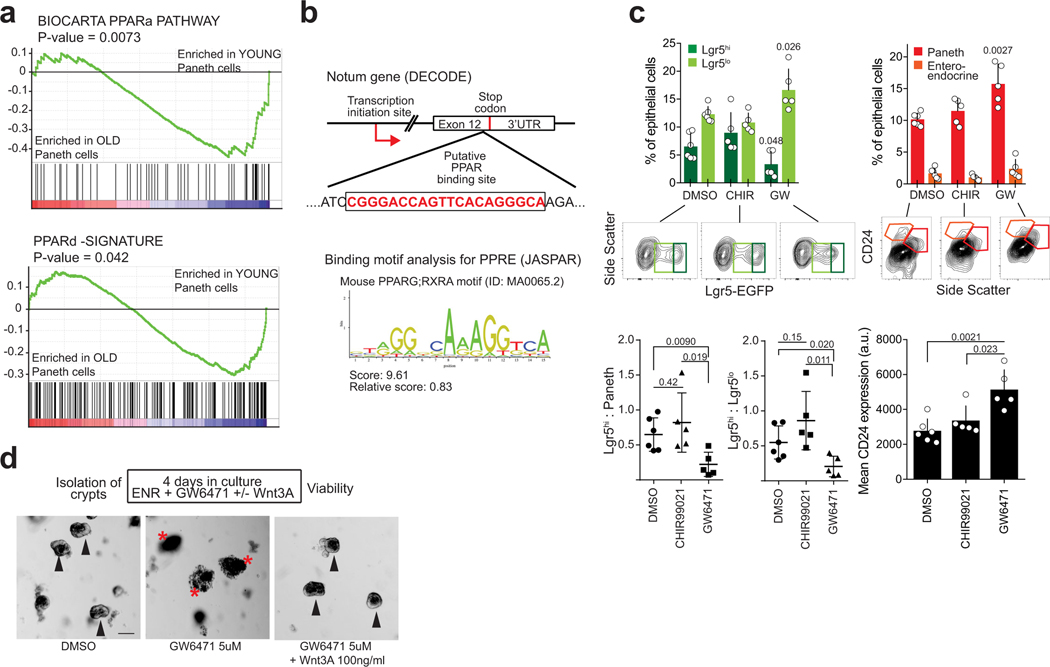
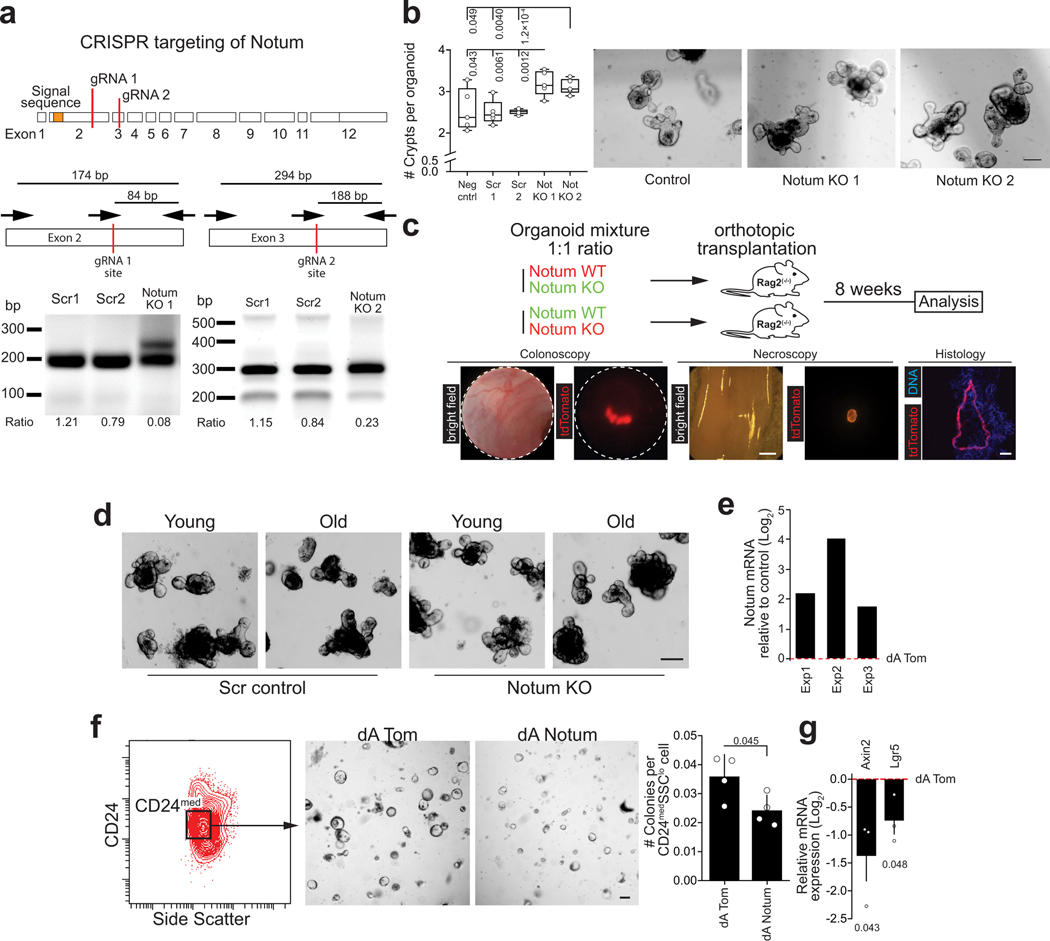
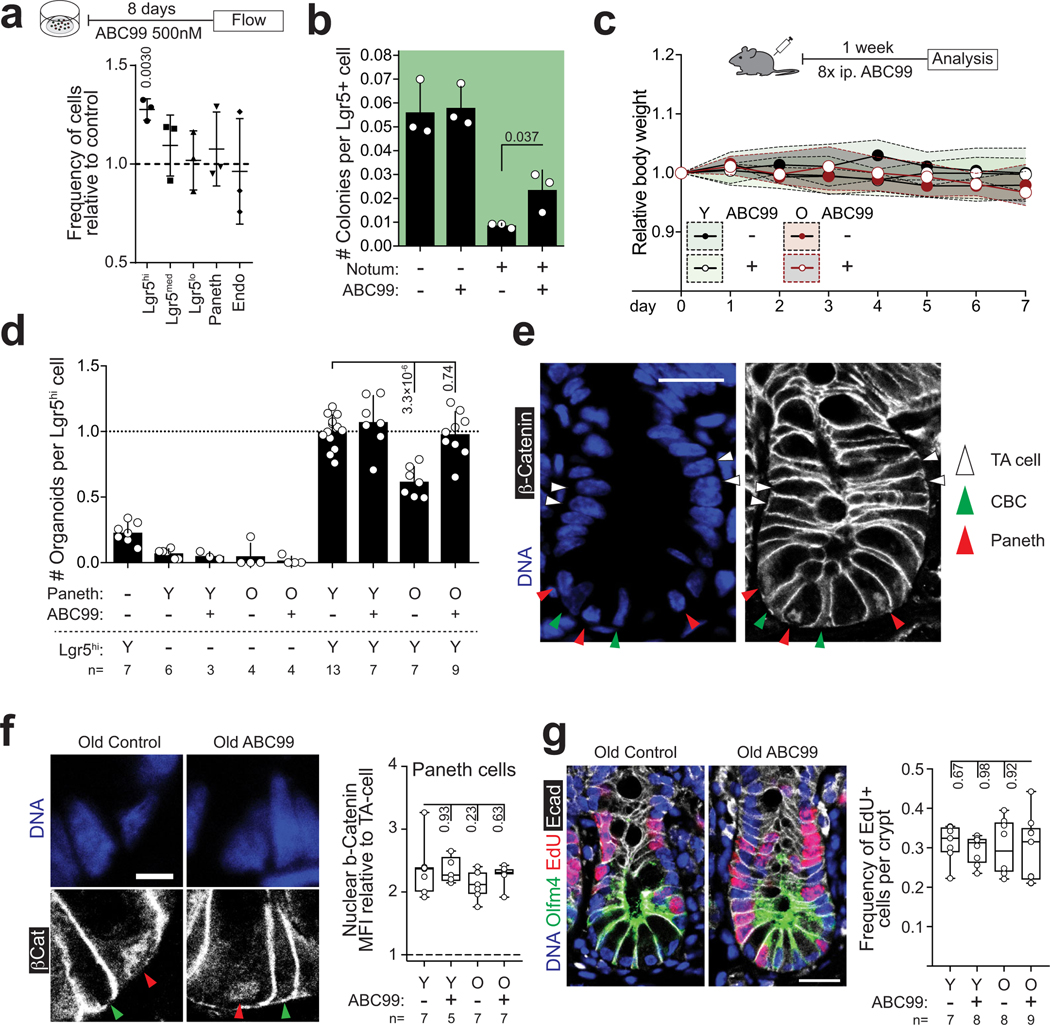
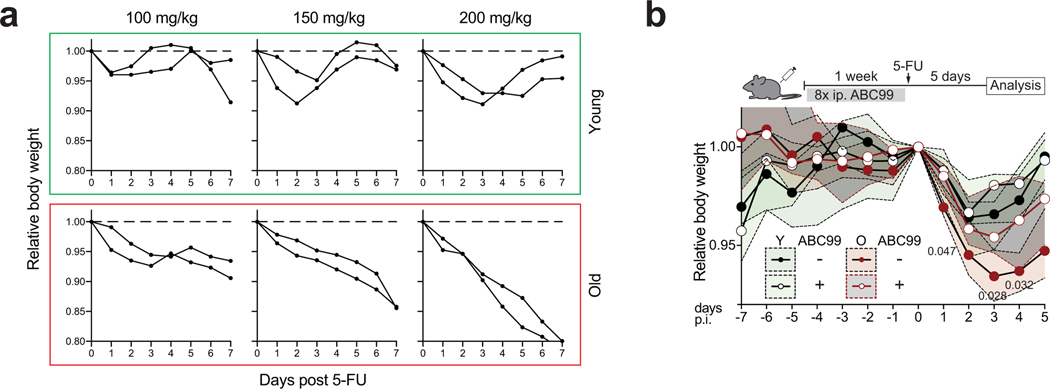
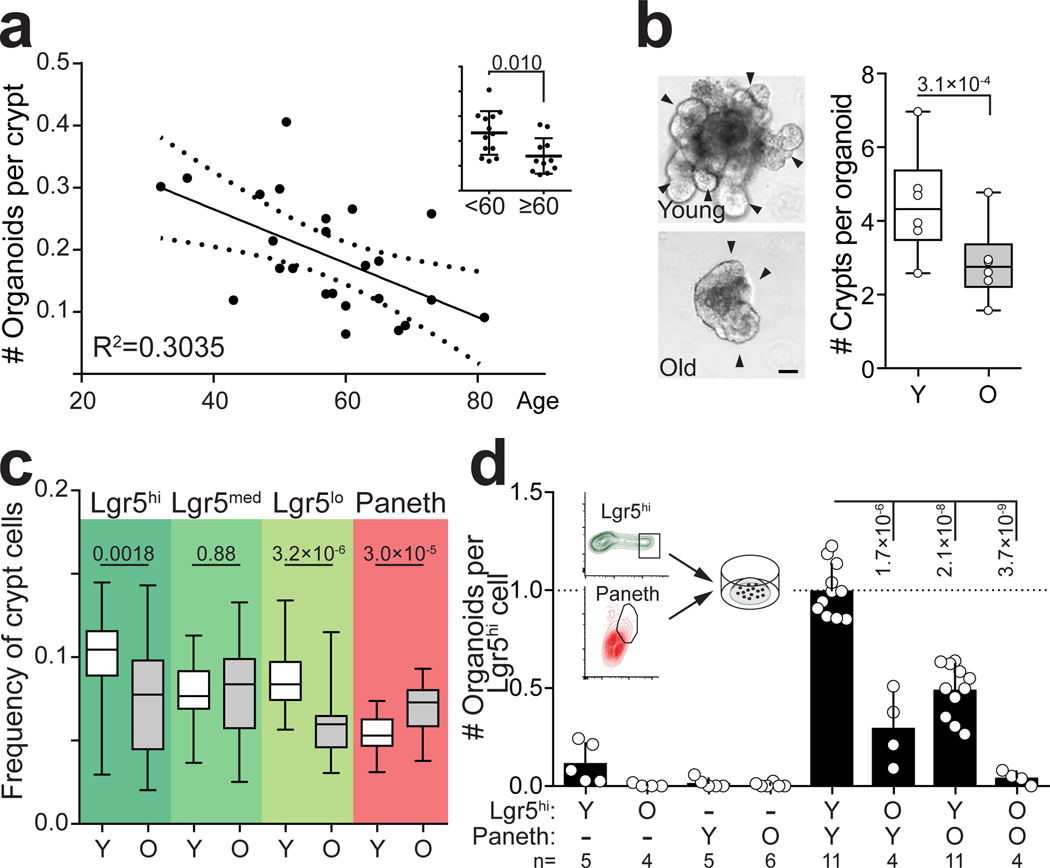
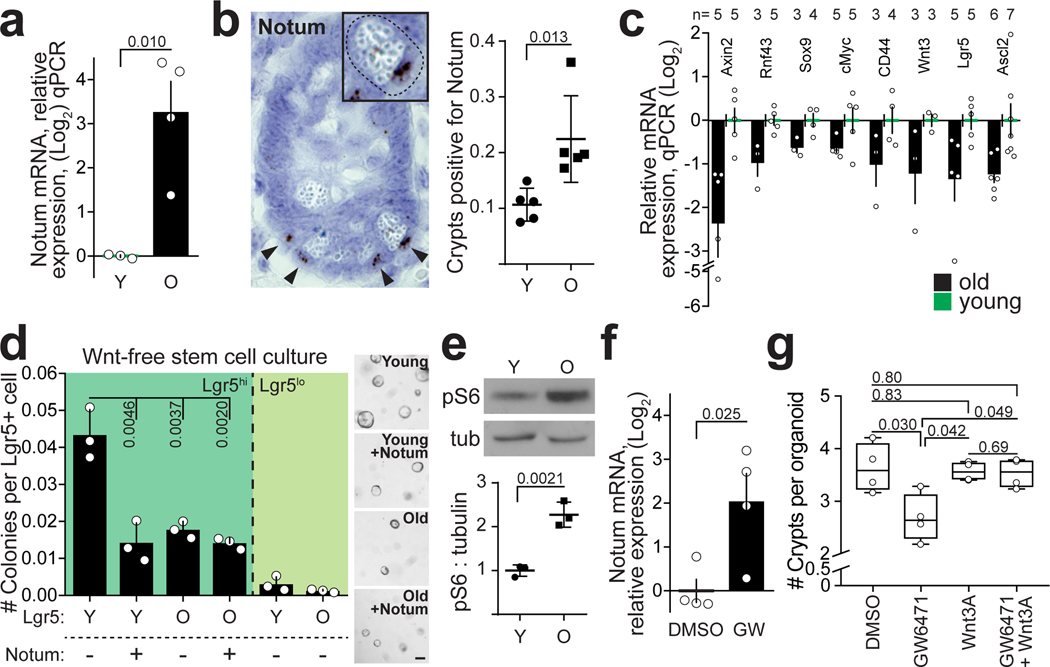
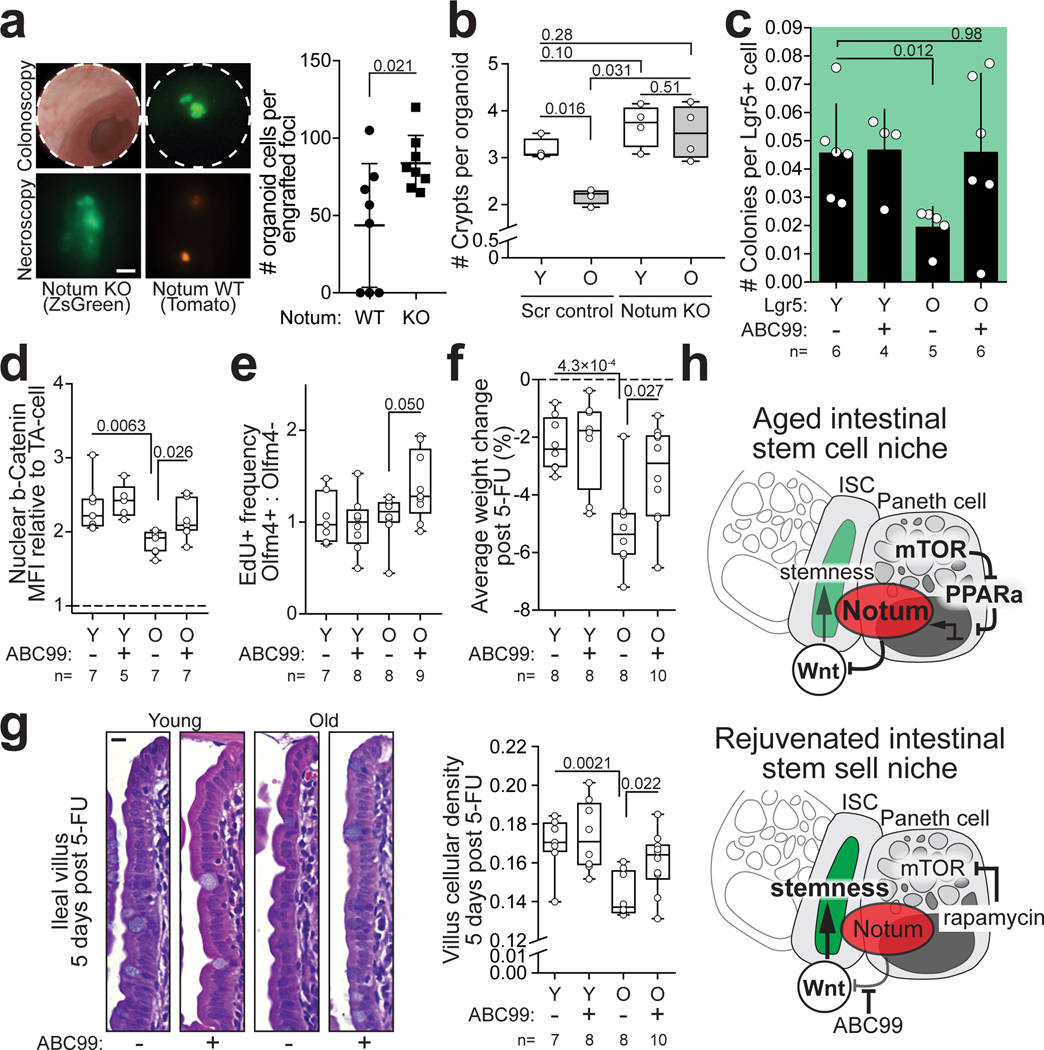
A decline in stem cell function impairs tissue regeneration during ageing, but the role of the stem-cell-supporting niche in ageing is not well understood. The small intestine is maintained by actively cycling intestinal stem cells that are regulated by the Paneth cell niche1,2. Here we show that the regenerative potential of human and mouse intestinal epithelium diminishes with age owing to defects in both stem cells and their niche. The functional decline was caused by a decrease in stemness-maintaining Wnt signalling due to production of Notum, an extracellular Wnt inhibitor, in aged Paneth cells. Mechanistically, high activity of mammalian target of rapamycin complex 1 (mTORC1) in aged Paneth cells inhibits activity of peroxisome proliferator activated receptor α (PPAR-α)3, and lowered PPAR-α activity increased Notum expression. Genetic targeting of Notum or Wnt supplementation restored function of aged intestinal organoids. Moreover, pharmacological inhibition of Notum in mice enhanced the regenerative capacity of aged stem cells and promoted recovery from chemotherapy-induced damage. Our results reveal a role of the stem cell niche in ageing and demonstrate that targeting of Notum can promote regeneration of aged tissues.


Conflict of interest statement

COMPETING FINANCIAL INTERESTS

The authors declare no competing financial interests.

Figures

Extended Data Figure 1.
Characterization of aged intestine a, Organoid forming capacity of crypts from young and old mice (n=4 animals per group). Student’s paired t-test. b, Frequency of organoids unable to form new crypts (fission deficiency) in young and old mice (n=6 animals per group) analysed 5–9 days after isolation. Student’s paired t-test. c, Distribution of regenerative growth capacity of primary organoids from young and old mice (n=6 animals per group). d, Regenerative growth of subcultured secondary mouse organoids (n=6 animals per group). Student’s paired t-test. e, Distribution of regenerative growth capacity of subcultured secondary organoids from old and young mice (n=6 animals per group). f, Representative Hematoxylin&Eosin staining of mouse jejunal sections from young and old animals (4 animals analysed per group). g, Quantification of EdU+ cells in jejunal crypts 2h post administration. Only cells next to Lysozyme+ Paneth cells were quantified as crypt base columnar (CBC) stem cells. Crypt cells that were not touching Lysozyme+ cells were quantified as transit-amplifying (TA) cells (n=5 animals per group). Representative image of crypt stained for EdU (cyan), DAPI (nuclei, blue), Lysozyme (white), and E-cadherin (red). Scale bar 20 μm. h, Quantification of Ki67+ cells in human ileal biopsies. Cells at the crypt bottom with elongated nuclei next to postmitotic Paneth cells were counted as CBCs. Cells not at the crypt base were considered TA-cells. (n=6 for 20–25 years old donors, n=10 for ≥75 years old donors). i, Representative gating of Lgr5hi, Lgr5med, Lgr5lo, Paneth and Enteroendocrine cells (in relation to Fig. 1c). Quantification of enteroendocrine cells (n=30 young, n=26 old). For FACS gating strategy, see Supplemental Data 1. j, Analysis of human ileal biopsy material for Lysozyme+ Paneth cells (n-values for analysed samples shown). k, Immunostaining and quantification of Olfm4+ stem and progenitor cells (green background, n=75 crypts from young and old. 5 individuals per age group) and Lysozyme+ Paneth cells in jejunal crypts (red background, n=115 crypts from young and n=117 crypts from old mice, 5 individuals per age group). Whiskers plotted according to Tuckey’s method. Scale bars 10μm. l, Ratio of Lgr5hi stem cells and Lgr5med progenitor cells and ratio of Lgr5hi stem cells and Paneth cells analyzed by flow cytometry from isolated crypts (n=30 young, n=26 old). Whiskers plotted according to Tuckey’s method. m, Regenerative growth of young Lgr5hi stem cells co-cultured with young or old Paneth cells. Quantification at Day 8–11. (n=6). Representative images are from day 8. Scale bar 100μm, Student’s paired t-test. n, Long-term clonogenicity of young and old Lgr5hi stem cells co-cultured with young and old Paneth cells. Serially passaged organoids were quantified 21 days after initial plating (n=14 animals per age group). Combinations compared to average of young Lgr5hi cells co-cultured with young and old Paneth cells. o, 14 day co-culture of Paneth cells from tdTomato expressing mouse (R26-mTmG) with Lgr5hi stem cells from Lgr5-EGFP-IRES-CreERT2 mouse show long term niche-interactions in organoid culture. Scale bar 100μm. Similar results seen in 3 replicate wells from cocultures of the same mice. Y = mice between 3 and 9 months of age, O = mice over 24 months of age in all experiments. Unless otherwise indicated, line at Box-and-Whisker -plots represents median, box interquartile range and whiskers range. All other data are represented as mean +/− s.d. and conditions compared with two-tailed unpaired Student’s t-test, exact P-values shown in corresponding panels. P-values < 0.05 were considered significant.
Extended Data Figure 2.
Characterization of gene expression in old Paneth and ISCs a, Venn-diagram of gene expression changes in old Paneth cells. (n=5 animals in old, n=4 animals in young) b, List of Gene Ontology (GO) terms with the highest enrichment among genes deregulated in old Paneth cells, Fisher’s exact test, no correction for multiple testing. c, Expression of stem cell maintaining factors Wnt3, Egf, and of Notum and Bst-1 in old Paneth cells (RNA-seq). Values show fold change in comparison to young Paneth cells. (n=5 animals in old, n=4 animals in young). d, Gene editing of Bst-1 confirmed by PCR strategy with primers flanking the editing site (191bp product) and hitting the edited site (89bp product). Representative agarose gel image is shown. Experiment repeated once to validate the organoid line used in Extended Data Fig. 2e. e, Regenerative growth of Bst-1 KO intestinal organoids. Organoids were quantified 2 days after subculturing (n=5 repeated experiments with the same organoid line). f, Venn-diagram of gene expression changes in old Lgr5hi stem cells. GSEA preranked analysis of old versus young Lgr5hi stem cells for the gene list “KEGG WNT SIGNALING PATHWAY”. Nominal P-value is shown. (n=3 animals per age group). g, RNA-scope for NOTUM mRNA (brown) in human jejunal section. Expression seen exclusively in Paneth cells (arrowheads and inset). Experiment repeated twice with similar results in independent samples. h, Expression of human NOTUM and LGR5 from terminal ileal samples of GTEx Consortium (n=51 sex matched samples). Expression range is divided to three equal-sized tertiles. Unless otherwise indicated, line at Box-and-Whisker -plots represents median, box interquartile range and whiskers range. All other data are represented as mean +/− s.d. and conditions compared with two-tailed unpaired Student’s t-test, exact P-values shown in corresponding panels. P-values < 0.05 were considered significant. For gel source data see Supplementary Fig. 3.
Extended Data Figure 3.
Wnt -ligands increase ISCs regenerative capacity a, Distribution of organoid size on Day 5 in ENR + 100 ng/ml Wnt3A +/− 1μg/ml recombinant Notum (n=50 organoids for Notum treated (red), n=38 organoids for untreated (black)). b, Area of colonies from sorted Lgr5hi stem cells from young and old animals (n=3 animals per age group). Area quantified at Day 7. c, Organoid forming capacity of crypts from young and old mice treated with +/− 100ng/ml Wnt3A. Starting frequency was quantified on Day 2 and is represented relative to untreated control (n=10 animals per age group). d, Primary and secondary regenerative growth of young and old organoids treated +/− 100ng/ml Wnt3A for the first 2 days of culture. Primary organoids were quantified at Day 6 and secondary organoids 2 days after subculturing. Data is represented relative to untreated control (n=9 animals per age group). e, Organoid forming capacity of isolated crypts from young mice treated with +/− 1 μg/ml of recombinant Notum (n=3 animals). f, Primary regenerative growth of organoids from young mice treated with +/− 1 μg/ml of recombinant Notum quantified on Day 6 (n=3 animals). g, Secondary regenerative growth of organoids from young mice treated with +/− 1 μg/ml of recombinant Notum, quantified on Day 2 after subculture (n=3 animals). h, Organoid forming capacity of isolated crypts at Day 2 from young mice treated with Porcupine inhibitor IWP-2 (n=3 animals). i, Primary regenerative growth of organoids treated with IWP-2 for the first 2 days of culture. Organoids were quantified on Day 6 (n=3 animals). j, Flow cytometry analysis of cellular frequencies from Lgr5-EGFP organoids 2 days after treatment with IWP-2 (n=4 animals). Y = mice between 3 and 9 months of age, O = mice over 24 months of age in all experiments. Unless otherwise indicated, line at Box-and-Whisker -plots represents median, box interquartile range and whiskers range. All other data are represented as mean +/− s.d. and conditions compared with two-tailed unpaired Student’s t-test, exact P-values shown in corresponding panels. P-values < 0.05 were considered significant.
Extended Data Figure 4.
Increased mTORC1 activity in old Paneth cells, but not in ISCs a, GSEA analysis for gene list “HALLMARK MTORC1” (for statistics, see RNA sequencing and data processing). Nominal P-value is shown (n=5 animals in old, n=4 animals in young). b, Immunohistochemical staining of pS6 (ser240/244) at mouse jejunal crypt. pS6 positive Paneth cells at the crypt bottom are separated by pS6 negative CBCs. Scale bar 25 μm. Experiment was repeated in total for 14 animals with similar results c, Quantification of pS6+ cells in jejunal crypts (n=7 animals per age group). TA: transit-amplifying progenitor cell. d, Isolated Paneth cells from young and old animals stained with pS6 (red) antibody, DAPI (nuclei, blue). Scale bar 10 μm. Representative image from 2 independent experiments. e, Immunofluorescent image of isolated crypt stained with pS6 antibody (red), Lgr5-EGFP (green) and DAPI (nuclei,blue). Scale bar 10 μm. Representative of 2 independent experiments. Immunoblots of pS6 and pS6K from isolated crypts of young and old mice, and densitometric quantification (ratio to actin) (n=14 animals per age group). An outlier (red) deviating > 2 s.d. was removed from the analysis. Mean +/− s.d. f, Isolated Lgr5hi stem cells (EGFP,green) from young and old animals stained with pS6 (red) antibody, phalloidin (F-actin, white), DAPI (nuclei,blue). Cells were distributed to pS6hi (cells with higher than mean pS6 intensity) or pS6lo (lower than mean pS6 intensity) categories. (n=3 independent experiments), mean +/− s.d. g, Distribution of pS6 intensity in isolated Lgr5hi cells from young and old animals (n=3 animals per age group, number of cells analyzed shown above the corresponding box and whisker plots). h, Mouse weights (n=25 for young female, n=26 for old female, n=20 for young male, n=19 for old male). Whiskers plotted according to Tuckey’s method. Y = mice between 3 and 9 months of age, O = mice over 24 months of age in all experiments. Unless otherwise indicated, line at Box-and-Whisker -plots represents median, box interquartile range and whiskers range. All other data are represented as mean +/− s.d. and conditions compared with two-tailed unpaired Student’s t-test, exact P-values shown in corresponding panels. P-values < 0.05 were considered significant. For gel source data see Supplementary Fig. 3.
Extended Data Figure 5.
Inhibiting mTORC1 activity in old mice restores intestinal regenerative capacity a, Organoid forming capacity and survival of subcultured intestinal organoids treated with rapamycin. Crypts were either treated continuously for 4 days (2nM), or with a 2 days pulse (2nM pulse, 10nM pulse) followed by 2 days in normal media before subculturing and quantification (n=3). b, Regenerative growth of organoids from young and old mice treated with 2nM rapamycin for 2 days ex vivo. Crypt number was scored 6–7 days after treatment from secondary subcultures (2 days after passage) (n=5 animals per age group). Student’s paired t-test. Representative images are from subcultures on Day 2. Scale bar 100 μm. c, Weight of animals receiving daily injections of rapamycin (4 mg/kg) or vehicle (n=5 animals per group). Daily data points represent median (circles) and interquartile range (dashed line). d, Immunoblots of pS6 from isolated crypts of vehicle (V) or rapamycin (R) treated young and old mice t (n=4 animals per group). e, Organoid forming capacity of isolated crypts from old mice treated with vehicle or rapamycin (n=4 animals per group) f, Primary regenerative growth of organoids from old mice treated with vehicle or rapamycin (n=4 animals per group) g, Organoid forming capacity of young Lgr5hi stem cells co-cultured with Paneth cells isolated from young or old mice treated with vehicle or rapamycin (n=4 animals per group). Combinations compared to average of co-cultures with young vehicle and old rapamycin treated Paneth cells. h, Clonogenic growth of Lgr5hi stem cells from young or old mice treated with vehicle or rapamycin (n=4 animals per group), colonies quantified at Day7. i, qPCR analysis of relative Wnt2b, Wnt5a, Wnt4, Wnt3 and Lgr5 expression from full jejunal samples of old mice treated with rapamycin. Values show Log2 fold change in comparison to old vehicle treated (n-values of mice analysed shown). Mean +/− s.e.m. j, qPCR analysis of relative Notum and Bst-1 expression from crypts of old mice treated with rapamycin. Values show Log2 fold change in comparison to old vehicle treated (n=3 animals per group). Mean +/− s.e.m. k, Immunoblots of pS6, S6 and H3 from isolated Epcam+ cells of wild type (Tsc1WT) and Tsc1 knockout (Tsc1Δ) epithelium (n=3 animals per group). l, Quantification of RNA-scope for Notum mRNA in wild type (Tsc1WT) and Tsc1 knockout (Tsc1Δ) ileal crypts (n=6 animals for Tsc1WT and 5 animals for Tsc1Δ). An outlier (red) deviating > 2 s.d was removed from the analysis. Representative images of crypts used in quantifications with Notum mRNA (brown) in Paneth cells (inset). m, Organoid forming capacity of isolated crypts from wild type (Tsc1WT) and Tsc1 knockout (Tsc1Δ) epithelium, quantification was done on Day 8. Y = mice between 3 and 9 months of age, O = mice over 24 months of age in all experiments. Unless otherwise indicated, line at Box-and-Whisker -plots represents median, box interquartile range and whiskers range. All other data are represented as mean +/− s.d. and conditions compared with two-tailed unpaired Student’s t-test, exact P-values shown in corresponding panels. P-values < 0.05 were considered significant. For gel source data see Supplementary Fig. 3.
Extended Data Figure 6.
Decreased PPAR-activity in aged intestine a, GSEA analysis for “BIOCARTA PPARa” and “PPARd” gene sets (for statistics, see RNA sequencing and data processing). Nominal P-value is shown (n=5 animals in old, n=4 animals in young). b, Schematic image of the putative PPARa binding site on the mouse and human Notum genes found with DECODE. Mouse sequence shown. Lower panel, score for the discovered site using JASPAR matrix models for mouse PPAR Response element (PPRE). PPARG;RXRA -motif was used. c, FACS analysis of cell populations in primary organoids treated for 3 days with DMSO, CHIR99021 or GW6471 (n=6 animals for DMSO, n=5 animals for CHIR99021 and GW6471). Ratios of Lgr5hi to Paneth cells, and Lgr5hi to Lgr5lo cells from the same analysis. Mean CD24 expression of live Epcam+ cells are also shown. d, Representative images of mouse intestinal organoids treated for 4 days with DMSO, 5 μM GW6471 or with 5 μM GW6471 + 100 ng/ml Wnt3A. Arrowheads indicate surviving and red asterisks collapsed organoids. Scale bar 100 μm. Experiment was repeated 4 times with similar results. Unless otherwise indicated, all data are represented as mean +/− s.d. and conditions are compared with two-tailed unpaired Student’s t-test, exact P-values shown in corresponding panels. P-values < 0.05 were considered significant.
Extended Data Figure 7.
Notum regulates intestinal stem cell function a, Notum gene targeting. Schematic represents sites of genome editing. Gene editing was confirmed by PCR strategy with primers flanking the editing site (174bp product for Notum KO1 and 294bp product for Notum KO2) and hitting the edited site (84bp product for Notum KO1 and 188bp product for Notum KO2). Representative agarose gel images from two independent experiments with similar results are shown. b, Regenerative growth of Notum KO organoids. De novo crypt domains were quantified 2 days after subculture (n=5 repeated experiments with the same organoid lines). Representative images of organoids 2 days after subculture are shown, scale bar 100 μm. c, Schematic presenting in vivo competition assay of gene-edited organoid growth by orthotopic transplantation to immunodeficient Rag2(−/−) mice. Representative colonoscopy, necroscopy and histology images used for assay quantification (n=8 mice transplanted). Scale bars 1mm for necroscopy and 200μm for histology images. d, Representative images of CRISPR-targeted young and old organoids 2 days after subculturing (n=4 animals per group) Scale bar 100 μm. e, Relative Notum expression in organoids with SAM complex targeted to Notum promoter (dA Notum) grown 2 days in ENR media. Three independent experiments relative to control (dA Tom). f, Quantification and representative images of Day 5 colonies formed by isolated CD24medSSClo cells from Notum activator (dA Notum) and control (dA Tom) organoids, scale bar 100 μm (n=4 repeated experiments with the same organoid line). g, qPCR analysis of relative Axin2 and Lgr5 expression in CD24medSSClo cells sorted from Notum activator (dA Notum) organoids. Values show Log2 fold change in comparison to control (dATom) (n=3 replicate wells per organoid line). Unless otherwise indicated, line at Box-and-Whisker -plots represents median, box interquartile range and whiskers range. All other data are represented as mean +/− s.e.m. and conditions compared with two-tailed unpaired Student’s t-test, exact P-values shown in corresponding panels. P-values < 0.05 were considered significant. For gel source data see Supplementary Fig. 3.
Extended Data Figure 8.
Notum inhibitor ABC99 prevents Wnt-inactivation a, Flow cytometry analysis of cell populations in primary organoids treated for 8 days with 500nM ABC99 (n=3 mice) Relative to DMSO control. Student’s paired t-test. b, Clonogenic growth of Lgr5hi stem cells on Day 5 treated with +/− 50nM ABC99 and +/− 500ng/ml recombinant Notum (2 independent experiments with similar results, one experiment with 3 replicate wells shown). c, Relative weight of animals treated with daily injections of ABC99 (10mg/kg) or control (vehicle or ABC101 10mg/kg) (n=10 mice for young control and young ABC99, n=8 mice for old control and n=9 mice for old ABC99). Daily data points represent median (circles) and interquartile range (dashed line). d, Clonogenic growth of young Lgr5hi stem cells co-cultured with young or old Paneth cells from +/− ABC99 treated mice (n-values for analysed mice shown). Combinations compared to average of co-cultures with young control (−) and old ABC treated (+) Paneth cells. e, Representative image of immunofluorescent staining of ileal crypts used for quantification of nuclear β-Catenin (white) intensity. Paneth cells (red arrowheads) and CBC (green arrowheads) were identified by cellular and nuclear (DAPI,blue) morphology. Their nuclear beta-catenin levels were compared to transit-amplifying (TA) cells (white arrowheads). Scale bar 20μm. (Experiment was repeated twice with total of 26 mice all showing strongest nuclear beta-catenin at the crypt bottom) f, Immunofluorescent staining of histological sections from old ileum. β-Catenin (white), Lysozyme (red) and DAPI (nuclei, blue). Scale bar 10μm. Quantification of relative nuclear β-Catenin intensity of Paneth cells (red arrowhead) (n-values for analysed mice shown). For quantification of CBCs (green arrowhead) see Fig. 3d. g, Immunofluorescent staining of histological sections from old ileum. Olfm4 (green), EdU (red) and DAPI (nuclei, blue). Scale bar 20μm. Quantification of EdU+ cellular frequencies within the crypt (n-values for analysed mice shown). Y = mice between 3 and 9 months of age, O = mice over 24 months of age in all experiments. Unless otherwise indicated, line at Box-and-Whisker -plots represents median, box interquartile range and whiskers range. All other data are represented as mean +/− s.d. and conditions compared with two-tailed unpaired Student’s t-test, exact P-values shown in corresponding panels. P-values < 0.05 were considered significant.
Extended Data Figure 9.
Old intestine recovers poorly from 5-FU induced damage a, Body weights of young and old mice following single injection of 5-Fluorouracil (5-FU, 100–200mg/kg). Two mice per group, body weight relative to day of injection (Day 0). b, Relative body weight of young and old mice treated 1 week with +/− ABC99 followed by single 5-Fluorouracil (5-FU, 100mg/kg) injection (n=8 mice for young vehicle, old vehicle and young ABC99 treated, n=10 mice for old ABC99 treated). Daily data points represent median (circles) and interquartile range (dashed line). Daily weight of Old ABC99 treated animals were compared to Old controls with two-tailed unpaired Student’s t-test, exact P-values shown under the corresponding daily weight. P-values < 0.05 were considered significant. Young mice between 3 and 4 months of age, Old mice over 20 months of age.
Figure 1.
Figure 1.
Age-associated reduction in intestinal regeneration is caused by decreased function of Lgr5+ stem cells and the Paneth cell niche a, Organoid forming capacity of human colonic crypts (n=24). Linear regression +/− 95% CI. Over 60 years old donors show significantly lower organoid-forming capacity (inset). b, Regenerative growth of crypts from old and young mice. Organoids derived from young mice (n=6) generate more de novo crypt domains (arrowheads) in primary cultures (5–9 days after isolation). Representative images from Day 7, Scale bar 50μm. Student’s paired t-test. c, Cellular frequencies analyzed by flow cytometry (n=30 young, n=26 old). For FACS gating strategy, see Supplementary Fig. 1. d, Clonogenicity of young and old Lgr5hi stem cells co-cultured with young and old Paneth cells (n-values for analysed mice shown). Combinations compared to average of young Lgr5hi cells co-cultured with young and old Paneth cells. Y = mice between 3 and 9 months of age, O = mice over 24 months of age in all experiments. Unless otherwise indicated, line at Box-and-Whisker -plots represents median, box interquartile range and whiskers range. All other data are represented as mean +/− s.d. and conditions compared with two-tailed unpaired Student’s t-test, exact P-values shown in corresponding panels. P-values < 0.05 were considered significant.
Figure 2.
Figure 2.
Increased Notum expression from Paneth cells attenuates Wnt signals in the old stem cells a, qPCR analysis of relative Notum expression from isolated Paneth cells (n=4 old, n=3 young animals). b, In situ analysis and quantification of Notum expression in mouse jejunum (n=5 animals in both age groups). Mean +/− s.d. c, Expression of Wnt responsive genes in isolated old Lgr5hi stem cells relative to young stem cell. Log2 fold change (n-values of mice analysed shown). d, Clonogenic capacity of isolated Lgr5+ from young and old mice cultured +/− recombinant Notum (1 μg/ml), (n=3 animals in both age groups). Representative images are from Day 7. Mean +/− s.d. Scale bar 100 μm e, Immunoblot and quantification of isolated young and old Paneth cells against pS6 and tubulin (n=3 animals in both age groups). Mean +/− s.d. f, Relative mRNA expression of Notum from small intestinal organoids of young mice treated 48h with 5 μM PPARa inhibitor GW6471 (n=4 biologically independent samples) g, Regenerative growth of small intestinal organoids at Day 6. Organoids were treated first 2 days with +/− GW6471 and +/− 100 ng/ml Wnt3A (n=4 biologically independent samples). Student’s paired t-test. Y = mice between 3 and 9 months of age, O = mice over 24 months of age in all experiments. Unless otherwise indicated, line at Box-and-Whisker -plots represents median, box interquartile range and whiskers range. All other data are represented as mean +/− s.e.m. and conditions compared with two-tailed unpaired Student’s t-test, exact P-values shown in corresponding panels. P-values < 0.05 were considered significant. For gel source data see Supplementary Fig. 3.
Figure 3.
Figure 3.
Inhibiting Notum activity in vivo restores Wnt mediated Paneth and stem cell function a, Growth of CRISPR-targeted organoids after orthotopic transplantation. Notum KO organoids were co-transplanted with competing Scramble-targeted controls. (n=8 mice transplanted) Scale bar 1 mm b, Regenerative growth of CRISPR-targeted small intestinal organoids from young and old mice (n=4 animals per group). Student’s paired t-test c, Clonogenic growth of Lgr5hi stem cells from +/− ABC99 treated mice. Control animals received equal amount of inactive compound analogue (ABC101) or vehicle (n-values for analysed mice shown). d, Quantification of relative nuclear b-Catenin intestity of CBCs (n-values for analysed mice shown). e, Quantification of EdU+ cellular frequencies within the crypt (n-values for analysed mice shown). f, Average weight change post 5-FU (days 1–5) (n-values for mice per group shown) g, Representative images of H&E stained villi 5 days post 5-FU, scale bar 10 μm. Quantification of cellular density in ileal villi (cells per μm, n-values for analysed mice shown). h, Schematic model of stem cell maintenance by Paneth cells in aged niche. Y = mice between 3 and 9 months of age, O = mice over 21 months of age in all experiments. Unless otherwise indicated, line at Box-and-Whisker -plots represents median, box interquartile range and whiskers range. All other data are represented as mean +/− s.d. and conditions compared with two-tailed unpaired Student’s t-test, exact P-values shown in corresponding panels. P-values <0.05 were considered significant.

References

    1. Barker N. et al. Identification of stem cells in small intestine and colon by marker gene Lgr5. Nature 449, 1003–1007 (2007). - PubMed
    1. Sato T. et al. Paneth cells constitute the niche for Lgr5 stem cells in intestinal crypts. Nature 469, 415–418, doi:10.1038/nature09637 (2011). - DOI - PMC - PubMed
    1. Sengupta S, Peterson TR, Laplante M, Oh S. & Sabatini DM mTORC1 controls fasting-induced ketogenesis and its modulation by ageing. Nature 468, 1100–1104, doi:nature09584 [pii] 10.1038/nature09584 (2010). - DOI - PubMed
    1. Molofsky AV et al. Increasing p16INK4a expression decreases forebrain progenitors and neurogenesis during ageing. Nature 443, 448–452, doi:nature05091 [pii] 10.1038/nature05091 (2006). - DOI - PMC - PubMed
    1. Rossi DJ et al. Deficiencies in DNA damage repair limit the function of haematopoietic stem cells with age. Nature 447, 725–729, doi:nature05862 [pii] 10.1038/nature05862 (2007). - DOI - PubMed
REFERENCES FOR METHODS
    1. Sato T. et al. Long-term expansion of epithelial organoids from human colon, adenoma, adenocarcinoma, and Barrett’s epithelium. Gastroenterology 141, 1762–1772, doi:10.1053/j.gastro.2011.07.050 (2011). - DOI - PubMed
    1. Sanjana NE, Shalem O. & Zhang F. Improved vectors and genome-wide libraries for CRISPR screening. Nat Methods 11, 783–784, doi:10.1038/nmeth.3047 (2014). - DOI - PMC - PubMed
    1. Dahlman JE et al. Orthogonal gene knockout and activation with a catalytically active Cas9 nuclease. Nat Biotechnol 33, 1159–1161, doi:10.1038/nbt.3390 (2015). - DOI - PMC - PubMed
    1. Sanchez-Rivera FJ et al. Rapid modelling of cooperating genetic events in cancer through somatic genome editing. Nature 516, 428–431, doi:10.1038/nature13906 (2014). - DOI - PMC - PubMed
    1. Martin M. Cutadapt removes adapter sequences from high-throughput sequencing reads. 2011 17, doi:10.14806/ej.17.1.200 pp. 10–12 (2011). - DOI

Publication types

MeSH terms