

Connectomics and molecular imaging in neurodegeneration
- PMID: 31292699
- PMCID: PMC7613672
- DOI: 10.1007/s00259-019-04394-5
Connectomics and molecular imaging in neurodegeneration
Abstract
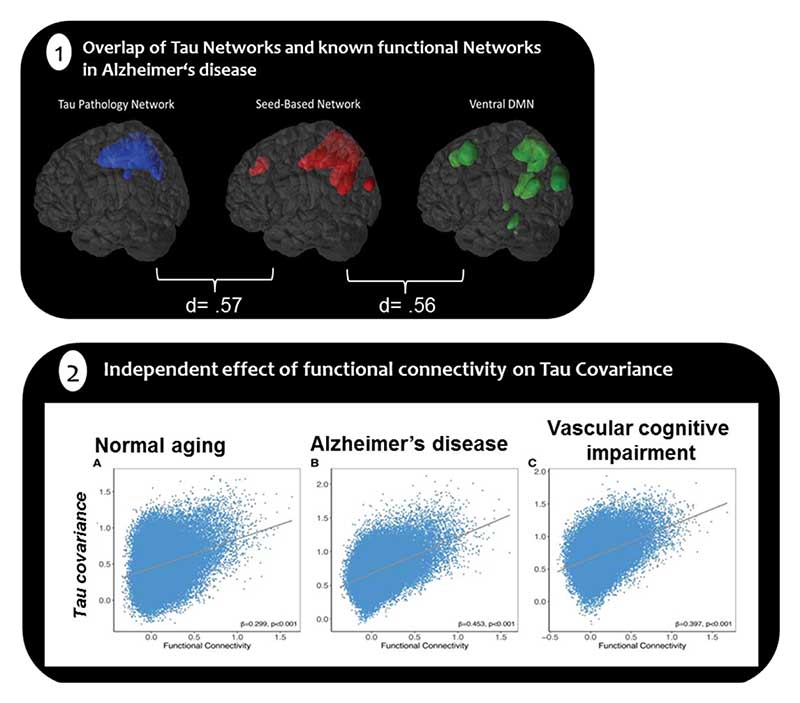
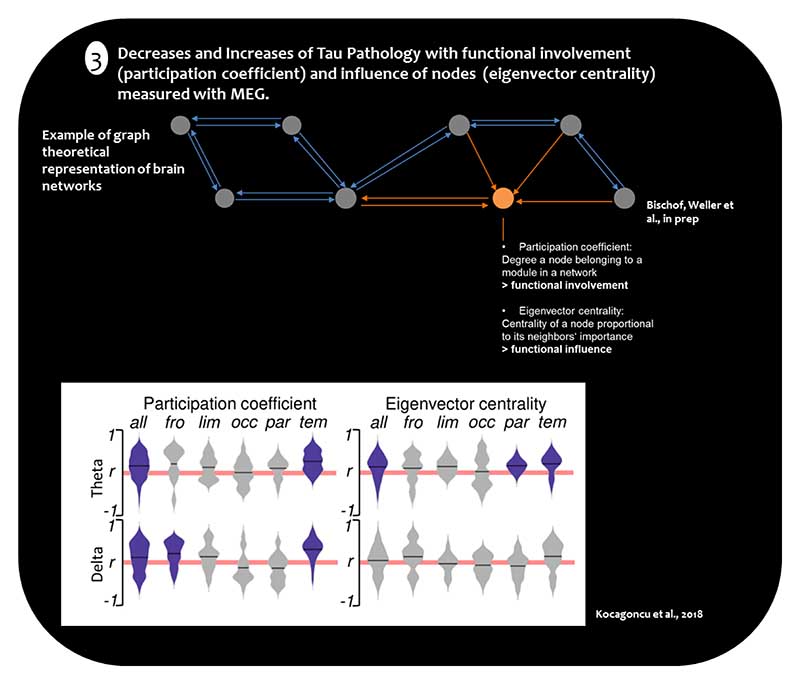
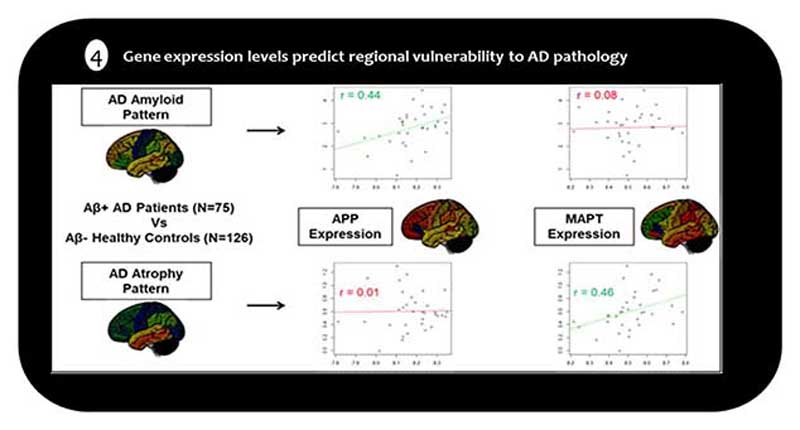
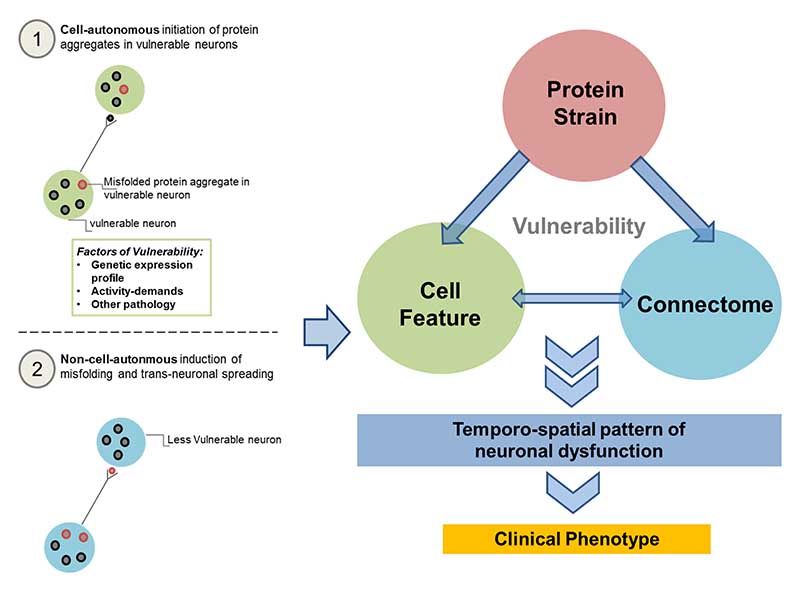
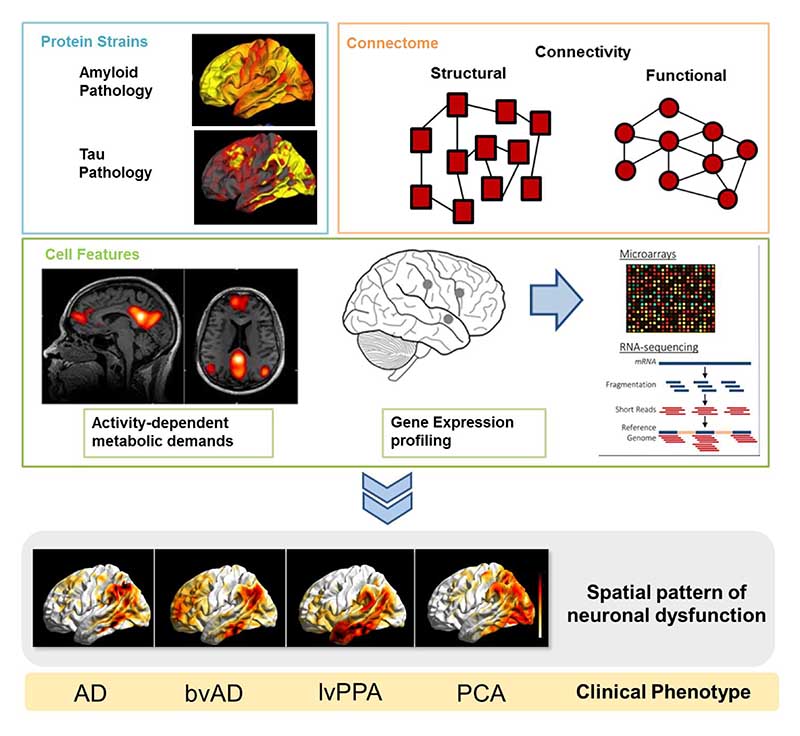
Our understanding on human neurodegenerative disease was previously limited to clinical data and inferences about the underlying pathology based on histopathological examination. Animal models and in vitro experiments have provided evidence for a cell-autonomous and a non-cell-autonomous mechanism for the accumulation of neuropathology. Combining modern neuroimaging tools to identify distinct neural networks (connectomics) with target-specific positron emission tomography (PET) tracers is an emerging and vibrant field of research with the potential to examine the contributions of cell-autonomous and non-cell-autonomous mechanisms to the spread of pathology. The evidence provided here suggests that both cell-autonomous and non-cell-autonomous processes relate to the observed in vivo characteristics of protein pathology and neurodegeneration across the disease spectrum. We propose a synergistic model of cell-autonomous and non-cell-autonomous accounts that integrates the most critical factors (i.e., protein strain, susceptible cell feature and connectome) contributing to the development of neuronal dysfunction and in turn produces the observed clinical phenotypes. We believe that a timely and longitudinal pursuit of such research programs will greatly advance our understanding of the complex mechanisms driving human neurodegenerative diseases.
Keywords: Functional Connectivity; Multimodal Imaging; Pathophysiological Spreading; Proteinpathology; Selective Vulnerability.
Conflict of interest statement
Figures
References
-
- Bischof GN, Endepols H, van Eimeren T, Drzezga A. Tau-imaging in neurodegeneration. Methods. 2017;130:114–23. - PubMed
-
- Hammes J, Bischof GN, Drzezga A. Molecular imaging in early diagnosis, differential diagnosis and follow-up of patients with neurodegenerative diseases. Clin Transl Imaging. 2017;5:465–71.
-
- Teipel S, Drzezga A, Grothe MJ, Barthel H, Chételat G, Schuff N, et al. Multimodal imaging in Alzheimer’s disease: validity and usefulness for early detection. The Lancet Neurology. 2015;14:1037–53. - PubMed
-
- Strafella AP, Bohnen NI, Perlmutter JS, Eidelberg D, Pavese N, Van Eimeren T, et al. Molecular imaging to track Parkinson’s disease and atypical parkinsonisms: New imaging frontiers. Mov Disord. 2017;32:181–92. - PubMed
-
- Barthel H, Sabri O. Clinical Use and Utility of Amyloid Imaging. J Nucl Med. 2017;58:1711–7. - PubMed
Publication types
MeSH terms
Grants and funding
LinkOut - more resources
Full Text Sources
Medical
